Home > Comparison > Technology > GLW vs SNDK
The strategic rivalry between Corning Incorporated and Sandisk Corporation shapes the evolution of the technology hardware sector. Corning operates as a diversified industrial powerhouse with broad applications in display technologies, optics, and specialty materials. Sandisk focuses on high-margin NAND flash storage solutions, emphasizing innovation in solid-state drives. This analysis assesses which company’s operational model and strategic positioning offer superior risk-adjusted returns for a diversified technology portfolio.
Table of contents
Companies Overview
Corning Incorporated and Sandisk Corporation both hold critical positions in the hardware and technology sectors.
Corning Incorporated: Diverse Innovator in Glass and Optical Solutions
Corning Incorporated dominates hardware and equipment with diversified revenue streams across display technologies, optical communications, and specialty materials. Its core business hinges on manufacturing glass substrates for displays and optical fibers for communications. In 2026, Corning emphasizes expanding its specialty materials and life sciences divisions to leverage advanced material science innovations.
Sandisk Corporation: Flash Storage Pioneer
Sandisk Corporation specializes in NAND flash technology, generating revenue by developing solid state drives, embedded products, and removable storage solutions. Its focus remains sharply on enhancing storage capacity and speed for consumer and enterprise applications. In 2026, Sandisk’s strategy targets broadening product performance and market penetration in high-growth digital storage sectors.
Strategic Collision: Similarities & Divergences
Corning pursues a diversified technology model spanning multiple industries, while Sandisk concentrates on a focused storage innovation niche. Their competition converges in hardware components, but Corning’s broad ecosystem contrasts with Sandisk’s specialized product line. This divergence creates distinct investment profiles: Corning offers stability through diversity, Sandisk targets high growth with greater volatility.
Income Statement Comparison
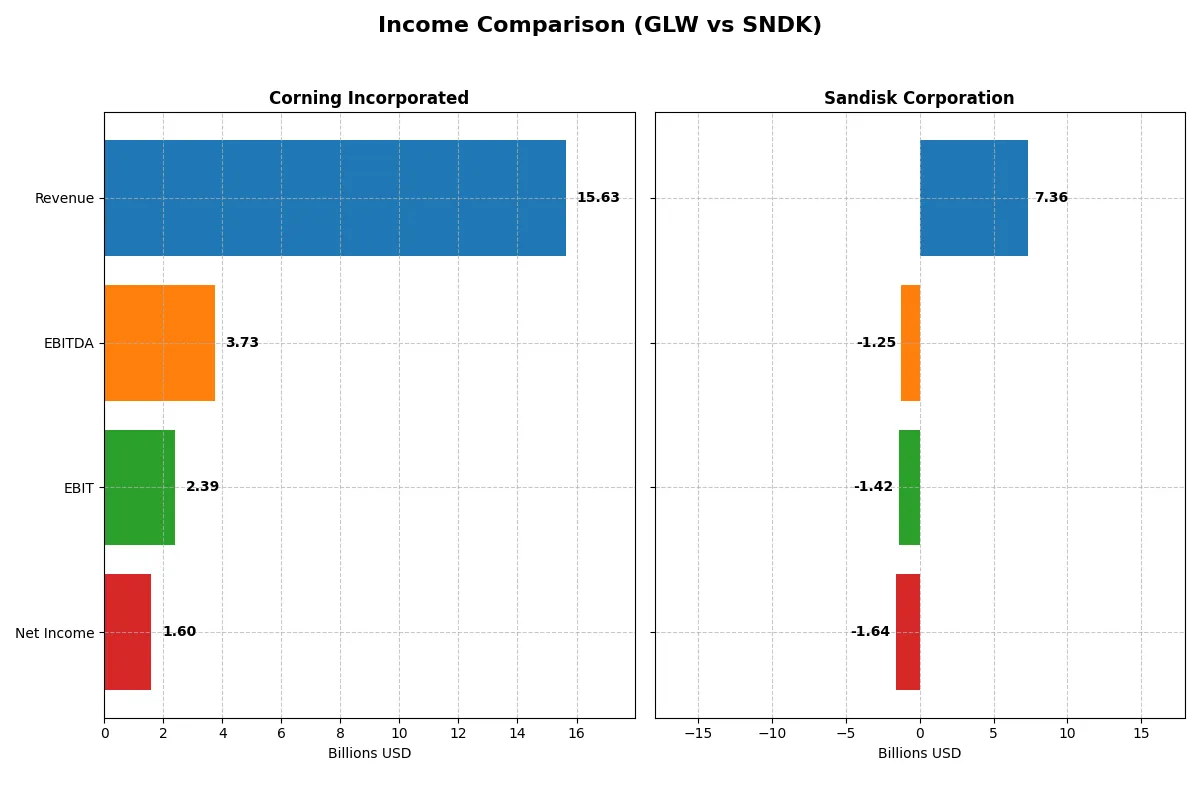
This data dissects the core profitability and scalability of both corporate engines to reveal who dominates the bottom line:
| Metric | Corning Incorporated (GLW) | Sandisk Corporation (SNDK) |
|---|---|---|
| Revenue | 15.6B | 7.4B |
| Cost of Revenue | 10.1B | 5.1B |
| Operating Expenses | 3.2B | 3.6B |
| Gross Profit | 5.5B | 2.2B |
| EBITDA | 3.7B | -1.3B |
| EBIT | 2.4B | -1.4B |
| Interest Expense | 336M | 63M |
| Net Income | 1.6B | -1.6B |
| EPS | 1.86 | -11.32 |
| Fiscal Year | 2025 | 2025 |
Income Statement Analysis: The Bottom-Line Duel
This income statement comparison reveals the true efficiency and profitability momentum of two distinct corporate engines.
Corning Incorporated Analysis
Corning’s revenue grew steadily to $15.6B in 2025, with net income surging to $1.6B. Its gross margin of 35.3% and net margin over 10% signal strong profitability. The company doubled its EBIT in 2025, reflecting sharp operational efficiency and solid momentum after consistent growth since 2021.
Sandisk Corporation Analysis
Sandisk’s revenue expanded by 10% to $7.4B in 2025, but it reported a net loss of $1.64B. Despite a decent gross margin of 30%, its negative EBIT margin (-19.3%) and net margin (-22.3%) highlight severe profitability issues. The company’s financial performance deteriorated sharply, showing operational challenges and margin compression.
Margin Strength vs. Profitability Crisis
Corning clearly outperforms Sandisk with robust margin health and positive net income growth. Sandisk’s significant losses and negative margins underscore fundamental weaknesses. For investors, Corning’s consistent profit expansion and improving efficiency offer a more attractive and reliable earnings profile.
Financial Ratios Comparison
These vital ratios act as a diagnostic tool to expose the underlying fiscal health, valuation premiums, and capital efficiency of the companies compared below:
| Ratios | Corning Inc. (GLW) | Sandisk Corp. (SNDK) |
|---|---|---|
| ROE | 13.5% | -17.8% |
| ROIC | 7.4% | -11.9% |
| P/E | 47.2 | -4.2 |
| P/B | 6.38 | 0.74 |
| Current Ratio | 1.59 | 3.56 |
| Quick Ratio | 1.04 | 2.11 |
| D/E | 0.71 | 0.22 |
| Debt-to-Assets | 27.2% | 15.7% |
| Interest Coverage | 6.78 | -21.9 |
| Asset Turnover | 0.50 | 0.57 |
| Fixed Asset Turnover | 1.05 | 11.88 |
| Payout ratio | 62.6% | 0% |
| Dividend yield | 1.33% | 0% |
| Fiscal Year | 2025 | 2025 |
Efficiency & Valuation Duel: The Vital Signs
Financial ratios act as a company’s DNA, exposing hidden risks and highlighting operational strengths essential for investor insight.
Corning Incorporated
Corning shows a solid net margin at 10.21%, signaling profitability, while ROE at 13.52% remains neutral versus its cost of capital. Its P/E ratio is stretched at 47.18, indicating an expensive valuation. The company returns value with a modest 1.33% dividend yield, balancing shareholder rewards with steady R&D investment at 7.1% of revenue.
Sandisk Corporation
Sandisk struggles with a negative net margin of -22.31% and a deeply unfavorable ROE of -17.81%, reflecting operational challenges. Its valuation metrics are cheap, with a P/E of -4.17 and a low P/B of 0.74, suggesting market skepticism. The firm pays no dividends, focusing instead on high R&D spending near 15.4%, aiming to rebuild growth.
Premium Valuation vs. Operational Safety
Corning balances moderate profitability with a premium valuation and consistent dividends, offering operational safety. Sandisk’s cheap valuation masks significant losses and weak returns. Investors seeking stable income and steady returns may prefer Corning, while those tolerant of risk might consider Sandisk’s turnaround potential.
Which one offers the Superior Shareholder Reward?
Corning Incorporated (GLW) pays a consistent dividend with a 1.33% yield and a payout ratio around 62.6%, supported by positive free cash flow of 1.64/share in 2025. Its moderate buyback activity, evidenced by stable payout ratios, complements shareholder returns sustainably. Sandisk Corporation (SNDK) offers no dividends and has negative free cash flow (-0.83/share in 2025). Its focus is on reinvestment amid losses, with no buybacks reported. Historically, Corning’s balanced dividend and buyback approach provide a more reliable total return profile. I conclude GLW offers the superior shareholder reward for investors in 2026.
Comparative Score Analysis: The Strategic Profile
The radar chart reveals the fundamental DNA and trade-offs of Corning Incorporated and Sandisk Corporation’s financial profiles:
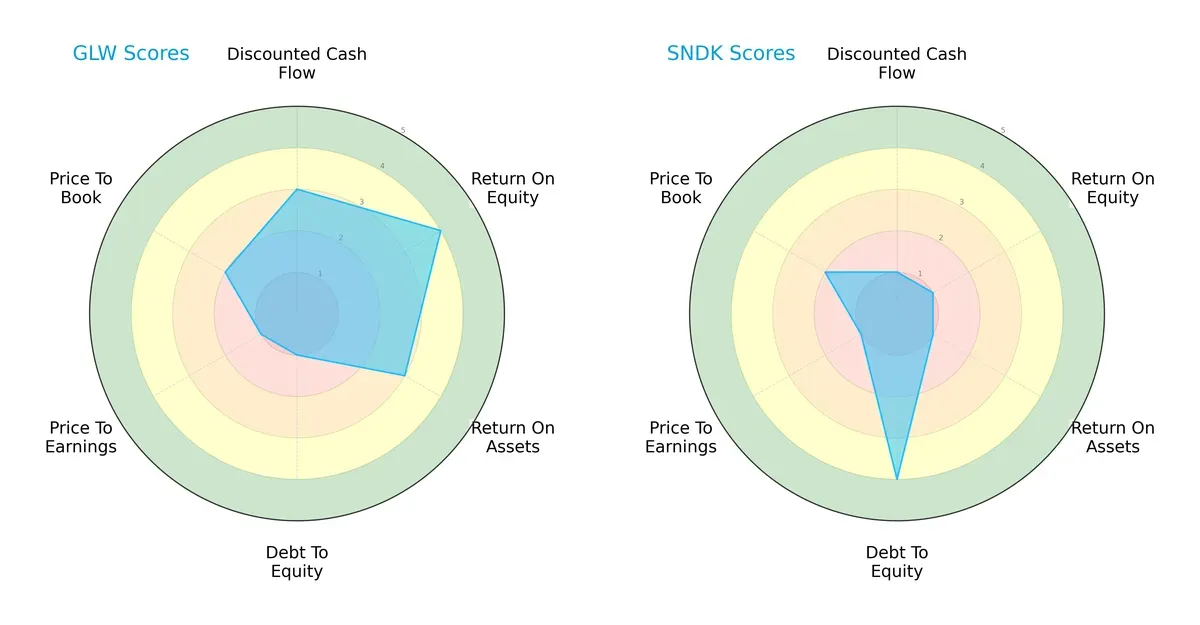
Corning excels in profitability with higher ROE (4) and ROA (3) scores, indicating efficient capital use. Sandisk leads in balance sheet strength with a superior debt-to-equity score (4) but lags significantly in cash flow and returns. Corning’s profile is more balanced, while Sandisk relies heavily on low leverage as its main advantage.
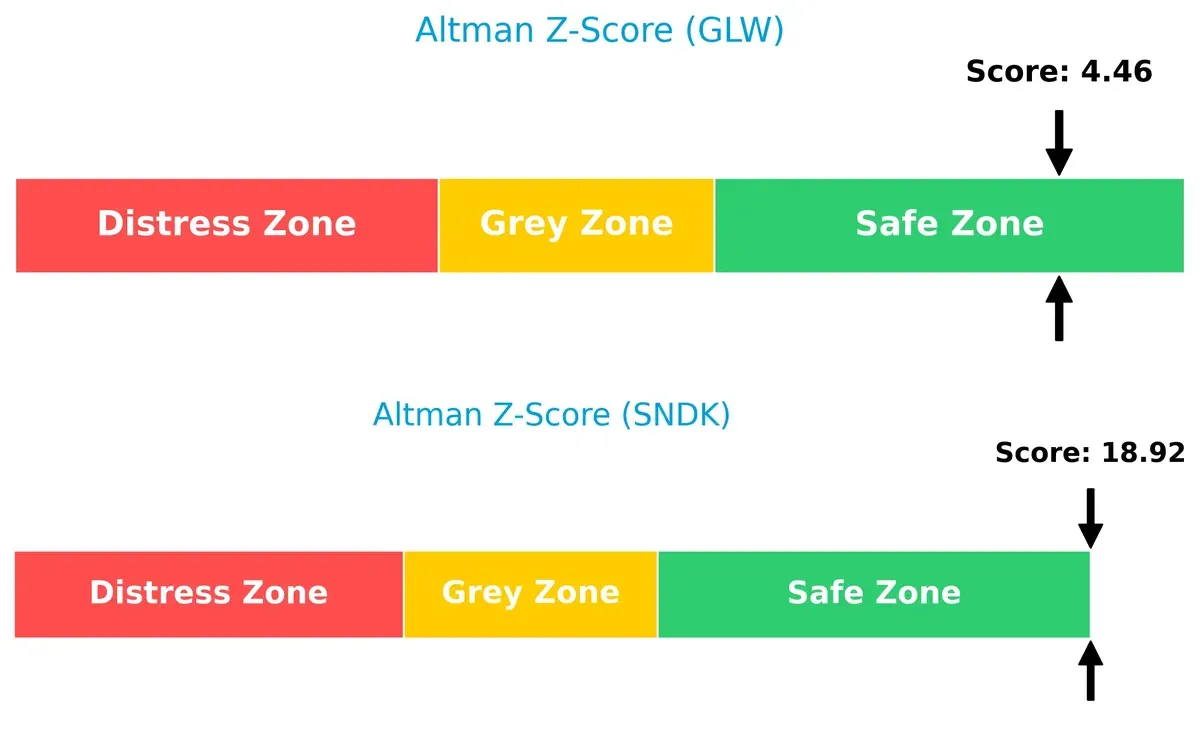
Bankruptcy Risk: Solvency Showdown
Sandisk’s Altman Z-Score (18.9) far exceeds Corning’s (4.46), signaling a much stronger buffer against bankruptcy risk in this market cycle:
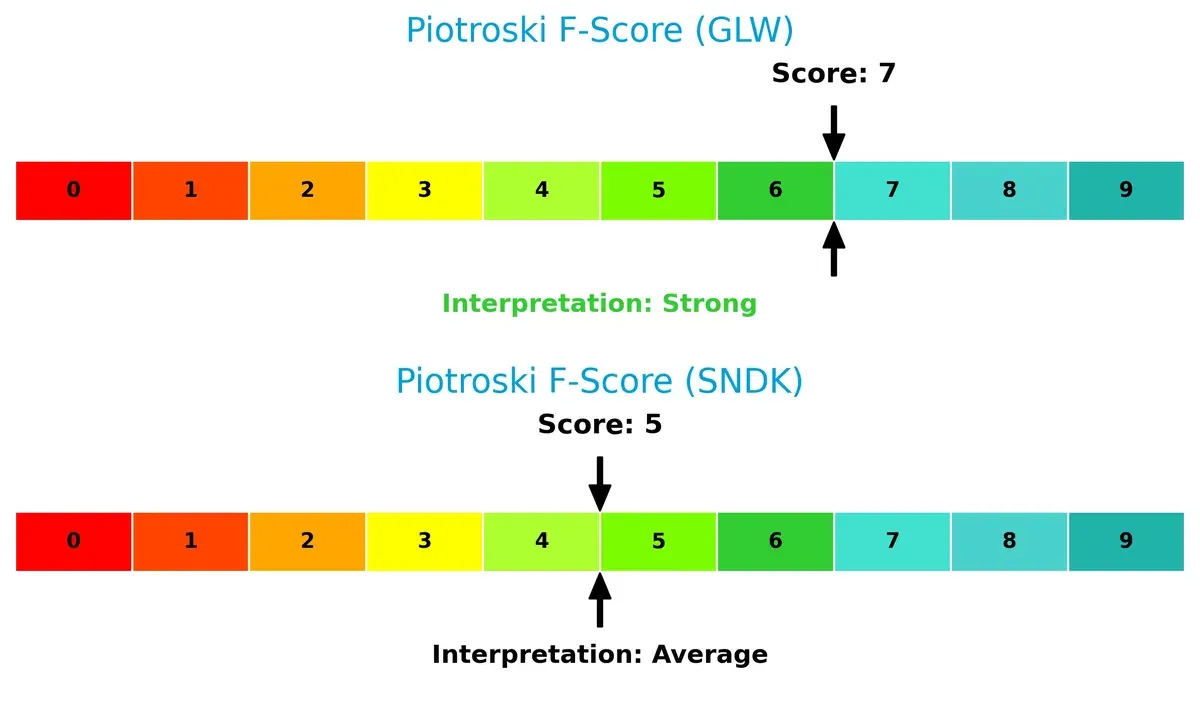
Financial Health: Quality of Operations
Corning’s Piotroski F-Score (7) suggests stronger operational health compared to Sandisk’s moderate score (5), highlighting fewer internal financial red flags:
How are the two companies positioned?
This section dissects the operational DNA of Corning and Sandisk by comparing their revenue distribution and internal dynamics. The goal is to confront their economic moats to identify which model offers the most resilient competitive advantage today.
Revenue Segmentation: The Strategic Mix
This visual comparison dissects how Corning Incorporated and Sandisk Corporation diversify their income streams and where their primary sector bets lie:
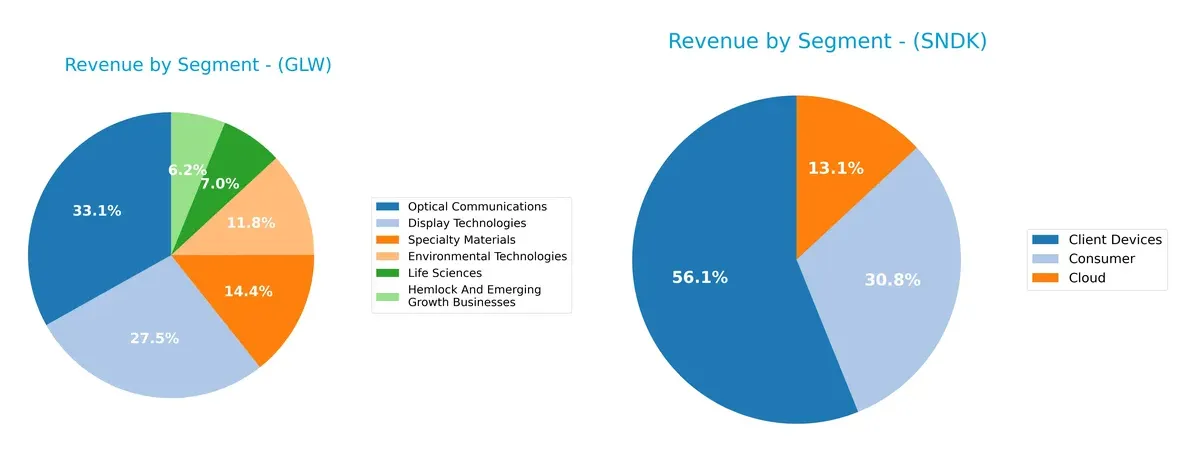
Corning anchors its revenue in Optical Communications ($4.66B) and Display Technologies ($3.87B), supported by Specialty Materials ($2.02B) and Environmental Technologies ($1.67B). This mix signals a broad industrial ecosystem with infrastructure dominance. Sandisk, however, pivots heavily on Client Devices ($4.13B), with Consumer ($2.27B) and Cloud ($960M) trailing, indicating concentration risk but strong exposure to digital storage markets. Corning’s diversification cushions volatility; Sandisk bets on sector growth.
Strengths and Weaknesses Comparison
This table compares the Strengths and Weaknesses of Corning Incorporated and Sandisk Corporation:
Corning Incorporated Strengths
- Diversified revenue across multiple technology segments
- Favorable net margin at 10.21%
- Strong global presence with major Asia Pacific and North America sales
- Solid liquidity ratios with current ratio 1.59 and quick ratio 1.04
- Moderate debt-to-assets at 27.23% supports financial stability
Sandisk Corporation Strengths
- Favorable price-to-earnings and price-to-book ratios indicate undervaluation
- Favorable debt-to-equity at 0.22 and debt-to-assets at 15.73% suggest low leverage
- High fixed asset turnover at 11.88 demonstrates operational efficiency
- Diverse geographic exposure including China, EMEA, and US markets
- Quick ratio of 2.11 supports short-term liquidity
Corning Incorporated Weaknesses
- High price-to-earnings (47.18) and price-to-book (6.38) ratios suggest overvaluation risk
- Return on invested capital (7.4%) slightly below weighted average cost of capital (8.56%)
- Neutral return on equity at 13.52% limits profitability appeal
- Asset turnover at 0.5 is modest relative to peers
- Dividend yield low at 1.33%, limiting income for investors
Sandisk Corporation Weaknesses
- Negative net margin (-22.31%), return on equity (-17.81%), and return on invested capital (-11.89%) indicate poor profitability
- Very high weighted average cost of capital (26.32%) raises capital expense concerns
- Negative interest coverage (-22.48) signals financial distress risk
- Current ratio high at 3.56 but flagged unfavorable, possibly due to asset quality
- No dividend yield reduces shareholder income
Both companies show distinct profiles: Corning leverages diversified global markets and stable profitability but faces valuation and capital efficiency questions. Sandisk’s strong asset utilization and low leverage contrast with significant profitability and financial health challenges, impacting its risk profile and strategic focus.
The Moat Duel: Analyzing Competitive Defensibility
A structural moat is the only barrier protecting long-term profits from relentless competition eroding margins and market share:
Corning Incorporated: Intangible Assets and Diversified Innovation
Corning’s moat stems from its proprietary glass technologies and diversified product lines. Its stable margins and improving profitability reflect strong R&D execution. Expansion in specialty materials and life sciences could deepen this moat in 2026.
Sandisk Corporation: Cost Advantage in NAND Storage
Sandisk relies on cost leadership in NAND flash memory, differentiating from Corning’s intangible asset moat. However, declining ROIC and negative margins signal weakening competitive positioning. Potential market disruption looms without a clear growth catalyst.
Innovation Depth vs. Cost Pressure: The Moat Showdown
Corning’s intangible asset moat is wider and more durable, evidenced by rising ROIC trends despite current value erosion. Sandisk’s shrinking ROIC and profitability reveal a vulnerable moat. Corning stands better poised to defend and grow its market share in 2026.
Which stock offers better returns?
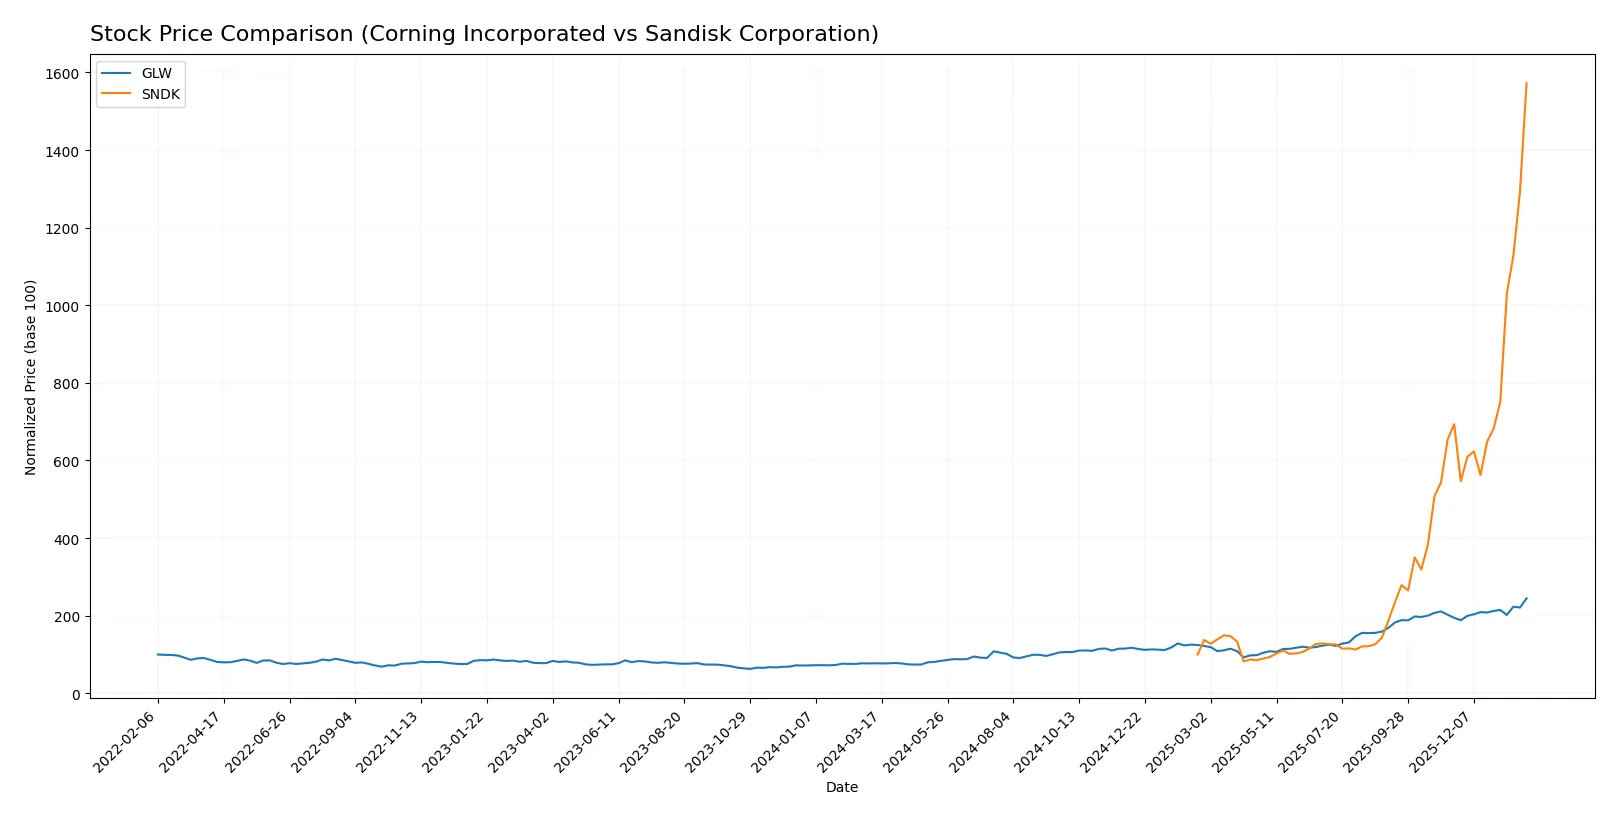
The past year reveals sharp price surges and notable acceleration for both stocks, with distinct magnitudes and trading volume dynamics shaping their trajectories.
Trend Comparison
Corning Incorporated’s stock rose 215.65% over 12 months, displaying a bullish trend with accelerating momentum and a standard deviation of 18.43. The price ranged from 31.27 to 103.25.
Sandisk Corporation’s stock surged 1472.31% in the same period, also bullish with acceleration but far higher volatility (std dev 125.16). Its price moved between 30.11 and 576.25.
Sandisk’s trend outperformed Corning’s substantially, delivering the highest market return with stronger buyer dominance and volume acceleration.
Target Prices
Analysts present a clear consensus on target prices for Corning Incorporated and Sandisk Corporation.
| Company | Target Low | Target High | Consensus |
|---|---|---|---|
| Corning Incorporated | 100 | 130 | 116.63 |
| Sandisk Corporation | 220 | 1000 | 614.62 |
The consensus target for Corning sits about 13% above its current price of 103.25, indicating moderate upside potential. Sandisk’s target consensus exceeds its current 576.25 price by roughly 7%, reflecting cautious optimism amid volatile trading.

Don’t Let Luck Decide Your Entry Point
Optimize your entry points with our advanced ProRealTime indicators. You’ll get efficient buy signals with precise price targets for maximum performance. Start outperforming now!
How do institutions grade them?
The institutional grades for Corning Incorporated and Sandisk Corporation are summarized below:
Corning Incorporated Grades
The following table presents the latest institutional grades for Corning Incorporated:
| Grading Company | Action | New Grade | Date |
|---|---|---|---|
| Morgan Stanley | maintain | Equal Weight | 2026-01-29 |
| Mizuho | maintain | Outperform | 2026-01-29 |
| Citigroup | maintain | Buy | 2026-01-29 |
| Susquehanna | maintain | Positive | 2026-01-29 |
| JP Morgan | maintain | Overweight | 2026-01-28 |
| Citigroup | maintain | Buy | 2026-01-12 |
| Morgan Stanley | maintain | Equal Weight | 2025-12-17 |
| UBS | maintain | Buy | 2025-11-21 |
| Citigroup | maintain | Buy | 2025-10-29 |
| JP Morgan | maintain | Overweight | 2025-10-29 |
Sandisk Corporation Grades
The following table presents the latest institutional grades for Sandisk Corporation:
| Grading Company | Action | New Grade | Date |
|---|---|---|---|
| Jefferies | maintain | Buy | 2026-01-30 |
| RBC Capital | maintain | Sector Perform | 2026-01-30 |
| Goldman Sachs | maintain | Buy | 2026-01-30 |
| Morgan Stanley | maintain | Overweight | 2026-01-30 |
| Cantor Fitzgerald | maintain | Overweight | 2026-01-30 |
| Wedbush | maintain | Outperform | 2026-01-30 |
| Citigroup | maintain | Buy | 2026-01-20 |
| Wells Fargo | maintain | Equal Weight | 2026-01-15 |
| Benchmark | maintain | Buy | 2026-01-15 |
| Bernstein | maintain | Outperform | 2026-01-14 |
Which company has the best grades?
Sandisk Corporation consistently receives higher grades like Buy, Overweight, and Outperform from multiple firms, signaling stronger institutional confidence. Corning Incorporated holds a mix of Buy and Equal Weight ratings, indicating a more cautious outlook. This difference could influence investor sentiment and portfolio positioning.
Risks specific to each company
The following categories identify the critical pressure points and systemic threats facing both firms in the 2026 market environment:
1. Market & Competition
Corning Incorporated
- Faces intense rivalry in diversified tech segments; moderate ROIC close to WACC signals stable but competitive positioning.
Sandisk Corporation
- Struggles with negative profitability and high beta; flash storage market volatility intensifies competitive pressure.
2. Capital Structure & Debt
Corning Incorporated
- Debt-to-assets at 27% is manageable; interest coverage ratio of 7.11 signals solid ability to service debt.
Sandisk Corporation
- Low debt-to-assets (16%) and low debt/equity ratio indicate conservative leverage; negative interest coverage is a red flag.
3. Stock Volatility
Corning Incorporated
- Beta of 1.13 suggests moderate stock volatility, slightly above market average.
Sandisk Corporation
- Extremely high beta near 4.9 highlights high volatility and elevated market risk.
4. Regulatory & Legal
Corning Incorporated
- Operating globally with environmental and tech regulations; moderate risk given diversified product lines.
Sandisk Corporation
- Primarily focused on NAND flash tech, facing stricter data security and environmental compliance risks.
5. Supply Chain & Operations
Corning Incorporated
- Complex global supply chains in multiple segments; experience mitigates disruption risks.
Sandisk Corporation
- More concentrated supply chain in flash memory; higher exposure to component shortages and tech shifts.
6. ESG & Climate Transition
Corning Incorporated
- Actively engaged in environmental technologies; aligns well with climate transition trends.
Sandisk Corporation
- ESG efforts less visible; negative margins may limit investments in sustainable initiatives.
7. Geopolitical Exposure
Corning Incorporated
- US-based with global operations; geopolitical tensions in Asia could impact supply chains and sales.
Sandisk Corporation
- Also US-based with significant exposure to Asia-Pacific markets; geopolitical risks may disrupt production and market access.
Which company shows a better risk-adjusted profile?
Corning’s strongest risk is market competition balanced by solid capital structure and moderate volatility. Sandisk’s greatest risk is extreme stock volatility compounded by weak financial ratios and negative profitability. Corning’s safer debt profile, stronger interest coverage, and stable Altman Z-Score (4.46, safe zone) indicate a better risk-adjusted stance. Sandisk’s high beta (4.89) and negative interest coverage flag elevated financial distress, despite a strong Altman Z-Score. Recent data reveal Sandisk’s worsening profitability and liquidity, heightening concern.
Final Verdict: Which stock to choose?
Corning Incorporated’s superpower lies in its improving profitability and operational efficiency. I see a company steadily climbing out of value destruction with a bullish price trend and solid income growth. Its point of vigilance is a rich valuation that could pressure future returns. It suits investors seeking aggressive growth with some tolerance for premium pricing.
Sandisk Corporation offers a strategic moat rooted in its deep recurring revenue streams and an exceptionally strong balance sheet. Despite recent profitability challenges and a declining moat, its lower valuation and safer financial footing provide a cushion compared to Corning. I consider it a fit for portfolios focused on growth at a reasonable price (GARP) with a higher risk appetite.
If you prioritize near-term growth and improving profitability, Corning outshines Sandisk with its upward ROIC trend and market momentum. However, if you seek better stability and a more conservative balance sheet, Sandisk offers a compelling scenario despite its current operational headwinds. Both require careful risk management given their distinct financial profiles.
Disclaimer: Investment carries a risk of loss of initial capital. The past performance is not a reliable indicator of future results. Be sure to understand risks before making an investment decision.
Go Further
I encourage you to read the complete analyses of Corning Incorporated and Sandisk Corporation to enhance your investment decisions: