Home > Comparison > Technology > GLW vs OUST
The strategic rivalry between Corning Incorporated and Ouster, Inc. defines the evolving landscape of the technology sector’s hardware and equipment industry. Corning operates as a capital-intensive industrial giant, with diversified segments spanning display technologies and specialty materials. Ouster, by contrast, is a nimble innovator focused on high-resolution digital lidar sensors. This analysis will assess which corporate trajectory offers a superior risk-adjusted outlook for a diversified portfolio.
Table of contents
Companies Overview
Corning Incorporated and Ouster, Inc. stand as pivotal players in the hardware and equipment sector with distinct market approaches.
Corning Incorporated: Glass and Optical Tech Leader
Corning commands the display technologies and optical communications markets, generating revenue through glass substrates for LCDs and OLEDs, optical fibers, and specialty materials. In 2026, it strategically focuses on expanding its environmental technologies and life sciences segments, leveraging decades of innovation to maintain its competitive edge in diverse high-tech industries.
Ouster, Inc.: Digital Lidar Innovator
Ouster specializes in high-resolution digital lidar sensors and software that enable 3D vision for vehicles and robotics. Its revenue stems from advanced scanning and solid-state flash sensors. In 2026, Ouster concentrates on scaling production and penetrating autonomous machinery markets, aiming to disrupt traditional sensing technologies with its cutting-edge, software-driven hardware.
Strategic Collision: Similarities & Divergences
Both companies operate in hardware and technology, yet Corning pursues a diversified portfolio across mature and emerging segments, while Ouster champions a niche, high-growth lidar market. Their competitive battleground lies in optical and sensing technologies, with Corning’s broad ecosystem clashing against Ouster’s focused innovation. This divergence defines their investment profiles: stable, multi-industry resilience versus high-beta, disruptive potential.
Income Statement Comparison
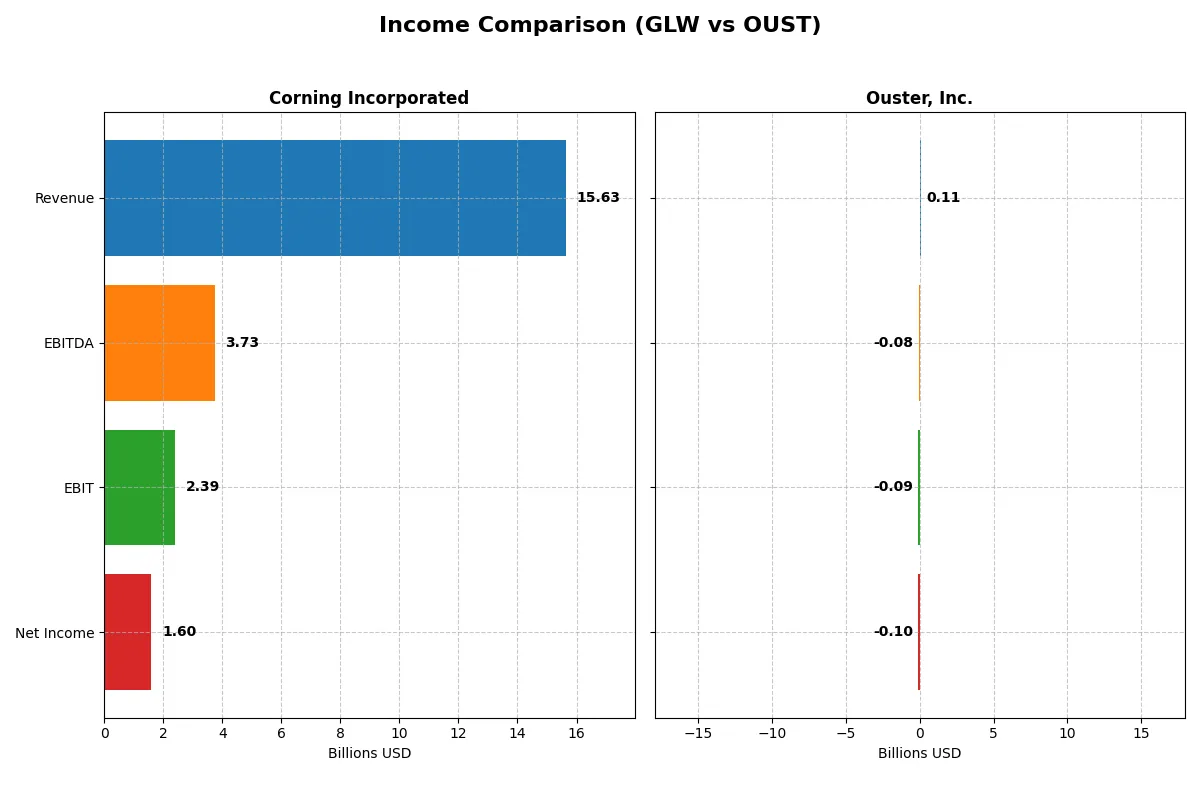
This data dissects the core profitability and scalability of both corporate engines to reveal who dominates the bottom line:
| Metric | Corning Incorporated (GLW) | Ouster, Inc. (OUST) |
|---|---|---|
| Revenue | 15.6B | 111.1M |
| Cost of Revenue | 10.1B | 70.6M |
| Operating Expenses | 3.18B | 144.6M |
| Gross Profit | 5.51B | 40.5M |
| EBITDA | 3.74B | -79.9M |
| EBIT | 2.39B | -94.7M |
| Interest Expense | 336M | 1.82M |
| Net Income | 1.60B | -97.0M |
| EPS | 1.86 | -2.08 |
| Fiscal Year | 2025 | 2024 |
Income Statement Analysis: The Bottom-Line Duel
This income statement comparison reveals the true efficiency and profitability of each company’s corporate engine over recent years.
Corning Incorporated Analysis
Corning’s revenue climbed steadily from $14.1B in 2021 to $15.6B in 2025, with net income showing volatile but strong growth, especially a surge to $1.6B in 2025. Gross margin remains solid around 35%, while net margin improved significantly to 10.2% in 2025, reflecting enhanced operational efficiency and effective cost control.
Ouster, Inc. Analysis
Ouster’s revenue expanded rapidly from $34M in 2021 to $111M in 2024, while net losses narrowed from -$94M in 2021 to -$97M in 2024, showing improved but still negative profitability. Gross margin held favorably at 36.4%, yet EBIT and net margins stayed deeply negative, indicating ongoing investment and scaling challenges.
Verdict: Profit Stability vs. Growth Trajectory
Corning dominates with stable profitability and expanding margins, driven by efficient cost management and strong revenue growth. Ouster impresses with explosive top-line expansion and improving margins but remains unprofitable. For investors prioritizing reliable earnings and margin health, Corning’s profile is more attractive than Ouster’s growth-at-a-losses model.
Financial Ratios Comparison
These vital ratios act as a diagnostic tool to expose the underlying fiscal health, valuation premiums, and capital efficiency of the companies compared below:
| Ratios | Corning Incorporated (GLW) | Ouster, Inc. (OUST) |
|---|---|---|
| ROE | 13.5% | -53.6% |
| ROIC | 7.4% | -50.8% |
| P/E | 47.2 | -5.87 |
| P/B | 6.38 | 3.15 |
| Current Ratio | 1.59 | 2.80 |
| Quick Ratio | 1.04 | 2.59 |
| D/E | 0.71 | 0.11 |
| Debt-to-Assets | 27.2% | 7.33% |
| Interest Coverage | 6.78 | -57.1 |
| Asset Turnover | 0.50 | 0.40 |
| Fixed Asset Turnover | 1.05 | 4.54 |
| Payout Ratio | 62.6% | 0% |
| Dividend Yield | 1.33% | 0% |
| Fiscal Year | 2025 | 2024 |
Efficiency & Valuation Duel: The Vital Signs
Ratios act as a company’s DNA, unveiling hidden risks and operational excellence beyond surface-level financials.
Corning Incorporated
Corning shows solid profitability with a 13.5% ROE and a favorable 10.2% net margin, indicating efficient core operations. However, its valuation is stretched, with a high P/E of 47.2 and P/B of 6.4. The company offers a modest 1.3% dividend yield, balancing shareholder returns with steady reinvestment in R&D at 7.1% of revenue.
Ouster, Inc.
Ouster suffers from steep losses, reflected in a negative 53.6% ROE and an unfavorable net margin of -87.4%. Despite a low P/E ratio, this results from negative earnings and does not imply value. The balance sheet looks safe with a strong current ratio of 2.8 and low debt. The firm reinvests heavily in growth, allocating over 50% of revenue to R&D.
Premium Valuation vs. Growth Risk
Corning offers operational stability and modest shareholder returns but trades expensive relative to earnings. Ouster carries significant profitability risks but prioritizes growth and maintains a strong liquidity profile. Investors seeking safety and steady income may prefer Corning, while growth-focused investors must weigh Ouster’s high uncertainty.
Which one offers the Superior Shareholder Reward?
I compare Corning Incorporated (GLW) and Ouster, Inc. (OUST) on dividends, buybacks, and sustainability of returns. GLW pays a 1.33% dividend yield with a 62.6% payout ratio, backed by stable free cash flow of 1.64/share in 2025. It also executes moderate buybacks, enhancing total return. OUST pays no dividends and incurs losses with negative free cash flow, focusing on growth investments. Its buyback activity is negligible, reflecting early-stage capital allocation. Historically, GLW’s balanced distribution and cash flow coverage make it a more sustainable, attractive choice for 2026 total returns. I favor GLW for superior shareholder reward in this cycle.
Comparative Score Analysis: The Strategic Profile
The radar chart reveals the fundamental DNA and trade-offs of both firms, highlighting their distinct financial strengths and vulnerabilities:
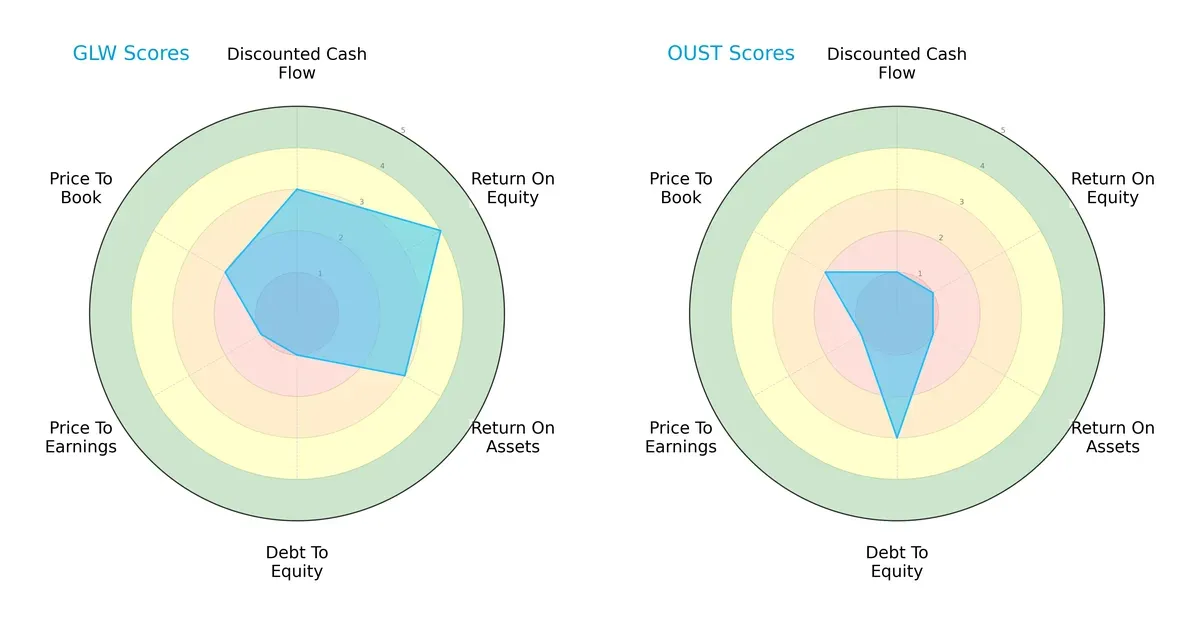
Corning Incorporated (GLW) presents a more balanced profile with moderate to favorable scores in DCF (3), ROE (4), and ROA (3). However, it suffers from very unfavorable debt-to-equity (1) and P/E (1) scores, indicating financial leverage concerns and possible overvaluation risks. Ouster, Inc. (OUST) shows weaker operational metrics with uniformly unfavorable DCF (1), ROE (1), and ROA (1) scores but maintains a better debt-to-equity score (3), suggesting more prudent leverage management. GLW’s edge lies in operational efficiency, while OUST relies on conservative capital structure.
Bankruptcy Risk: Solvency Showdown
The Altman Z-Scores place both companies firmly in the safe zone, signaling strong solvency and low bankruptcy risk in this market cycle:
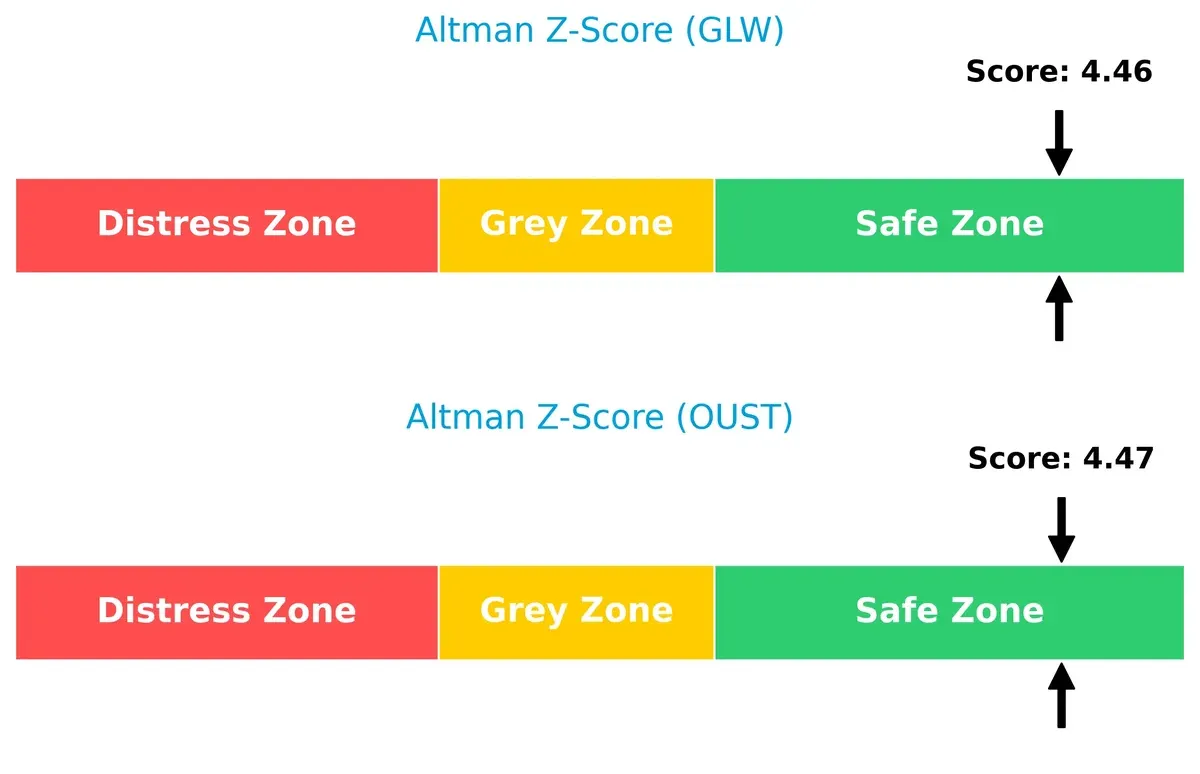
Corning scores 4.46, and Ouster scores 4.47, both well above the distress threshold of 1.8. This confirms their resilience amid economic fluctuations, though GLW’s operational metrics provide a more robust buffer.
Financial Health: Quality of Operations
Corning’s Piotroski F-Score of 7 indicates strong financial health and solid internal fundamentals, while Ouster’s score of 4 flags moderate concerns about its operational quality and efficiency:
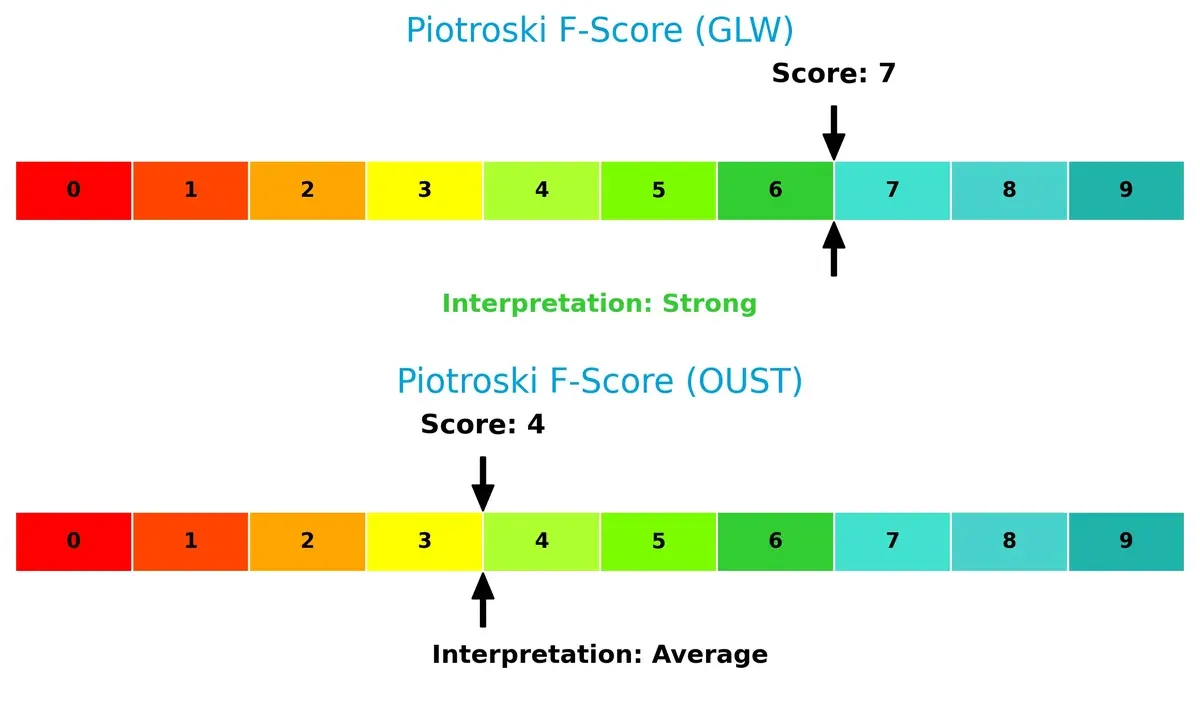
GLW’s higher score reflects consistent profitability, liquidity, and leverage management, whereas OUST’s average score warns investors to scrutinize its internal metrics carefully before committing capital.
How are the two companies positioned?
This section dissects the operational DNA of Corning and Ouster by comparing their revenue distribution by segment and internal dynamics. The final goal is to confront their economic moats to identify which model offers the most resilient, sustainable competitive advantage today.
Revenue Segmentation: The Strategic Mix
The following visual comparison dissects how Corning Incorporated and Ouster, Inc. diversify their income streams and where their primary sector bets lie:
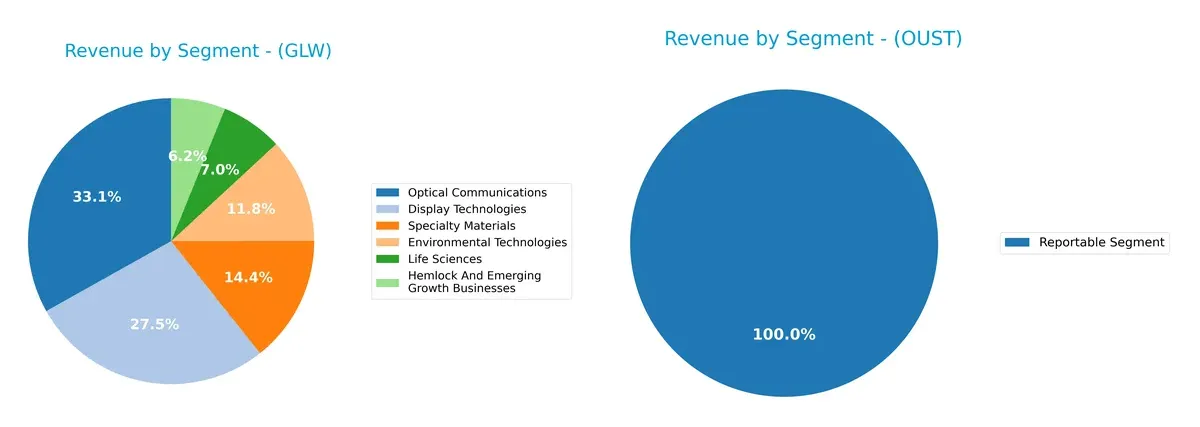
Corning dominates with a broad portfolio, led by Optical Communications at $4.66B and Display Technologies at $3.87B. Specialty Materials and Environmental Technologies contribute $2.02B and $1.67B respectively, signaling strong diversification. Ouster relies heavily on a single segment, reporting $111M solely from its Reportable Segment, exposing it to concentration risk. Corning’s varied mix suggests ecosystem lock-in and infrastructure dominance, while Ouster’s narrow base warrants cautious risk management.
Strengths and Weaknesses Comparison
This table compares the Strengths and Weaknesses of Corning Incorporated and Ouster, Inc.:
Corning Incorporated Strengths
- Diversified revenue across six product segments
- Solid global presence with strong Asia Pacific and North America sales
- Favorable net margin and liquidity ratios
- Moderate debt levels with good interest coverage
Ouster, Inc. Strengths
- High current and quick ratios indicating strong short-term liquidity
- Low debt-to-equity and debt-to-assets ratios reduce financial risk
- Favorable fixed asset turnover shows efficient use of fixed assets
- Positive PE ratio despite challenges
Corning Incorporated Weaknesses
- Unfavorable valuation metrics with high P/E and P/B ratios
- Neutral returns on equity and invested capital
- Asset turnover ratios only neutral, suggesting room for operational efficiency improvement
Ouster, Inc. Weaknesses
- Highly negative profitability metrics including net margin, ROE, and ROIC
- Unfavorable WACC and interest coverage ratios indicate high cost of capital and financial stress
- Negative dividend yield and unfavorable asset turnover ratios
Corning’s strengths lie in its diversified product portfolio and stable global footprint, supported by favorable profitability and liquidity. Ouster shows liquidity strength and asset efficiency but faces significant profitability and cost challenges. Both companies must address their valuation and operational efficiency aspects to enhance competitive positioning.
The Moat Duel: Analyzing Competitive Defensibility
A structural moat is the sole barrier protecting long-term profits from relentless competition erosion. Let’s dissect two firms’ moats in 2026:
Corning Incorporated: Intangible Assets & Scale Economies
Corning’s moat hinges on decades of proprietary glass technologies and scale in optical solutions. Its stable margins and rising ROIC reflect efficient capital use. New markets in life sciences could further deepen this advantage.
Ouster, Inc.: Innovation-Driven Network Effects
Ouster’s moat derives from cutting-edge lidar tech and software integration, distinct from Corning’s legacy assets. Despite current losses, rapid revenue and margin improvements signal strengthening positioning. Expansion into autonomous vehicles could disrupt markets ahead.
Legacy Scale vs. High-Tech Innovation
Corning’s deeper moat rests on its intangible assets and global scale, providing margin stability. Ouster shows a promising but narrower moat, fueled by innovation and growth potential. Corning remains better equipped to defend its established market share in 2026.
Which stock offers better returns?
Over the past 12 months, both stocks show significant price appreciation but with contrasting recent momentum and differing volatility profiles.
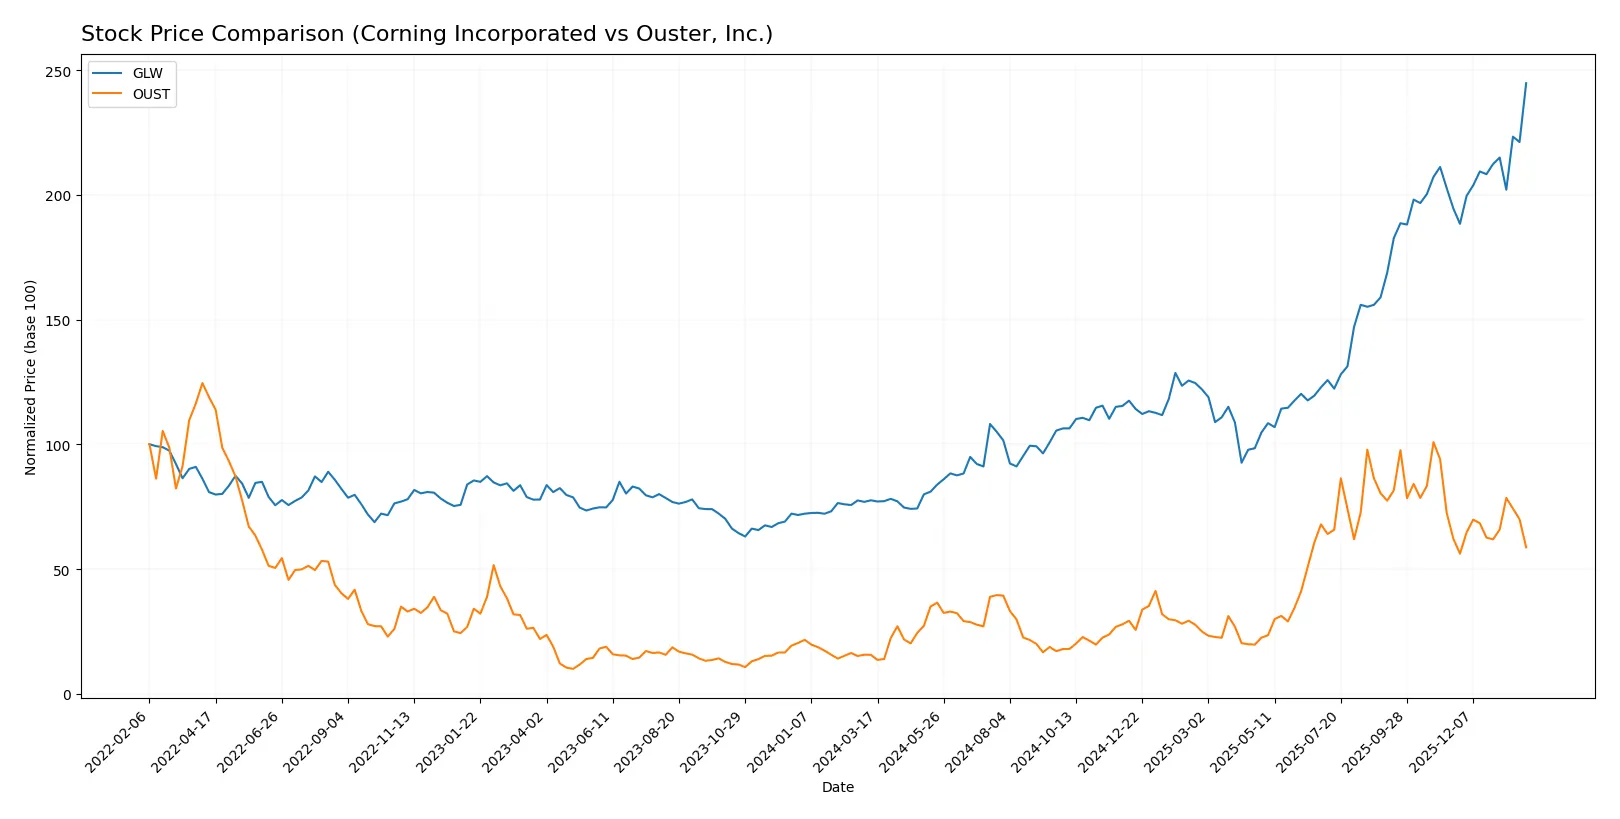
Trend Comparison
Corning Incorporated (GLW) exhibits a strong bullish trend with a 215.65% price gain over the past year, accelerating and reaching a high of 103.25. Its volatility is elevated, with an 18.43 standard deviation.
Ouster, Inc. (OUST) shows an even stronger bullish trend over 12 months, gaining 276.67% with acceleration and lower volatility at 8.57 standard deviation. However, recent months reflect a bearish 5.53% decline and seller dominance.
GLW’s recent positive momentum contrasts with OUST’s short-term weakness. Overall, OUST delivered the highest annual market performance despite recent deceleration.
Target Prices
Analysts provide a clear target range for Corning Incorporated and Ouster, Inc., signaling defined upside potential.
| Company | Target Low | Target High | Consensus |
|---|---|---|---|
| Corning Incorporated | 100 | 130 | 116.63 |
| Ouster, Inc. | 33 | 39 | 36.67 |
Corning’s consensus target exceeds its current price of 103.25 by about 13%, suggesting moderate upside. Ouster’s market price at 20.83 is well below consensus, implying significant growth expectations amid heightened risk.

Don’t Let Luck Decide Your Entry Point
Optimize your entry points with our advanced ProRealTime indicators. You’ll get efficient buy signals with precise price targets for maximum performance. Start outperforming now!
How do institutions grade them?
Corning Incorporated Grades
The following table summarizes recent institutional grades for Corning Incorporated:
| Grading Company | Action | New Grade | Date |
|---|---|---|---|
| Morgan Stanley | Maintain | Equal Weight | 2026-01-29 |
| Mizuho | Maintain | Outperform | 2026-01-29 |
| Citigroup | Maintain | Buy | 2026-01-29 |
| Susquehanna | Maintain | Positive | 2026-01-29 |
| JP Morgan | Maintain | Overweight | 2026-01-28 |
| Citigroup | Maintain | Buy | 2026-01-12 |
| Morgan Stanley | Maintain | Equal Weight | 2025-12-17 |
| UBS | Maintain | Buy | 2025-11-21 |
| Citigroup | Maintain | Buy | 2025-10-29 |
| JP Morgan | Maintain | Overweight | 2025-10-29 |
Ouster, Inc. Grades
The following table summarizes recent institutional grades for Ouster, Inc.:
| Grading Company | Action | New Grade | Date |
|---|---|---|---|
| Cantor Fitzgerald | Upgrade | Overweight | 2025-11-07 |
| Cantor Fitzgerald | Upgrade | Overweight | 2025-11-06 |
| Rosenblatt | Maintain | Buy | 2025-11-05 |
| WestPark Capital | Maintain | Buy | 2025-11-05 |
| WestPark Capital | Upgrade | Buy | 2025-08-13 |
| Oppenheimer | Maintain | Outperform | 2025-07-16 |
| WestPark Capital | Downgrade | Hold | 2025-06-12 |
| WestPark Capital | Upgrade | Buy | 2025-05-09 |
| Cantor Fitzgerald | Maintain | Overweight | 2025-03-21 |
| WestPark Capital | Maintain | Hold | 2025-03-21 |
Which company has the best grades?
Corning has a consistent pattern of Buy, Outperform, and Overweight ratings from top-tier firms, indicating stronger institutional confidence. Ouster’s grades are positive but show more variability, including downgrades. Investors may interpret Corning’s steadier grades as a sign of relative stability in analyst sentiment.
Risks specific to each company
The following categories identify the critical pressure points and systemic threats facing both firms in the 2026 market environment:
1. Market & Competition
Corning Incorporated
- Established leader with diverse product lines but faces intense competition in display and optical segments.
Ouster, Inc.
- Emerging player in lidar sensors, struggling for market share against larger rivals and rapid tech shifts.
2. Capital Structure & Debt
Corning Incorporated
- Moderate debt-to-equity ratio at 0.71, manageable interest coverage of 7.11, signaling balanced leverage.
Ouster, Inc.
- Very low debt (D/E 0.11) but negative interest coverage reflects operational losses and financial strain.
3. Stock Volatility
Corning Incorporated
- Beta of 1.125 indicates moderate volatility in line with market averages, stable trading range.
Ouster, Inc.
- High beta of 2.935 shows extreme price swings, reflecting speculative investor sentiment and risk.
4. Regulatory & Legal
Corning Incorporated
- Exposure to environmental regulations on emissions products but with established compliance frameworks.
Ouster, Inc.
- Emerging regulatory risks in lidar technology standards and potential intellectual property disputes.
5. Supply Chain & Operations
Corning Incorporated
- Large, diversified supply chain with some exposure to semiconductor cycles but resilient operations.
Ouster, Inc.
- Smaller scale supply chain vulnerable to disruptions and supplier dependency in cutting-edge components.
6. ESG & Climate Transition
Corning Incorporated
- Invests in environmental technologies and sustainability initiatives, aligning with climate transition goals.
Ouster, Inc.
- ESG policies less mature, facing pressure to improve governance and environmental impact disclosures.
7. Geopolitical Exposure
Corning Incorporated
- Global footprint with some exposure to trade tensions but diversified across regions.
Ouster, Inc.
- Concentrated US operations limit geopolitical risks but also limit global growth opportunities.
Which company shows a better risk-adjusted profile?
Corning’s most impactful risk lies in market competition amid a high valuation, risking margin pressure. Ouster faces severe financial distress from negative profitability and volatile stock behavior. Corning’s balanced leverage and diversified operations deliver a stronger risk-adjusted profile. Ouster’s high beta and negative interest coverage highlight significant financial and market risks.
Final Verdict: Which stock to choose?
Corning Incorporated’s superpower lies in its resilient cash flow generation and improving profitability amid a challenging capital allocation environment. Its slight value destruction signals a point of vigilance, but steady operational momentum and strong income metrics suit it well for an Aggressive Growth portfolio seeking solid fundamentals with upside potential.
Ouster, Inc. boasts a strategic moat in its expanding technology footprint and rapid revenue growth, underpinned by a clean balance sheet and ample liquidity. While it carries considerable profitability risk compared to Corning, its innovation-driven model fits a GARP (Growth at a Reasonable Price) portfolio focused on capturing turnaround and technology adoption.
If you prioritize stable cash generation and improving returns on capital, Corning outshines with a more favorable financial profile and safer credit metrics. However, if you seek high-growth potential coupled with a willingness to tolerate earnings volatility, Ouster offers better upside as an innovation play with accelerating top-line momentum. Both require careful risk management aligned with your investment horizon and risk tolerance.
Disclaimer: Investment carries a risk of loss of initial capital. The past performance is not a reliable indicator of future results. Be sure to understand risks before making an investment decision.
Go Further
I encourage you to read the complete analyses of Corning Incorporated and Ouster, Inc. to enhance your investment decisions: