Home > Comparison > Technology > GLW vs NOVT
The strategic rivalry between Corning Incorporated and Novanta Inc. shapes the competitive landscape of the Technology sector’s hardware, equipment, and parts industry. Corning operates as a diversified industrial powerhouse with broad applications in display and optical technologies. Novanta focuses on niche photonics and precision motion components serving medical and industrial markets. This analysis evaluates which business model delivers superior risk-adjusted returns for a diversified portfolio amid evolving technological demands.
Table of contents
Companies Overview
Corning Incorporated and Novanta Inc. stand as prominent players in the specialized hardware and equipment sector, commanding significant market attention.
Corning Incorporated: Global Pioneer in Specialty Glass and Optical Technologies
Corning Incorporated dominates with its diverse product portfolio in display technologies, optical communications, specialty materials, and life sciences. Its core revenue comes from supplying glass substrates for LCDs, OLEDs, and optical fibers worldwide. In 2026, the company strategically focused on expanding its environmental technologies and life sciences segments to diversify growth beyond traditional display markets.
Novanta Inc.: Innovator in Photonics and Precision Motion Components
Novanta Inc. excels in designing and selling photonics, vision, and precision motion components primarily for medical and industrial markets. Its revenue engine revolves around laser scanning, medical visualization, and motion control solutions. The company’s 2026 strategy emphasized enhancing integrated subsystems and expanding its footprint in medical imaging and industrial laser applications.
Strategic Collision: Similarities & Divergences
Both companies target high-tech hardware niches but diverge in their approach: Corning leans on a broad product ecosystem spanning multiple industries, while Novanta pursues specialized, integrated subsystems in photonics and motion control. Their primary battleground lies in supplying cutting-edge components to medical and industrial OEMs. Corning’s scale contrasts with Novanta’s focused innovation, creating distinct investment profiles shaped by diversification versus specialization.
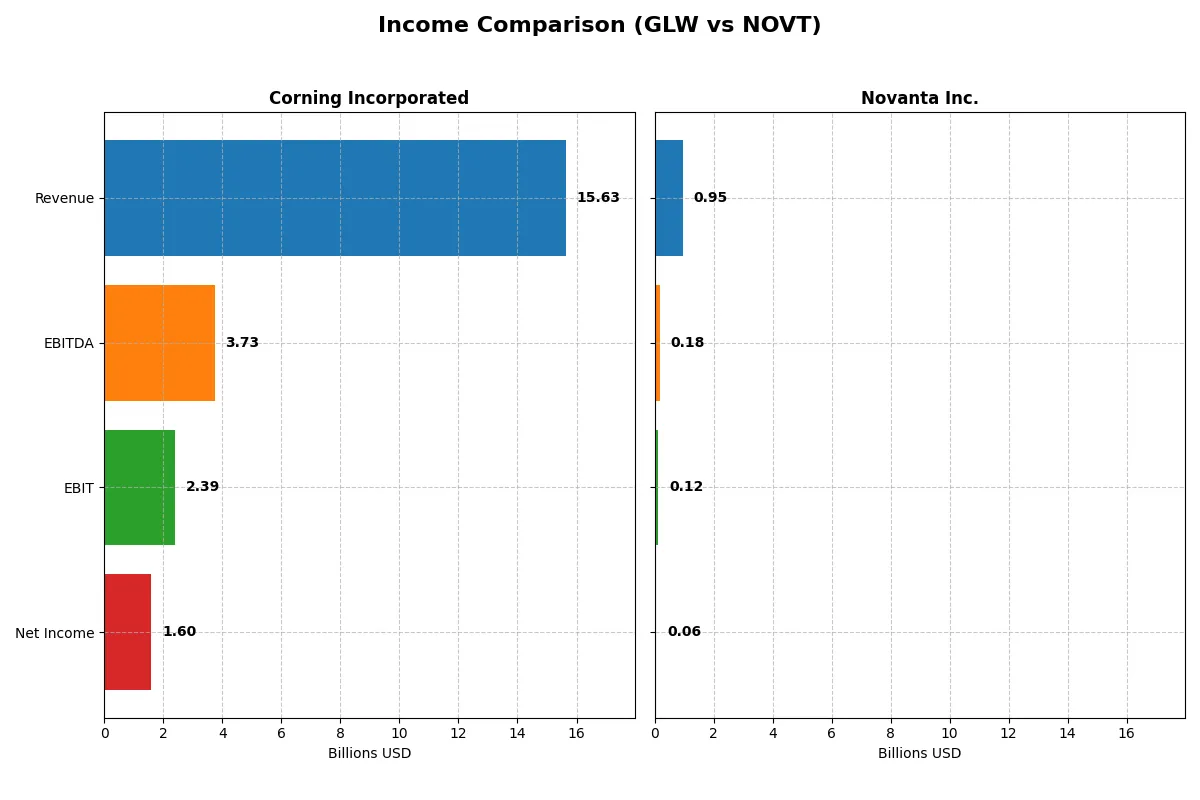
Income Statement Comparison
This data dissects the core profitability and scalability of both corporate engines to reveal who dominates the bottom line:
| Metric | Corning Inc. (GLW) | Novanta Inc. (NOVT) |
|---|---|---|
| Revenue | 15.6B | 949M |
| Cost of Revenue | 10.1B | 528M |
| Operating Expenses | 3.18B | 311M |
| Gross Profit | 5.51B | 422M |
| EBITDA | 3.74B | 180M |
| EBIT | 2.39B | 124M |
| Interest Expense | 336M | 31M |
| Net Income | 1.60B | 64M |
| EPS | 1.86 | 1.78 |
| Fiscal Year | 2025 | 2024 |
Income Statement Analysis: The Bottom-Line Duel
This income statement comparison exposes the true operational efficiency and profitability momentum of each company’s financial engine.
Corning Incorporated Analysis
Corning’s revenue surged 19% in 2025 to $15.6B, with net income tripling to $1.6B, signaling strong momentum. Gross margin stood at a healthy 35.3%, while net margin climbed to 10.2%. Operating expenses grew proportionally to revenue, reflecting disciplined cost management that supports sustainable margin expansion.
Novanta Inc. Analysis
Novanta posted moderate revenue growth of 7.7% to $949M in 2024, with net income declining 12% to $64M. Gross margin held firm at 44.4%, but net margin slipped to 6.8%, indicating pressure on bottom-line efficiency. Operating income growth was essentially flat, suggesting limited momentum despite solid top-line expansion.
Margin Strength vs. Growth Trajectory
Corning dominates with superior margin expansion and robust net income growth, outperforming Novanta’s steadier but slower gains. Corning’s ability to scale revenue while improving profitability marks it as the more fundamentally efficient operator. Investors seeking strong earnings momentum may find Corning’s profile more attractive.
Financial Ratios Comparison
These vital ratios act as a diagnostic tool to expose the underlying fiscal health, valuation premiums, and capital efficiency of each company:
| Ratios | Corning Incorporated (GLW) | Novanta Inc. (NOVT) |
|---|---|---|
| ROE | 13.52% | 8.59% |
| ROIC | 7.40% | 7.25% |
| P/E | 47.18 | 85.70 |
| P/B | 6.38 | 7.37 |
| Current Ratio | 1.59 | 2.58 |
| Quick Ratio | 1.04 | 1.72 |
| D/E | 0.71 | 0.63 |
| Debt-to-Assets | 27.23% | 33.92% |
| Interest Coverage | 6.78 | 3.51 |
| Asset Turnover | 0.50 | 0.68 |
| Fixed Asset Turnover | 1.05 | 6.08 |
| Payout ratio | 62.59% | 0.00% |
| Dividend yield | 1.33% | 0.00% |
| Fiscal Year | 2025 | 2024 |
Efficiency & Valuation Duel: The Vital Signs
Financial ratios act as a company’s DNA, exposing hidden risks and operational strengths that drive investment decisions.
Corning Incorporated
Corning posts a solid 13.5% ROE with a favorable 10.2% net margin, signaling decent profitability. However, its P/E of 47.2 and P/B of 6.4 mark the stock as expensive. The firm returns value through a 1.33% dividend yield, balancing shareholder rewards with ongoing R&D investment at 7.1% of revenue.
Novanta Inc.
Novanta shows weaker profitability with an 8.6% ROE and a 6.8% net margin, reflecting operational challenges. Its valuation is stretched, featuring an elevated P/E of 85.7 and P/B of 7.4. The company pays no dividend, instead reinvesting aggressively into R&D at over 10%, prioritizing growth over immediate returns.
Premium Valuation vs. Operational Safety
Corning offers a better blend of profitability and shareholder returns despite a high valuation. Novanta’s rich multiples and no dividend reflect a growth-focused but riskier profile. Investors favoring steady income and moderate risk may lean toward Corning, while growth seekers might consider Novanta’s reinvestment strategy.
Which one offers the Superior Shareholder Reward?
Corning (GLW) pays a modest dividend yield near 1.3%, with a payout ratio around 62.6%, indicating moderate FCF coverage and a balanced distribution approach. Its buyback program, while present, appears less aggressive compared to Novanta’s (NOVT). Novanta offers zero dividends but reinvests heavily in growth, supported by a robust free cash flow yield and a low payout ratio of zero. Novanta’s buybacks are significant, enhancing total shareholder value in lieu of dividends. I see Novanta’s growth-focused reinvestment and intense buybacks as more sustainable and likely to deliver superior total returns in 2026, especially given its higher operating margins and cash flow conversion. Corning’s dividend cushion appeals to income investors, but Novanta’s capital allocation strategy prioritizes long-term value creation, making NOVT the superior choice for total shareholder reward.
Comparative Score Analysis: The Strategic Profile
The radar chart reveals the fundamental DNA and trade-offs of Corning Incorporated and Novanta Inc., highlighting their financial strengths and valuation challenges:
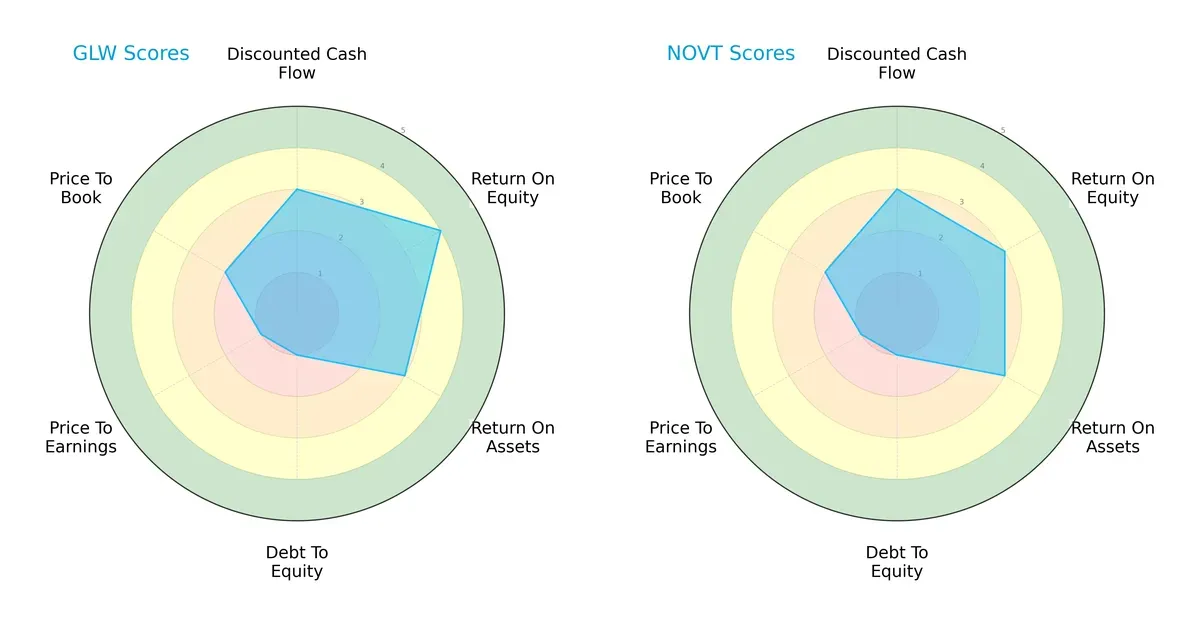
Corning shows a stronger return on equity (4 vs. 3) and a slightly better return on assets (3 vs. 3, equal), suggesting more efficient profit generation. Both firms share very unfavorable debt-to-equity and price-to-earnings scores (1 each), indicating balance sheet leverage and valuation concerns. Novanta’s profile is more balanced but less differentiated, while Corning leans on superior profitability metrics to offset valuation risks.
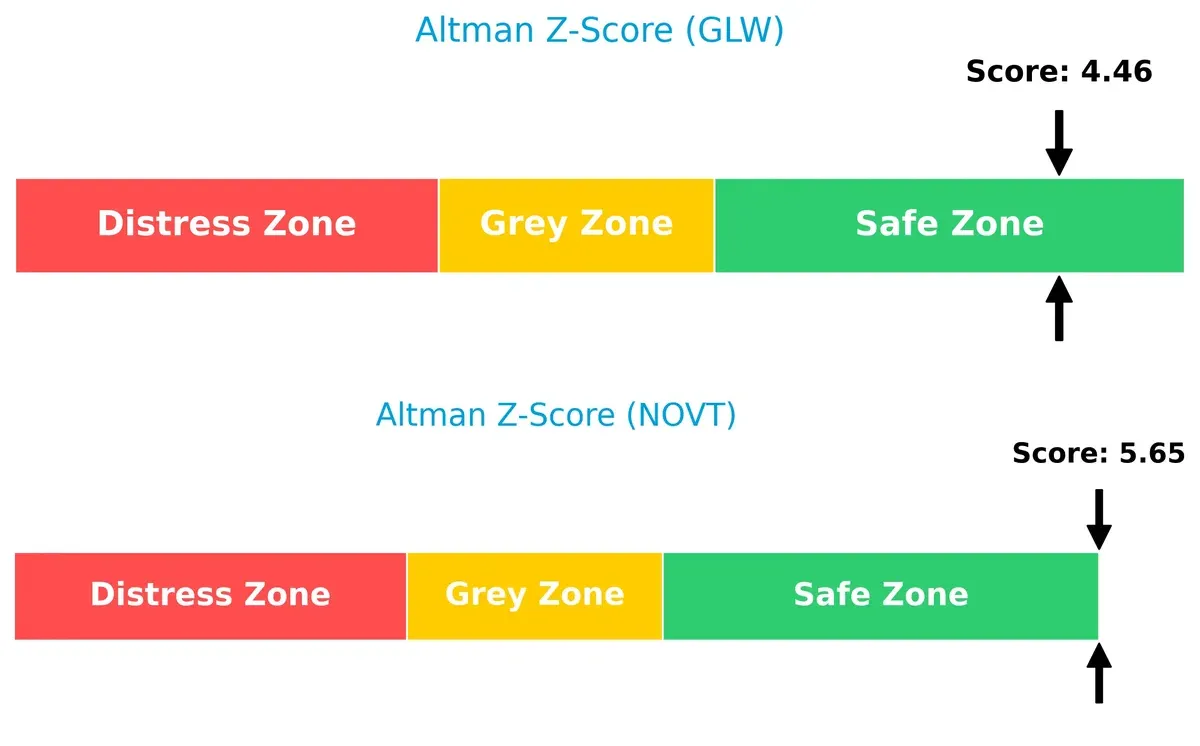
Bankruptcy Risk: Solvency Showdown
Corning’s Altman Z-Score of 4.46 versus Novanta’s 5.65 signals both companies are firmly in the safe zone, with Novanta showing a stronger buffer against bankruptcy risk in this cycle:
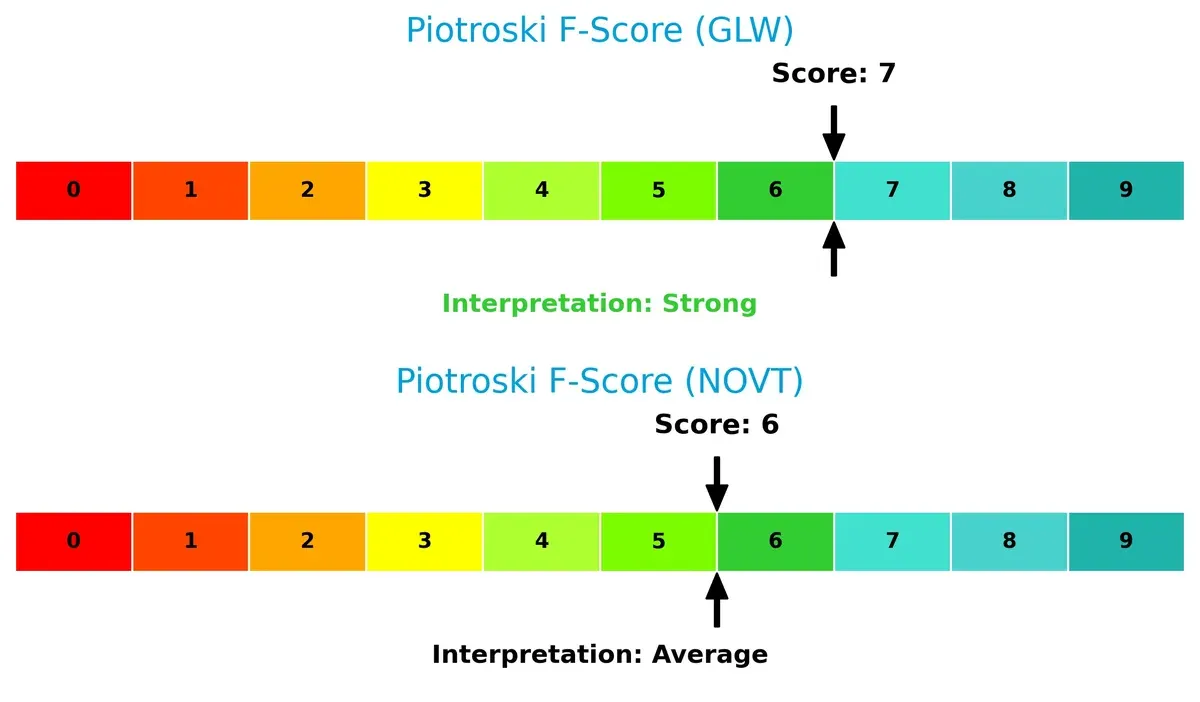
Financial Health: Quality of Operations
Corning’s Piotroski F-Score of 7 indicates stronger operational health compared to Novanta’s 6, reflecting superior internal financial quality and fewer red flags:
How are the two companies positioned?
This section dissects the operational DNA of Corning and Novanta by comparing their revenue distribution by segment alongside internal strengths and weaknesses. The goal is to confront their economic moats to reveal which model offers the most resilient, sustainable competitive advantage today.
Revenue Segmentation: The Strategic Mix
This visual comparison dissects how Corning Incorporated and Novanta Inc. diversify their income streams and highlights their primary sector bets:
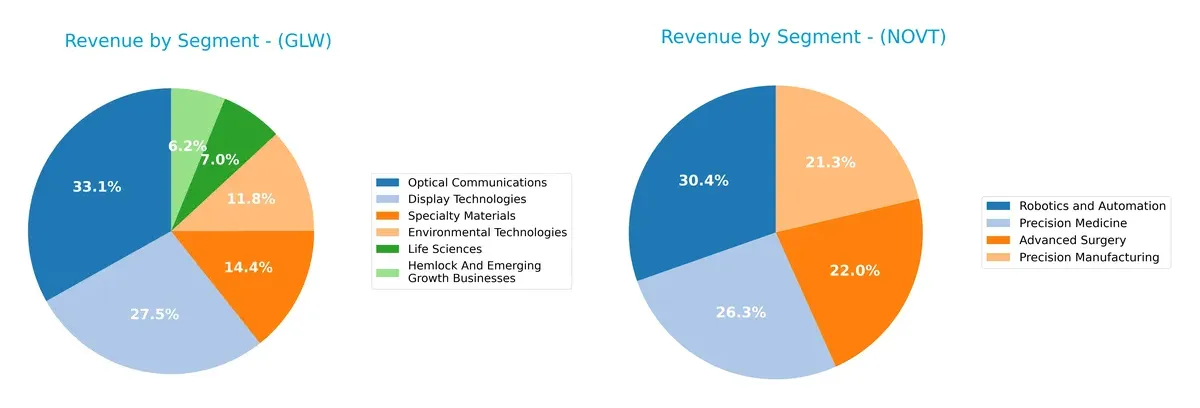
Corning anchors its revenue in Optical Communications at $4.7B and Display Technologies at $3.9B, dwarfing other segments. Its mix shows moderate diversification with Specialty Materials ($2.0B) and Environmental Technologies ($1.7B). Novanta’s revenue is more evenly distributed across Robotics and Automation ($288M), Precision Medicine ($250M), and Advanced Surgery ($209M). Corning’s concentration suggests infrastructure dominance but carries concentration risk. Novanta pivots on precision tech diversity, reducing single-segment vulnerability.
Strengths and Weaknesses Comparison
This table compares the strengths and weaknesses of Corning Incorporated and Novanta Inc.:
Corning Incorporated Strengths
- Strong global presence with $7.3B Asia Pacific and $5.6B North America sales
- Diverse product segments including Optical Communications and Display Technologies
- Favorable net margin at 10.21%
- Solid liquidity ratios with current ratio 1.59 and quick ratio 1.04
- Low debt to assets at 27.23% supports financial stability
Novanta Inc. Strengths
- Favorable liquidity with current ratio 2.58 and quick ratio 1.72
- High fixed asset turnover at 6.08 indicates efficient asset use
- Diversified technology segments including Robotics, Advanced Surgery, and Precision Medicine
- Significant U.S. revenue at $487M
- Presence in Europe and Asia Pacific markets
Corning Incorporated Weaknesses
- High valuation multiples: PE 47.18 and PB 6.38 suggest premium pricing
- ROIC (7.4%) slightly below WACC (8.56%), indicating limited capital efficiency
- Neutral ROE at 13.52%
- Moderate asset turnover at 0.5 signals room for operational improvement
Novanta Inc. Weaknesses
- Unfavorable ROE at 8.59% and WACC at 10.87%, indicating weak profitability versus capital cost
- High PE of 85.7 and PB of 7.37 imply expensive valuation
- Zero dividend yield limits income appeal
- Debt to assets ratio neutral but interest coverage at 3.95 is lower than peer
Corning’s strengths lie in its broad geographic reach and product diversification with a stable profitability profile. Novanta shows operational efficiency but faces profitability and valuation challenges. Both companies must balance growth ambitions against capital costs and valuation risks in their strategic planning.
The Moat Duel: Analyzing Competitive Defensibility
A structural moat stands as the sole barrier protecting long-term profits from relentless competitive erosion:
Corning Incorporated: Intangible Assets and Scale Moat
Corning dominates through proprietary glass and optical technologies, reflected in stable 35%+ gross margins. Its expanding Asia-Pacific footprint deepens this intangible asset moat in 2026.
Novanta Inc.: Precision Engineering Niche Moat
Novanta’s moat relies on specialized photonics and precision motion components, yielding a superior 44% gross margin but a narrower scale than Corning. Growth in medical tech could widen its niche advantage.
Scale and Intangibles vs. Specialized Precision: Moat Depth Showdown
Corning’s vast scale and entrenched intangible assets create a wider moat than Novanta’s focused precision engineering. Corning is better positioned to defend market share amid intensifying global competition.
Which stock offers better returns?
Over the past year, Corning Incorporated’s stock surged sharply, while Novanta Inc. faced a notable decline, with recent months showing contrasting recovery dynamics.
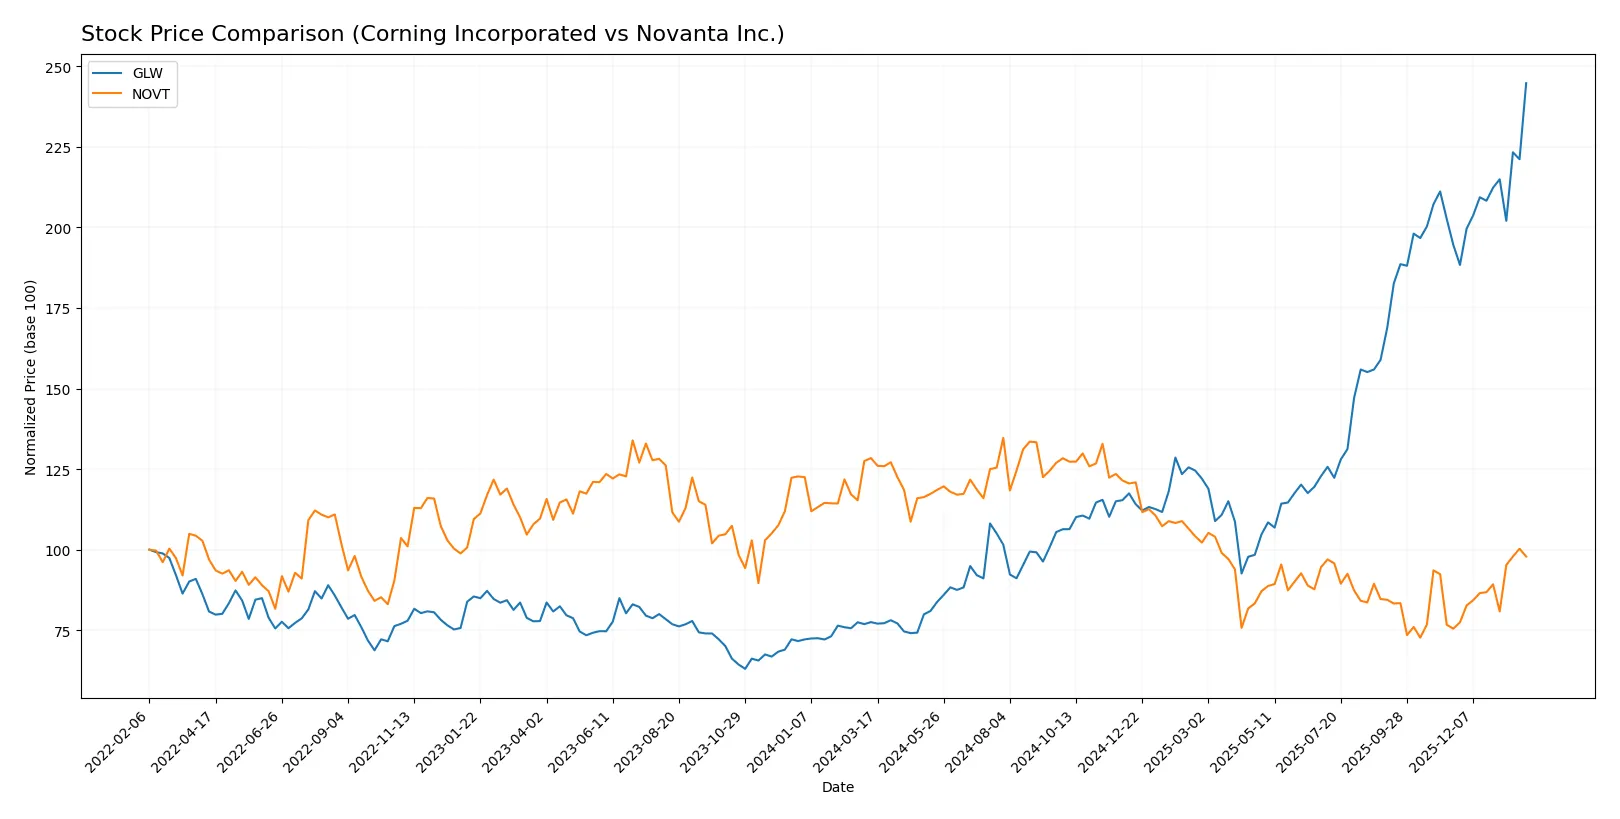
Trend Comparison
Corning Incorporated’s stock rose 216% over the past 12 months, marking a bullish trend with accelerating momentum and a high volatility of 18.43. The highest price reached 103.25, the lowest 31.27.
Novanta Inc.’s stock declined 23.8% over the same period, indicating a bearish trend with accelerating downside volatility at 24.81. It hit a peak of 185.16 and a trough of 99.96.
Corning’s stock outperformed Novanta’s significantly over the past year, delivering the strongest market performance despite both showing positive recent momentum.
Target Prices
Analysts present a bullish consensus for both Corning Incorporated and Novanta Inc.
| Company | Target Low | Target High | Consensus |
|---|---|---|---|
| Corning Incorporated | 100 | 130 | 116.63 |
| Novanta Inc. | 160 | 160 | 160 |
Corning’s target consensus of 116.63 suggests upside potential from the current 103.25 price. Novanta’s single target at 160 implies a significant premium over its 134.54 market price.

Don’t Let Luck Decide Your Entry Point
Optimize your entry points with our advanced ProRealTime indicators. You’ll get efficient buy signals with precise price targets for maximum performance. Start outperforming now!
How do institutions grade them?
The following tables summarize recent institutional grades for Corning Incorporated and Novanta Inc.:
Corning Incorporated Grades
Here are the latest grades assigned to Corning Incorporated by key financial institutions.
| Grading Company | Action | New Grade | Date |
|---|---|---|---|
| Morgan Stanley | Maintain | Equal Weight | 2026-01-29 |
| Mizuho | Maintain | Outperform | 2026-01-29 |
| Citigroup | Maintain | Buy | 2026-01-29 |
| Susquehanna | Maintain | Positive | 2026-01-29 |
| JP Morgan | Maintain | Overweight | 2026-01-28 |
| Citigroup | Maintain | Buy | 2026-01-12 |
| Morgan Stanley | Maintain | Equal Weight | 2025-12-17 |
| UBS | Maintain | Buy | 2025-11-21 |
| Citigroup | Maintain | Buy | 2025-10-29 |
| JP Morgan | Maintain | Overweight | 2025-10-29 |
Novanta Inc. Grades
Below are the recent grades given to Novanta Inc. by recognized grading firms.
| Grading Company | Action | New Grade | Date |
|---|---|---|---|
| Baird | Maintain | Neutral | 2025-08-11 |
| Baird | Maintain | Neutral | 2025-03-03 |
| Baird | Maintain | Neutral | 2024-11-06 |
| Baird | Maintain | Neutral | 2024-08-07 |
| Baird | Maintain | Neutral | 2023-05-11 |
| Baird | Maintain | Neutral | 2023-05-10 |
| William Blair | Upgrade | Outperform | 2022-05-11 |
| William Blair | Upgrade | Outperform | 2022-05-10 |
| Berenberg | Maintain | Hold | 2020-11-13 |
| Baird | Maintain | Neutral | 2020-05-13 |
Which company has the best grades?
Corning Incorporated consistently earns higher and more recent positive grades, including multiple “Buy” and “Outperform” ratings. Novanta Inc. mostly holds “Neutral” ratings, with fewer upgrades. Investors may view Corning’s stronger grades as a signal of greater institutional confidence.
Risks specific to each company
The following categories identify the critical pressure points and systemic threats facing both firms in the 2026 market environment:
1. Market & Competition
Corning Incorporated
- Operates in diversified tech segments but faces intense competition in display and optical markets.
Novanta Inc.
- Focuses on niche photonics and precision motion components with aggressive rivals in medical and industrial sectors.
2. Capital Structure & Debt
Corning Incorporated
- Moderate debt-to-equity ratio (0.71) with favorable interest coverage (7.11), indicating balanced leverage.
Novanta Inc.
- Similar leverage (0.63 D/E) but weaker interest coverage (3.95), increasing financial risk under stress.
3. Stock Volatility
Corning Incorporated
- Beta of 1.125 suggests moderate volatility aligned with broad market trends.
Novanta Inc.
- Higher beta at 1.603 implies greater sensitivity to market swings and elevated risk.
4. Regulatory & Legal
Corning Incorporated
- Exposure to environmental and tech regulations across multiple industries; compliance costs can rise.
Novanta Inc.
- Operates in highly regulated medical and industrial sectors, facing complex product safety and export controls.
5. Supply Chain & Operations
Corning Incorporated
- Large scale global operations with potential supply chain disruptions but diversified suppliers.
Novanta Inc.
- Smaller scale with specialized components increases vulnerability to supplier or logistics disruptions.
6. ESG & Climate Transition
Corning Incorporated
- Environmental technologies segment supports ESG profile; transition risks moderate but managed.
Novanta Inc.
- Less diversified ESG initiatives; climate transition risks could impact manufacturing and energy costs.
7. Geopolitical Exposure
Corning Incorporated
- Global footprint subjects it to trade tensions and tariffs, but scale buffers shocks.
Novanta Inc.
- More concentrated operations increase exposure to regional geopolitical instability and trade barriers.
Which company shows a better risk-adjusted profile?
Corning’s strongest risk remains its high valuation multiples, raising concerns on price sustainability despite solid financial stability. Novanta’s greatest risk lies in its high stock volatility and weaker financial ratios, increasing vulnerability during downturns. Corning’s diversified operations and strong liquidity grant it a better risk-adjusted profile. Notably, Novanta’s beta of 1.603 signals heightened market sensitivity, justifying caution despite niche market strengths.
Final Verdict: Which stock to choose?
Corning Incorporated’s superpower lies in its resilience and improving profitability, demonstrated by a bullish price trend and strong operating margins. Its point of vigilance is the moderate premium valuation, which could limit near-term upside. This stock suits investors focused on steady growth with some risk tolerance.
Novanta Inc. boasts a strategic moat in its specialized technology and high asset turnover, offering a unique competitive edge. It presents a safer liquidity profile but trades with a less favorable valuation and a bearish long-term trend. This stock fits those seeking growth with a cautious capital preservation mindset.
If you prioritize growth backed by improving operational strength and can tolerate valuation premiums, Corning Incorporated outshines as the compelling choice. However, if you seek a niche technology play with better liquidity and moderate risk, Novanta offers better stability despite its challenges. Both require careful monitoring of their valuation and cash flow dynamics.
Disclaimer: Investment carries a risk of loss of initial capital. The past performance is not a reliable indicator of future results. Be sure to understand risks before making an investment decision.
Go Further
I encourage you to read the complete analyses of Corning Incorporated and Novanta Inc. to enhance your investment decisions: