Home > Comparison > Technology > GLW vs MKSI
The strategic rivalry between Corning Incorporated and MKS Inc. shapes the evolution of the technology sector’s hardware, equipment, and parts industry. Corning operates as a diversified industrial powerhouse with broad applications in display, optical, and specialty materials. MKS focuses on precision instruments and process control solutions, targeting semiconductor and advanced manufacturing markets. This analysis will assess which company’s operational model offers superior risk-adjusted returns for a diversified portfolio in 2026.
Table of contents
Companies Overview
Corning Incorporated and MKS Inc. hold pivotal roles in the hardware, equipment, and parts sector.
Corning Incorporated: Pioneer in Specialty Glass and Optical Technologies
Corning Incorporated stands as a global leader in display technologies and optical communications. It generates revenue by supplying glass substrates for LCDs and OLEDs and providing optical fibers and cables. In 2026, Corning strategically focuses on advancing specialty materials and environmental technologies, leveraging its deep expertise in glass innovation to serve diverse industries like consumer electronics and telecommunications.
MKS Inc.: Precision Control and Laser Solutions Provider
MKS Inc. operates as a high-tech supplier of instruments and systems that regulate manufacturing processes. Its core revenue derives from vacuum and pressure control solutions, laser technologies, and photonics products. The company’s 2026 strategy emphasizes expanding its laser-based systems for PCB manufacturing and enhancing precision metrology, targeting semiconductor and industrial technology markets with advanced process control.
Strategic Collision: Similarities & Divergences
Both companies thrive in the hardware and equipment industry but diverge in approach. Corning leverages a material science moat, focusing on glass and optical components, while MKS prioritizes precision instruments and laser systems within manufacturing processes. Their primary competition centers on serving semiconductor and industrial clients, yet their investment profiles differ—Corning offers scale and diversification, whereas MKS presents a niche with higher volatility and specialized technology exposure.
Income Statement Comparison
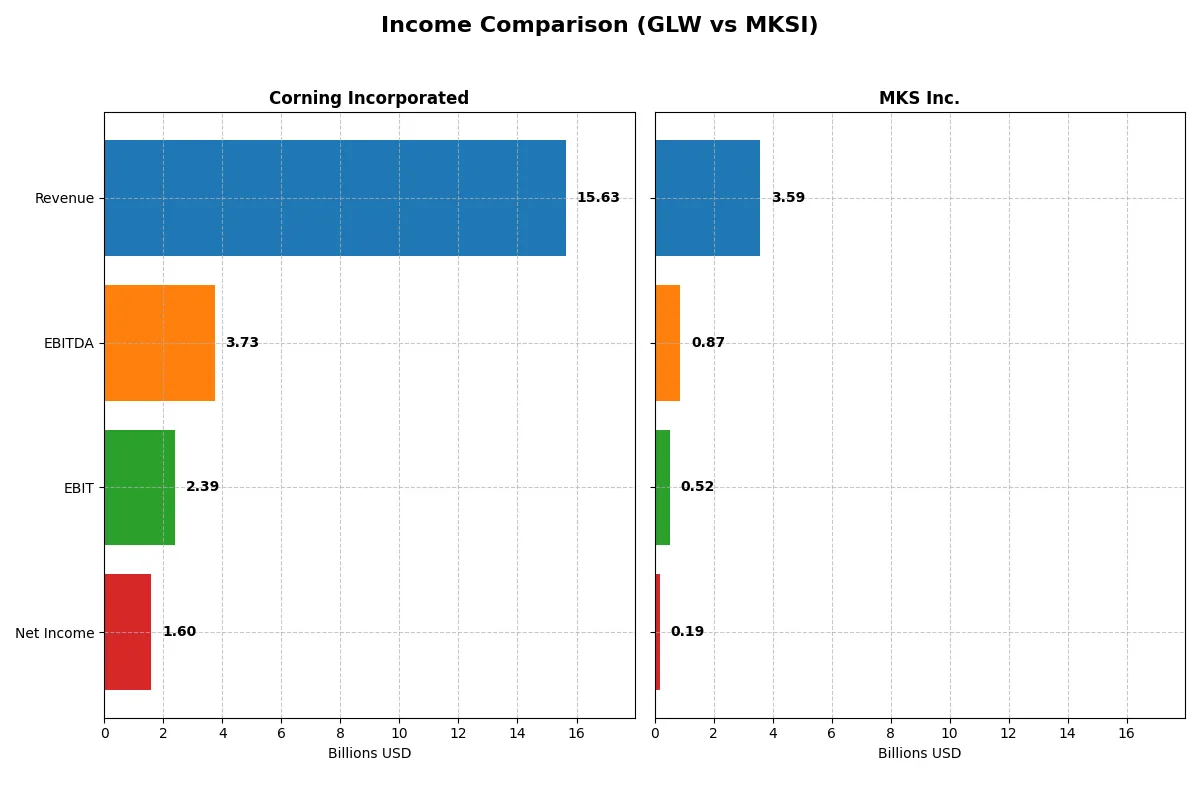
This data dissects the core profitability and scalability of both corporate engines to reveal who dominates the bottom line:
| Metric | Corning Incorporated (GLW) | MKS Inc. (MKSI) |
|---|---|---|
| Revenue | 15.6B | 3.59B |
| Cost of Revenue | 10.1B | 1.88B |
| Operating Expenses | 3.18B | 1.21B |
| Gross Profit | 5.51B | 1.71B |
| EBITDA | 3.74B | 870M |
| EBIT | 2.39B | 522M |
| Interest Expense | 336M | 345M |
| Net Income | 1.60B | 190M |
| EPS | 1.86 | 2.82 |
| Fiscal Year | 2025 | 2024 |
Income Statement Analysis: The Bottom-Line Duel
The following income statement comparison reveals the true efficiency and profitability of Corning Incorporated and MKS Inc.’s corporate engines.
Corning Incorporated (GLW) Analysis
Corning’s revenue climbed steadily to $15.6B in 2025, up 19% from 2024, highlighting robust top-line growth. Net income surged to $1.6B, more than tripling year-over-year, with a solid 10.2% net margin and a favorable gross margin of 35.3%. The company accelerated EBIT growth by 109%, signaling strong operational momentum and effective cost management.
MKS Inc. (MKSI) Analysis
MKS posted $3.6B revenue in 2024, nearly flat compared to 2023, reflecting top-line stagnation. Net income rebounded to $190M from a steep loss in 2023, lifting net margin to 5.3%. Gross margin remains healthy at 47.6%, and EBIT jumped 135%, showing a swift operational recovery despite mixed margin trends over the longer term.
Margin Resilience vs. Revenue Expansion
Corning dominates in revenue scale and margin expansion, with impressive EBIT and net income growth in 2025. MKS shows margin resilience and a sharp turnaround but on a smaller revenue base. Corning’s profile appeals to investors seeking robust growth and operational leverage; MKS suits those favoring a recovery story with margin focus.
Financial Ratios Comparison
These vital ratios act as a diagnostic tool to expose the underlying fiscal health, valuation premiums, and capital efficiency of the companies compared below:
| Ratios | Corning Incorporated (GLW) | MKS Inc. (MKSI) |
|---|---|---|
| ROE | 13.52% | 8.18% |
| ROIC | 7.40% | 6.31% |
| P/E | 47.18 | 36.98 |
| P/B | 6.38 | 3.03 |
| Current Ratio | 1.59 | 3.19 |
| Quick Ratio | 1.04 | 2.04 |
| D/E | 0.71 | 2.06 |
| Debt-to-Assets | 27.23% | 55.65% |
| Interest Coverage | 6.78 | 1.44 |
| Asset Turnover | 0.50 | 0.42 |
| Fixed Asset Turnover | 1.05 | 3.55 |
| Payout Ratio | 62.59% | 31.05% |
| Dividend Yield | 1.33% | 0.84% |
| Fiscal Year | 2025 | 2024 |
Efficiency & Valuation Duel: The Vital Signs
Financial ratios serve as a company’s DNA, uncovering hidden risks and revealing operational excellence that raw numbers often mask.
Corning Incorporated
Corning posts a solid 13.5% ROE and a favorable 10.2% net margin, signaling decent profitability. However, its P/E of 47.2 suggests the stock trades at a premium. The company balances shareholder returns with a modest 1.33% dividend yield, reflecting steady income alongside R&D investments driving growth.
MKS Inc.
MKS delivers a weaker 8.2% ROE and a neutral 5.3% net margin, indicating less robust profitability. Its P/E of 37.0 is high but somewhat lower than Corning’s. Shareholder returns lag with a 0.84% dividend yield, while the firm leans on reinvestment in R&D to support future expansion and operational improvements.
Premium Valuation vs. Operational Safety
Corning offers stronger profitability but at a stretched valuation, while MKS shows weaker metrics with more financial risk. Corning’s balance suits investors prioritizing income and growth, whereas MKS fits those willing to weather volatility for potential operational gains.
Which one offers the Superior Shareholder Reward?
Corning Incorporated (GLW) yields 1.33% with a high 63% payout ratio, signaling mature, steady dividends but moderate buybacks. MKS Inc. (MKSI) offers a lower 0.84% yield and 31% payout but reinvests heavily, fueling growth. MKSI’s aggressive buybacks and strong free cash flow of 6.1B in 2024 suggest higher total return potential. I favor MKSI for superior shareholder reward through sustainable growth and capital allocation in 2026.
Comparative Score Analysis: The Strategic Profile
The radar chart reveals the fundamental DNA and trade-offs of Corning Incorporated and MKS Inc., highlighting their financial strengths and valuation nuances:
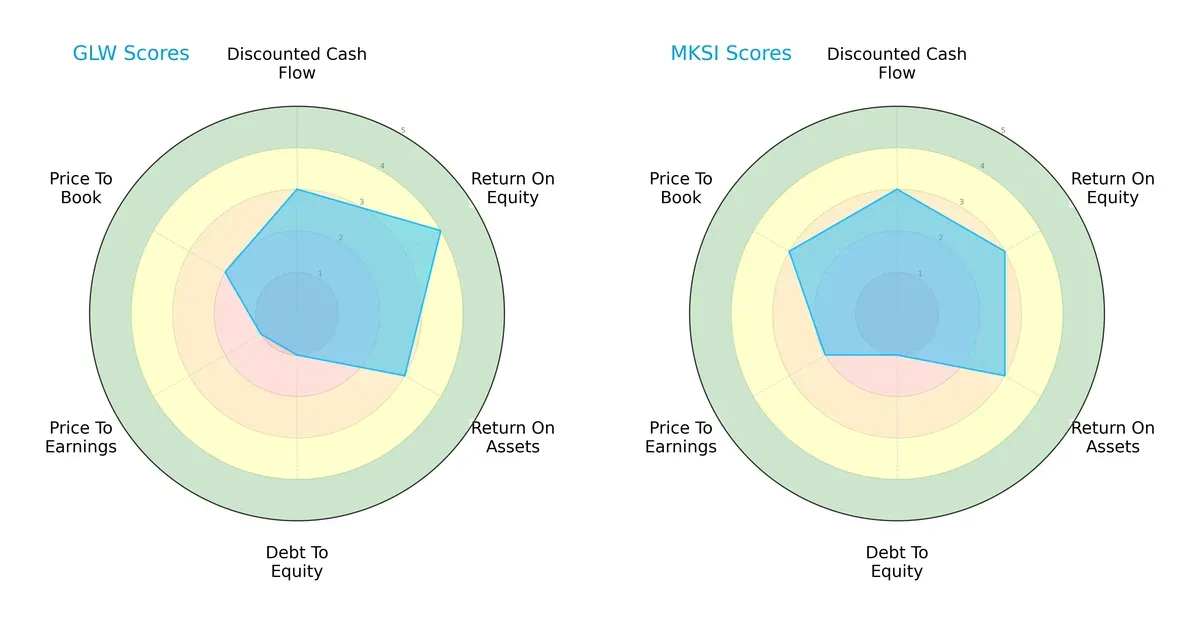
Corning leads in return on equity with a score of 4 versus MKS’s 3, showing superior profit generation efficiency. Both match on discounted cash flow and return on assets at 3, but neither excels in debt management, both scoring 1, signaling elevated leverage risks. MKS offers a more balanced valuation profile with better P/E and P/B scores, while Corning relies heavily on operational efficiency, creating a trade-off between profitability and market pricing.
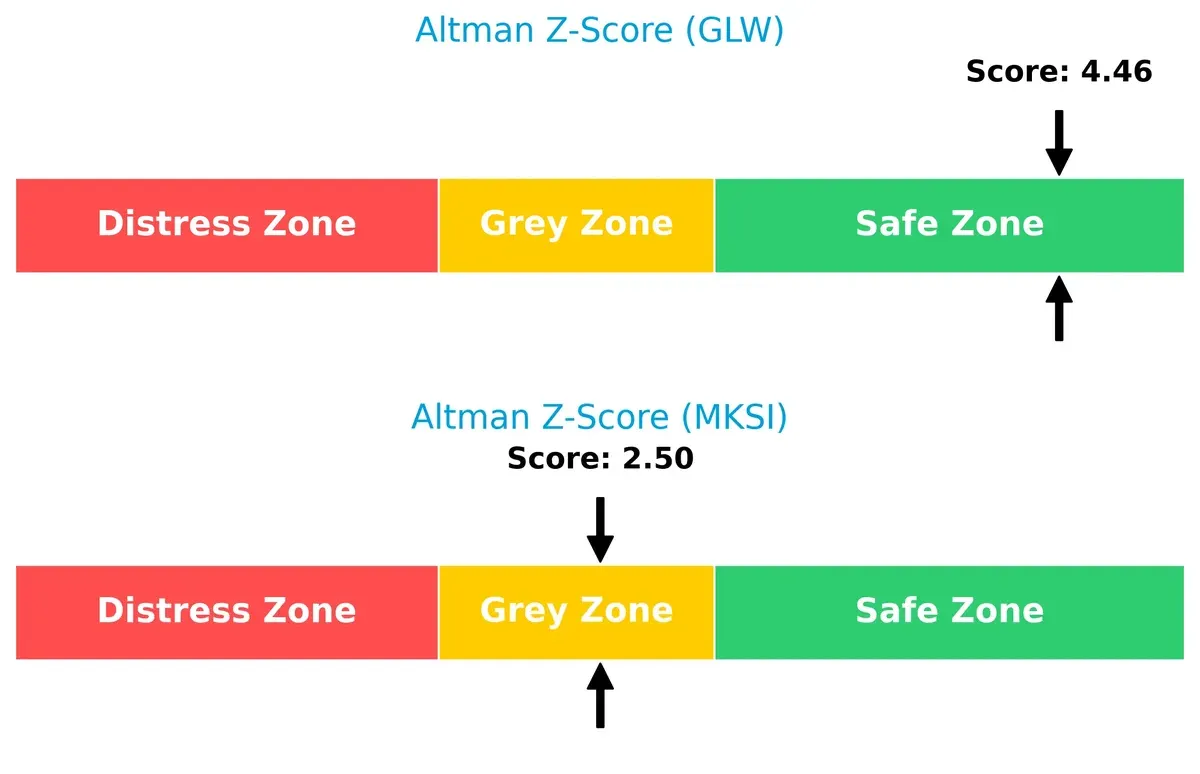
Bankruptcy Risk: Solvency Showdown
Corning’s Altman Z-Score of 4.46 places it firmly in the safe zone, while MKS’s 2.50 sits in the grey zone, indicating moderate bankruptcy risk in this cycle:
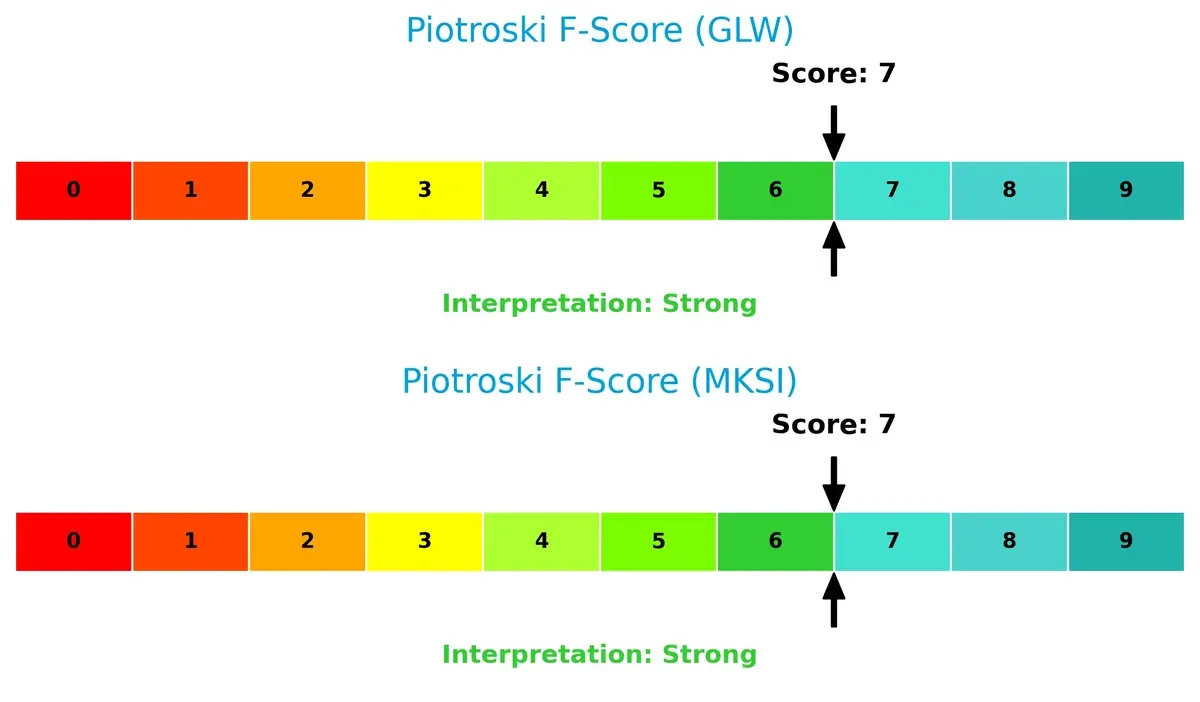
Financial Health: Quality of Operations
Both companies share a strong Piotroski F-Score of 7, signaling solid financial health and operational quality with no immediate red flags in internal metrics:
How are the two companies positioned?
This section dissects the operational DNA of Corning and MKS by comparing their revenue distribution and internal dynamics. The goal is to confront their economic moats and identify which model offers the most resilient competitive advantage today.
Revenue Segmentation: The Strategic Mix
This visual comparison dissects how Corning Incorporated and MKS Inc. diversify their income streams and highlights where their primary sector bets lie:
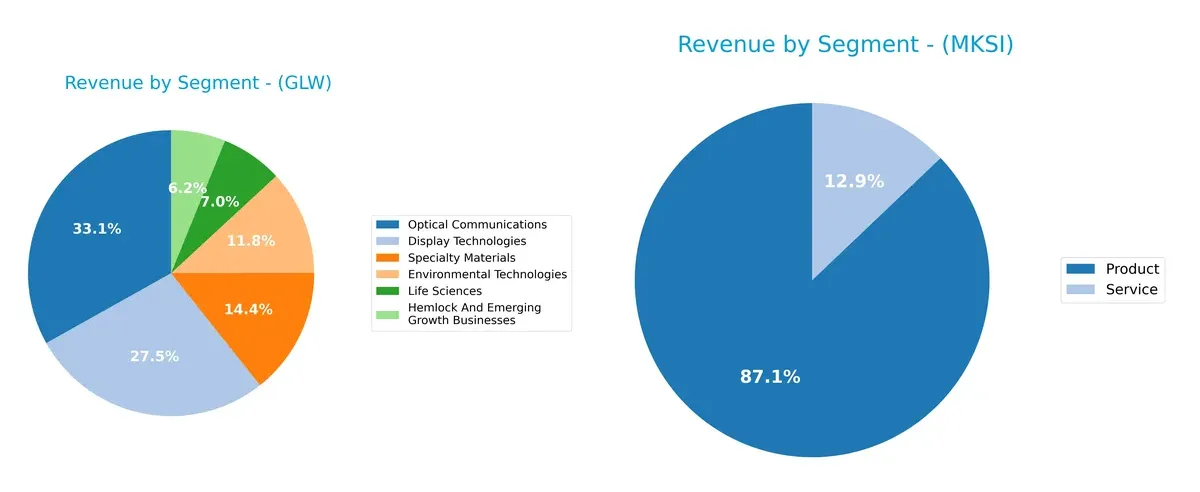
Corning Incorporated anchors its revenue in Optical Communications ($4.66B) and Display Technologies ($3.87B), showing a strong focus on these core segments. Its other streams like Specialty Materials ($2.02B) and Environmental Technologies ($1.67B) provide moderate diversification. MKS Inc., by contrast, concentrates heavily in Product sales ($3.12B) over Services ($462M), signaling a narrower, product-centric model. Corning’s diversified portfolio reduces concentration risk, while MKS’s reliance on product sales might expose it to market cycle volatility.
Strengths and Weaknesses Comparison
This table compares the Strengths and Weaknesses of Corning Incorporated and MKS Inc.:
Corning Incorporated Strengths
- Diversified product segments including Optical Communications and Display Technologies
- Favorable net margin at 10.21%
- Strong interest coverage ratio at 7.11
- Favorable quick ratio of 1.04
- Lower debt to assets at 27.23%
- Global presence with significant Asia Pacific and North America sales
MKS Inc. Strengths
- Favorable quick ratio at 2.04
- Strong fixed asset turnover at 3.55
- Product and service revenue streams
- Presence in key Asian markets including China, Japan, Korea
- Diverse vacuum and photonics solutions divisions
Corning Incorporated Weaknesses
- Unfavorable high P/E at 47.18 and P/B at 6.38 indicating premium valuation
- Neutral ROIC below WACC at 7.4% vs. 8.56%
- Moderate asset turnover of 0.5
- Neutral ROE at 13.52%
- Debt to equity ratio neutral at 0.71
MKS Inc. Weaknesses
- Unfavorable high debt to equity at 2.06 and debt to assets at 55.65%
- Low interest coverage at 1.51
- Unfavorable ROE at 8.18% below industry standards
- Unfavorable WACC at 11.34% exceeds ROIC
- Elevated current ratio at 3.19 flagged as unfavorable
- Lower net margin at 5.3% and dividend yield at 0.84%
Overall, Corning shows strength in diversified revenue streams and healthier financial leverage but faces valuation pressure. MKS exhibits operational strengths in asset efficiency but carries higher financial risk and weaker profitability metrics. These factors influence each company’s capital allocation and growth strategies.
The Moat Duel: Analyzing Competitive Defensibility
A structural moat is the only shield that protects long-term profits from relentless competitive erosion. Let’s examine two industry players:
Corning Incorporated: Intangible Assets Powering Margin Stability
I see Corning’s moat rooted in its intangible assets—patented specialty glass and advanced materials. This sustains a stable 35% gross margin and growing profitability into 2026. New product innovations in life sciences could deepen this advantage.
MKS Inc.: Precision Engineering Faces Declining ROIC
MKS relies on specialized vacuum and laser technologies, a narrower moat than Corning’s broad patents. Despite a strong 47% gross margin, MKS suffers declining ROIC, signaling weakening capital efficiency. Market disruptions could challenge its foothold.
Intangible Assets vs. Precision Engineering: Who Defends Better?
Corning’s intangible asset moat proves wider and more durable despite slight value erosion. MKS’s shrinking ROIC and concentrated tech make its moat shallower. Corning stands better poised to defend and grow market share in 2026.
Which stock offers better returns?
The past year shows strong price gains for both stocks, with Corning Incorporated and MKS Inc. exhibiting bullish momentum and distinct acceleration patterns in their trading dynamics.
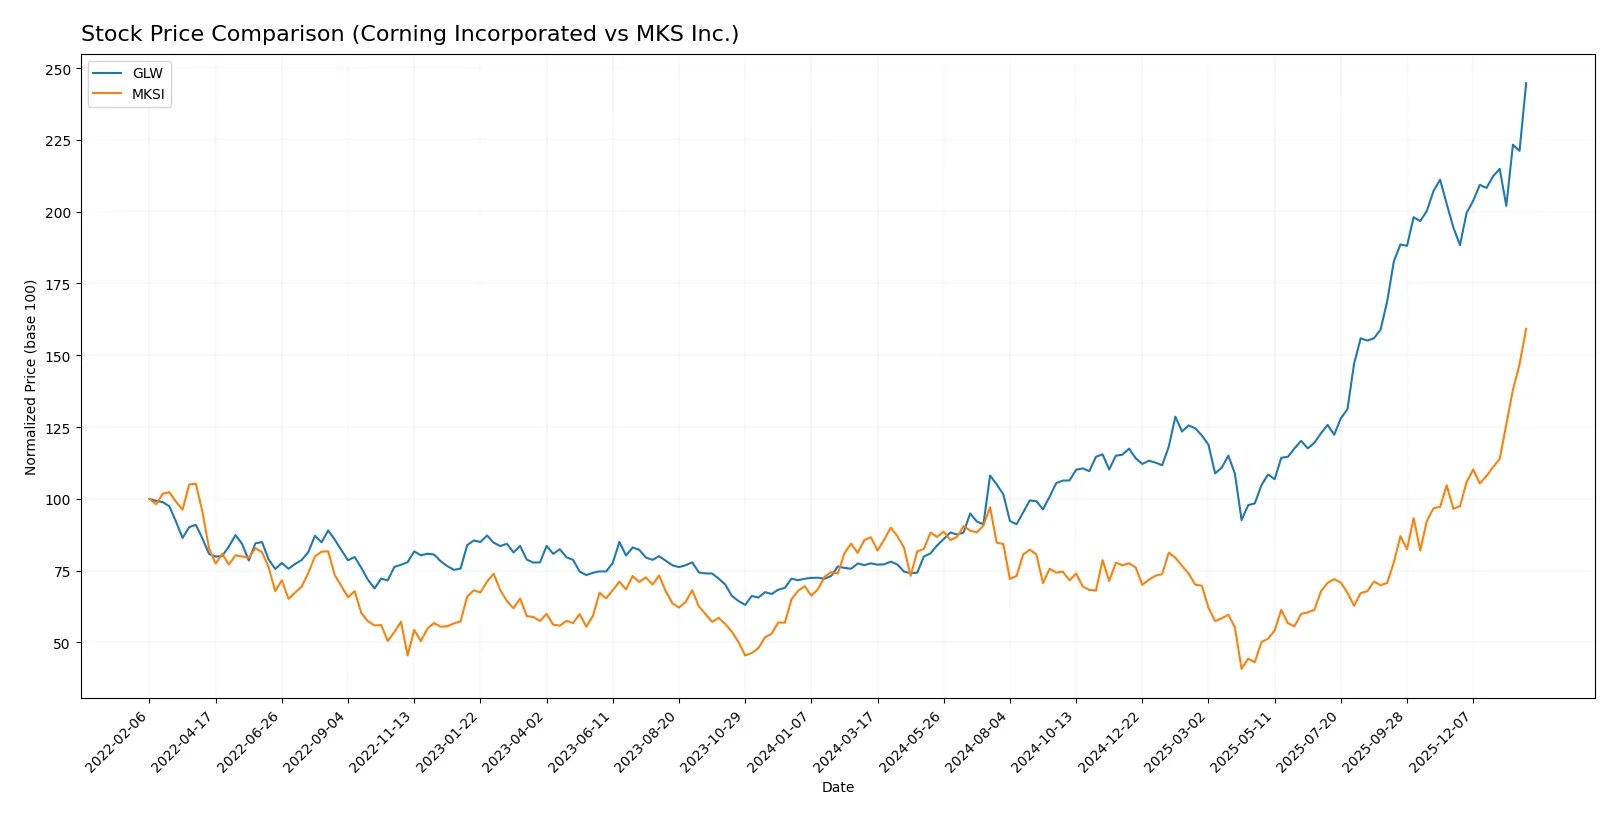
Trend Comparison
Corning Incorporated’s stock surged 215.65% over the past year, marking a bullish trend with accelerating gains and a price range from 31.27 to 103.25. Volatility is moderate with a 18.43 standard deviation.
MKS Inc. rose 83.81% over the same period, also bullish with accelerating momentum. It experienced higher volatility, reflected in a 29.22 standard deviation, and traded between 60.29 and 235.41.
Comparing trends, Corning delivered stronger overall returns with significant acceleration, outperforming MKS in market performance despite MKS’s higher volatility and recent sharp gains.
Target Prices
Analysts present a bullish consensus for both Corning Incorporated and MKS Inc., reflecting confidence in their growth prospects.
| Company | Target Low | Target High | Consensus |
|---|---|---|---|
| Corning Incorporated | 100 | 130 | 116.63 |
| MKS Inc. | 151 | 265 | 223 |
Corning’s consensus target of 116.63 suggests modest upside from its current 103.25 price. MKS shows stronger expected gains, with a 223 consensus well above the current 235.41 price amid recent volatility.

Don’t Let Luck Decide Your Entry Point
Optimize your entry points with our advanced ProRealTime indicators. You’ll get efficient buy signals with precise price targets for maximum performance. Start outperforming now!
How do institutions grade them?
Here is a summary of recent institutional grades for Corning Incorporated and MKS Inc.:
Corning Incorporated Grades
The following table shows recent grades assigned to Corning Incorporated by major institutions.
| Grading Company | Action | New Grade | Date |
|---|---|---|---|
| Morgan Stanley | Maintain | Equal Weight | 2026-01-29 |
| Mizuho | Maintain | Outperform | 2026-01-29 |
| Citigroup | Maintain | Buy | 2026-01-29 |
| Susquehanna | Maintain | Positive | 2026-01-29 |
| JP Morgan | Maintain | Overweight | 2026-01-28 |
| Citigroup | Maintain | Buy | 2026-01-12 |
| Morgan Stanley | Maintain | Equal Weight | 2025-12-17 |
| UBS | Maintain | Buy | 2025-11-21 |
| Citigroup | Maintain | Buy | 2025-10-29 |
| JP Morgan | Maintain | Overweight | 2025-10-29 |
MKS Inc. Grades
Below are recent institutional grades for MKS Inc. from recognized grading companies.
| Grading Company | Action | New Grade | Date |
|---|---|---|---|
| Needham | Maintain | Buy | 2026-01-22 |
| TD Cowen | Maintain | Buy | 2026-01-22 |
| Morgan Stanley | Maintain | Overweight | 2026-01-22 |
| Wells Fargo | Maintain | Equal Weight | 2026-01-22 |
| B of A Securities | Maintain | Buy | 2026-01-22 |
| Cantor Fitzgerald | Maintain | Overweight | 2026-01-20 |
| Keybanc | Maintain | Overweight | 2026-01-16 |
| Wells Fargo | Maintain | Equal Weight | 2026-01-15 |
| Needham | Maintain | Buy | 2026-01-13 |
| B of A Securities | Maintain | Buy | 2026-01-13 |
Which company has the best grades?
MKS Inc. consistently receives Buy and Overweight ratings, indicating stronger institutional confidence than Corning Incorporated. This difference may influence investor perception and portfolio positioning.
Risks specific to each company
The following categories identify critical pressure points and systemic threats facing both firms in the 2026 market environment:
1. Market & Competition
Corning Incorporated
- Large market cap (88.5B) supports scale advantage; faces intense competition in display and optical segments.
MKS Inc.
- Smaller market cap (15.8B) limits scale; operates in niche semiconductor and photonics markets with higher beta (1.92) indicating sensitivity to market swings.
2. Capital Structure & Debt
Corning Incorporated
- Moderate debt-to-assets at 27.2%, interest coverage strong at 7.11x, signaling manageable leverage.
MKS Inc.
- High debt-to-assets at 55.6%, weak interest coverage at 1.51x, elevating financial risk and refinancing concerns.
3. Stock Volatility
Corning Incorporated
- Beta of 1.13 suggests moderate stock volatility aligned with broader market.
MKS Inc.
- Beta of 1.92 signals high stock volatility, adding risk for equity investors.
4. Regulatory & Legal
Corning Incorporated
- Operates globally in regulated tech sectors, but diversified product lines mitigate regulatory shocks.
MKS Inc.
- Focused on semiconductor and photonics industries, sensitive to export controls and tech regulations.
5. Supply Chain & Operations
Corning Incorporated
- Broad supply chain footprint supports resilience but complexity could raise operational risks.
MKS Inc.
- Specialized manufacturing heightens exposure to single-source suppliers and semiconductor cycle volatility.
6. ESG & Climate Transition
Corning Incorporated
- Established environmental technologies segment positions well for climate transition demands.
MKS Inc.
- ESG efforts less visible; semiconductor production energy intensity could pose transition risks.
7. Geopolitical Exposure
Corning Incorporated
- Global footprint exposes it to trade tensions but diversified end markets reduce reliance on any single region.
MKS Inc.
- Semiconductor supply chain highly sensitive to US-China tensions, increasing geopolitical risk.
Which company shows a better risk-adjusted profile?
Corning’s largest risk is its elevated valuation multiples (PE 47.2, PB 6.4) that pressure future returns. MKS faces critical financial leverage risks with heavy debt and low interest coverage. Corning’s safer Altman Z-score (4.46) versus MKS’s grey zone (2.50) highlights stronger financial health. Despite Corning’s valuation concerns, its lower leverage, moderate volatility, and diversified operations provide a more balanced risk-adjusted profile in 2026.
Final Verdict: Which stock to choose?
Corning Incorporated (GLW) stands out for its operational resilience and steady cash flow generation. Its superpower lies in balancing growth with disciplined capital allocation, evidenced by improving profitability trends despite value erosion concerns. The key point of vigilance remains its elevated valuation multiples. GLW fits well in a core or income-oriented portfolio seeking moderate growth.
MKS Inc. (MKSI) boasts a strategic moat rooted in its high-margin product mix and recurring revenue streams from specialized equipment. It carries more financial risk than GLW, with weaker balance sheet metrics and a pronounced profitability decline. This profile suits investors with a higher risk tolerance aiming for turnaround or growth-at-a-reasonable-price (GARP) opportunities.
If you prioritize operational stability and consistent value creation, GLW is the compelling choice due to its improving returns and safer financial footing. However, if you seek growth exposure with a higher risk-reward profile, MKSI offers superior revenue growth potential despite its current profitability challenges. Each scenario demands careful risk management aligned with your portfolio’s risk appetite.
Disclaimer: Investment carries a risk of loss of initial capital. The past performance is not a reliable indicator of future results. Be sure to understand risks before making an investment decision.
Go Further
I encourage you to read the complete analyses of Corning Incorporated and MKS Inc. to enhance your investment decisions: