Home > Comparison > Technology > GLW vs MVIS
The strategic rivalry between Corning Incorporated and MicroVision, Inc. defines the current trajectory of the technology hardware sector. Corning operates as a diversified industrial leader in specialty glass and optical communications, while MicroVision focuses on innovative lidar and micro-display technologies. This head-to-head reflects a battle between established scale and pioneering niche innovation. This analysis aims to identify which corporate path offers superior risk-adjusted returns for a balanced portfolio.
Table of contents
Companies Overview
Corning Incorporated and MicroVision, Inc. stand as pivotal players in the hardware and equipment sector, each shaping innovation in distinct technology niches.
Corning Incorporated: Global Innovator in Specialty Glass and Optical Solutions
Corning commands a dominant position in display technologies and optical communications. Its core revenue derives from glass substrates for LCDs and OLEDs, plus optical fibers and components. In 2026, Corning’s strategic focus sharpened on expanding specialty materials and life sciences segments, leveraging innovation in ultra-thin glass and laboratory consumables to fuel sustainable growth.
MicroVision, Inc.: Pioneer in Lidar and Micro-Display Technologies
MicroVision specializes in advanced lidar sensors and micro-electromechanical system (MEMS) scanning technologies. Its revenue engine centers on selling lidar modules and micro-displays to automotive and consumer electronics OEMs. In 2026, MicroVision prioritized enhancing long-range lidar capabilities and expanding applications in augmented reality, targeting autonomous driving and smart device markets.
Strategic Collision: Similarities & Divergences
Both companies innovate in hardware but diverge sharply in scale and end markets. Corning’s broad, diversified product base contrasts with MicroVision’s focused, emerging lidar and AR technologies. The primary battleground lies in niche technology adaptation—Corning’s mature specialty glass versus MicroVision’s disruptive sensing modules. Their investment profiles differ markedly: Corning offers established stability; MicroVision presents high-growth, high-risk potential.
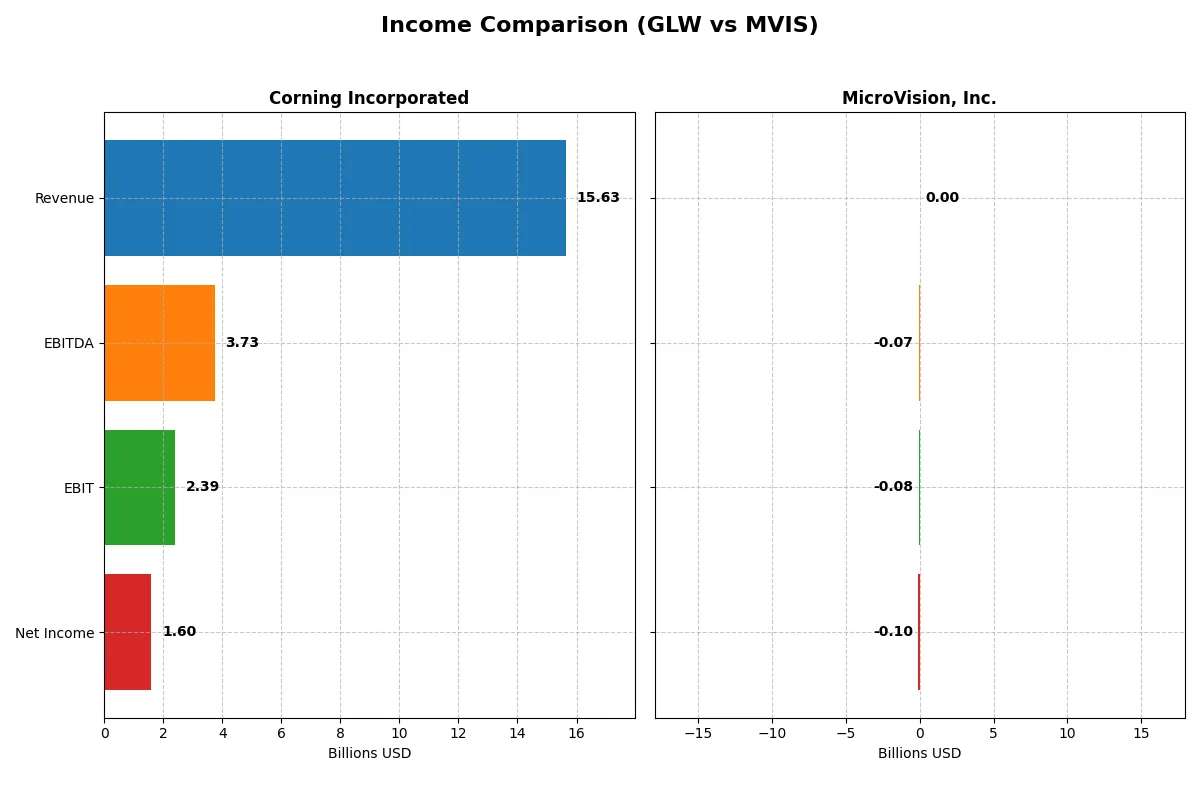
Income Statement Comparison
This data dissects the core profitability and scalability of both corporate engines to reveal who dominates the bottom line:
| Metric | Corning Incorporated (GLW) | MicroVision, Inc. (MVIS) |
|---|---|---|
| Revenue | 15.63B | 4.70M |
| Cost of Revenue | 10.12B | 7.53M |
| Operating Expenses | 3.18B | 82.69M |
| Gross Profit | 5.51B | -2.83M |
| EBITDA | 3.74B | -70.98M |
| EBIT | 2.39B | -75.20M |
| Interest Expense | 336M | 4.46M |
| Net Income | 1.60B | -96.92M |
| EPS | 1.86 | -0.46 |
| Fiscal Year | 2025 | 2024 |
Income Statement Analysis: The Bottom-Line Duel
Comparing these income statements exposes the true operational efficiency and profitability of two very different corporate profiles.
Corning Incorporated Analysis
Corning’s revenue climbs steadily from $14.1B in 2021 to $15.6B in 2025, reflecting solid top-line growth. Net income surged from $1.1B in 2021 to $1.6B in 2025, driven by expanding gross margins around 35% and a net margin improving to 10.2%. The 2025 figures reveal strong operating leverage and margin momentum, with EBITDA doubling year-over-year.
MicroVision, Inc. Analysis
MicroVision’s revenue shows volatility, peaking at $7.3M in 2023 before dropping 35% to $4.7M in 2024. The company consistently reports negative net income, widening to a loss of $97M in 2024. Gross margin remains deeply negative at -60%, while net margin plummets beyond -2,000%. Despite a modest 15% EBIT improvement, losses dominate, reflecting operational inefficiency and high R&D spending.
Margin Power vs. Revenue Scale
Corning dominates with robust revenue growth, expanding margins, and positive net income, signaling efficient capital allocation and operational strength. MicroVision struggles with persistent losses and negative margins despite revenue fluctuations. For investors, Corning’s profile offers stability and profitability, while MicroVision’s remains a high-risk turnaround story.
Financial Ratios Comparison
These vital ratios act as a diagnostic tool to expose the underlying fiscal health, valuation premiums, and capital efficiency of the companies analyzed:
| Ratios | Corning Incorporated (GLW) | MicroVision, Inc. (MVIS) |
|---|---|---|
| ROE | 13.52% | -198.72% |
| ROIC | 7.40% | -83.73% |
| P/E | 47.18 | -2.83 |
| P/B | 6.38 | 5.63 |
| Current Ratio | 1.59 | 1.79 |
| Quick Ratio | 1.04 | 1.74 |
| D/E | 0.71 | 1.06 |
| Debt-to-Assets | 27.23% | 42.62% |
| Interest Coverage | 6.78 | -19.19 |
| Asset Turnover | 0.50 | 0.04 |
| Fixed Asset Turnover | 1.05 | 0.20 |
| Payout ratio | 62.59% | 0 |
| Dividend yield | 1.33% | 0 |
| Fiscal Year | 2025 | 2024 |
Efficiency & Valuation Duel: The Vital Signs
Financial ratios act as a company’s DNA, exposing hidden risks and operational strengths that shape investor confidence and valuation.
Corning Incorporated
Corning displays a solid 13.5% ROE and a favorable 10.2% net margin, indicating operational efficiency. However, its P/E at 47.2 and P/B at 6.4 suggest the stock is somewhat expensive. The company offers a 1.33% dividend yield, balancing shareholder returns with moderate reinvestment in R&D at 7.1% of revenue.
MicroVision, Inc.
MicroVision suffers from deeply negative profitability metrics, with ROE at -199% and net margin of -2064%, signaling severe operational challenges. Its P/E is negative but low at -2.8, reflecting unprofitability rather than cheap valuation. The firm pays no dividends, instead allocating a staggering 10.4% of revenue to R&D, seeking growth amid financial distress.
Premium Valuation vs. Operational Safety
Corning offers a stable profitability profile with a stretched valuation, reflecting market confidence in steady returns and moderate dividends. MicroVision’s metrics highlight high risk and negative profitability, despite aggressive R&D investment. Investors prioritizing risk management may prefer Corning’s profile, while those targeting potential turnaround plays might consider MicroVision.
Which one offers the Superior Shareholder Reward?
I compare Corning Incorporated (GLW) and MicroVision, Inc. (MVIS) on shareholder reward. Corning delivers consistent dividends, yielding 1.33% with a 62.6% payout ratio in 2025. It also maintains robust buybacks funded by solid free cash flow of $1.64/share. MicroVision pays no dividends and posts heavy losses, eroding shareholder value. MVIS reinvests in R&D but suffers negative operating cash flow and widening net losses. Corning’s balanced dividends and buybacks offer a sustainable, superior total return profile. I conclude Corning outperforms MicroVision for income-focused and total return investors in 2026.
Comparative Score Analysis: The Strategic Profile
The radar chart reveals the fundamental DNA and trade-offs of Corning Incorporated and MicroVision, Inc.:
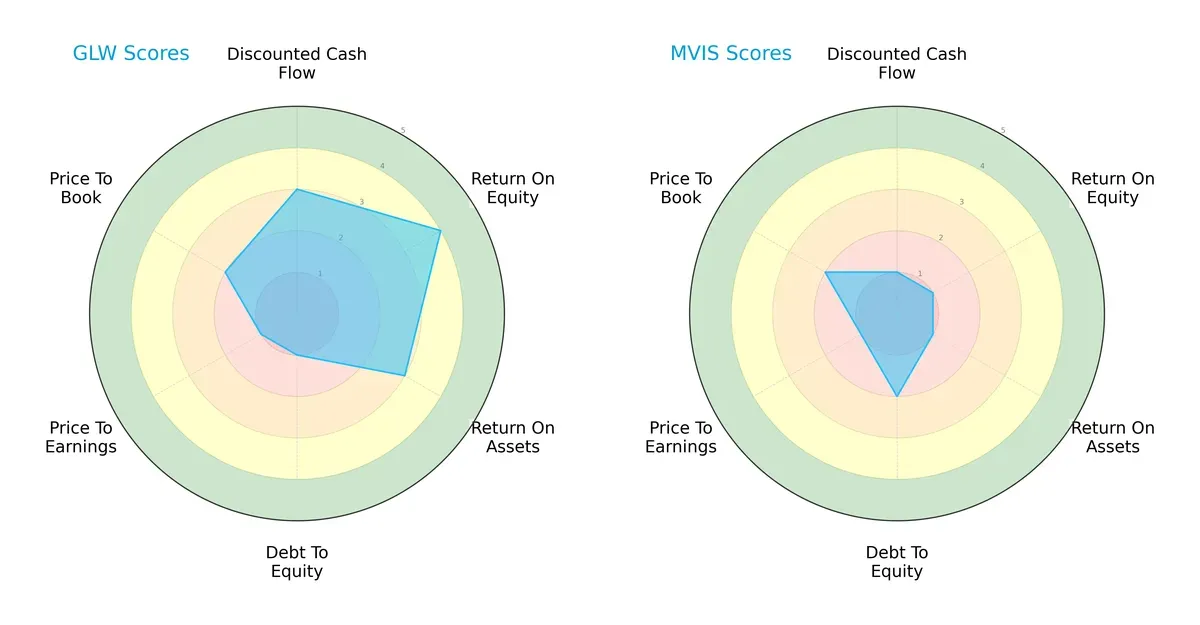
Corning demonstrates a balanced profile with moderate to favorable scores in DCF (3), ROE (4), and ROA (3). However, it struggles with a weak debt-to-equity (1) and valuation metrics (PE 1, PB 2). MicroVision relies heavily on its slightly better debt-to-equity score (2) but suffers across all profitability and valuation scores, signaling a one-dimensional risk profile.
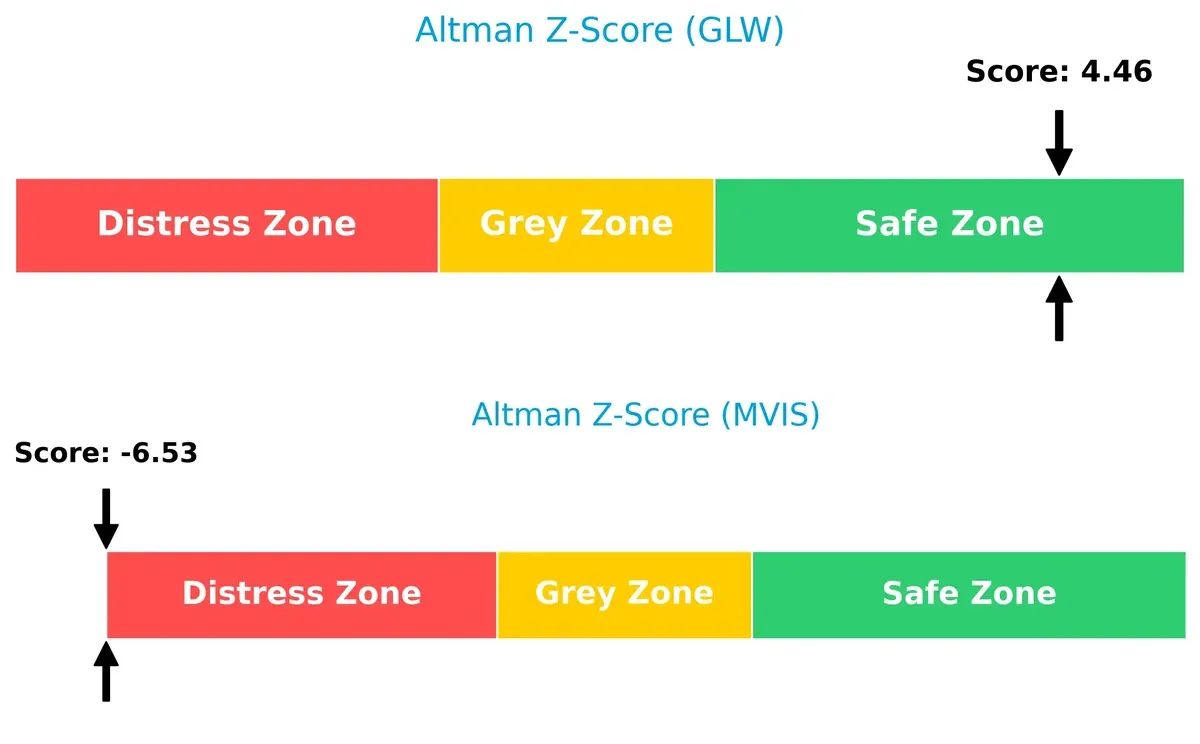
Bankruptcy Risk: Solvency Showdown
Corning’s Altman Z-Score of 4.46 places it firmly in the safe zone, while MicroVision’s -6.53 signals severe distress. This gap implies that Corning is far more likely to withstand economic downturns, whereas MicroVision faces high bankruptcy risk:
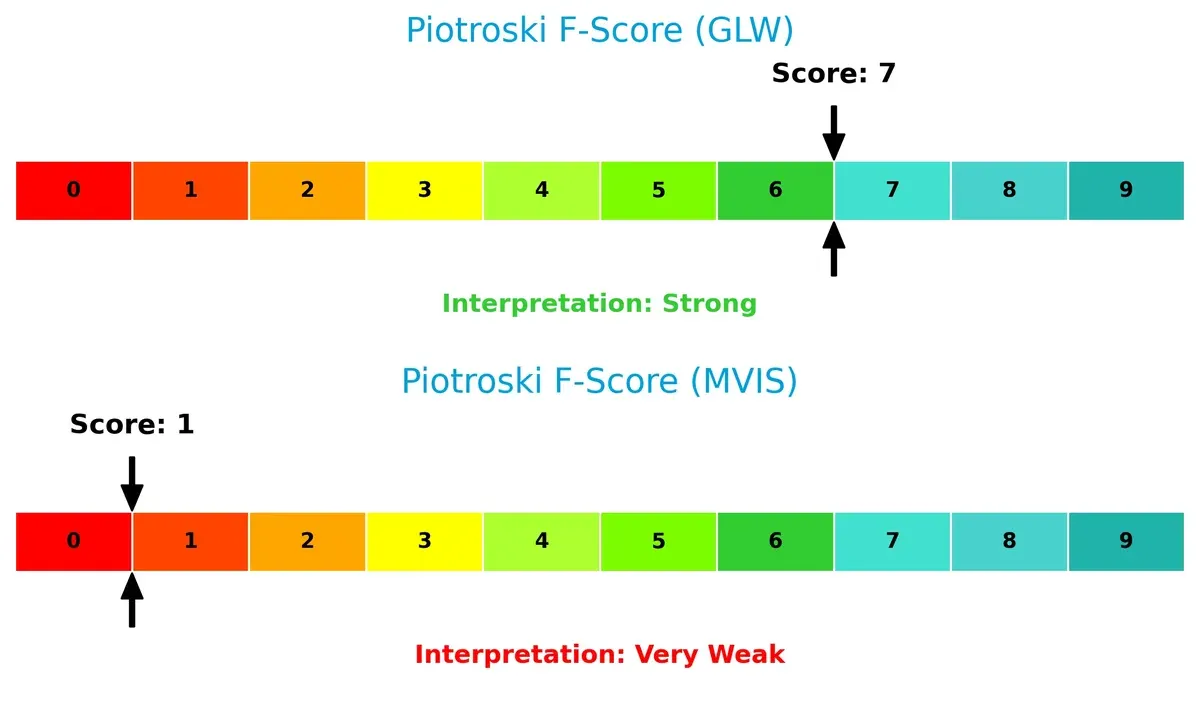
Financial Health: Quality of Operations
Corning’s Piotroski F-Score of 7 indicates strong financial health and operational quality. In contrast, MicroVision’s score of 1 raises red flags, reflecting poor profitability, liquidity, and efficiency metrics:
How are the two companies positioned?
This section dissects the operational DNA of Corning and MicroVision by comparing their revenue distribution and internal strengths and weaknesses. The goal is to confront their economic moats to identify which business model delivers the most resilient and sustainable competitive advantage today.
Revenue Segmentation: The Strategic Mix
This visual comparison dissects how Corning Incorporated and MicroVision, Inc. diversify their income streams and highlights where their primary sector bets lie:
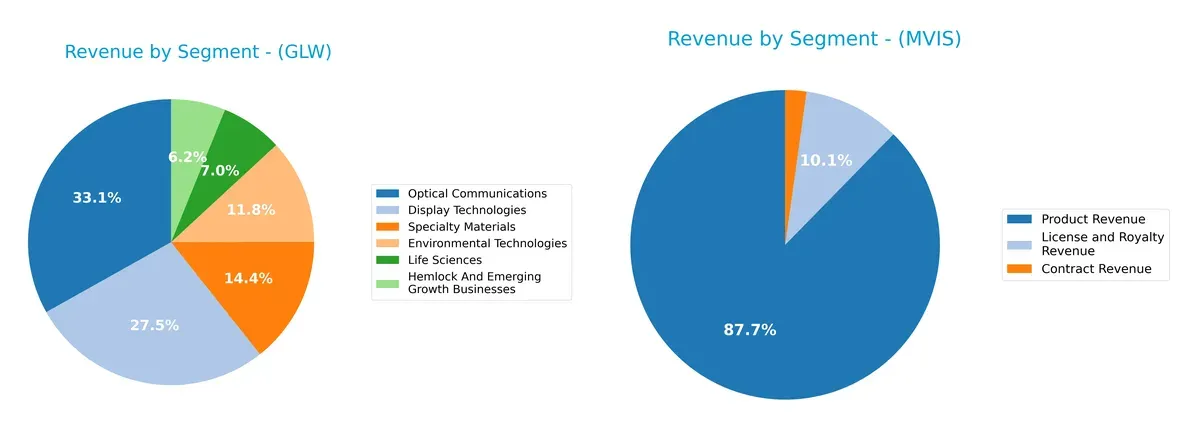
Corning exhibits a highly diversified revenue mix, with Optical Communications ($4.66B) and Display Technologies ($3.87B) anchoring its portfolio alongside Specialty Materials and Environmental Technologies. In contrast, MicroVision relies heavily on Product Revenue ($4.12M) with smaller License and Contract streams, reflecting concentration risk. Corning’s broad ecosystem reduces volatility, while MicroVision’s narrower focus amplifies dependency on few revenue sources and execution success.
Strengths and Weaknesses Comparison
This table compares the Strengths and Weaknesses of Corning Incorporated and MicroVision, Inc.:
Corning Incorporated Strengths
- Diversified revenue streams across multiple technology segments
- Favorable net margin at 10.21%
- Strong current and quick ratios above 1.0
- Favorable debt-to-assets at 27.23%
- Global presence with over 7.3B revenue in Asia Pacific
MicroVision, Inc. Strengths
- Favorable price-to-earnings ratio
- Strong current and quick ratios indicating liquidity
- License and royalty revenue provides recurring income
Corning Incorporated Weaknesses
- High price-to-book ratio at 6.38 signals overvaluation risk
- ROIC below WACC at 7.4% vs. 8.56%
- Neutral return on equity at 13.52%
- Asset turnover is moderate at 0.5
MicroVision, Inc. Weaknesses
- Severely negative net margin and ROE indicate heavy losses
- High debt-to-equity at 1.06 increases financial risk
- Poor interest coverage ratio at -16.87
- Very low asset turnover at 0.04 and fixed asset turnover at 0.2
- No dividend yield and unfavorable PB ratio
Corning demonstrates robust diversification, profitability, and global scale, supporting stable operations. MicroVision faces significant profitability and efficiency challenges, reflecting operational risks and financial strain. This contrast affects each company’s strategic options and risk profile.
The Moat Duel: Analyzing Competitive Defensibility
A structural moat is the only true defense against profit erosion from competition’s relentless advances. Let’s dissect the core moats of two tech players:
Corning Incorporated: Intangible Assets and Scale Moat
Corning’s primary moat lies in its deep intangible assets and scale in specialty glass technologies. Its stable 35% gross margin confirms pricing power. Expansion in Asia Pacific should deepen this moat in 2026.
MicroVision, Inc.: Emerging Tech Innovation Moat
MicroVision’s moat centers on novel lidar and scanning tech, contrasted with Corning’s scale. Despite negative margins, improving ROIC signals potential. Success in AR markets could unlock disruptive growth.
Moat Battle: Intangible Scale vs. Innovation Frontier
Corning commands a wider moat with established scale and stable margins. MicroVision’s moat is narrower but shows promise via innovation-driven ROIC growth. Corning remains better equipped to defend market share today.
Which stock offers better returns?
Stock prices for Corning Incorporated and MicroVision, Inc. have shown starkly contrasting trajectories over the past 12 months, reflecting divergent investor sentiment and market dynamics.
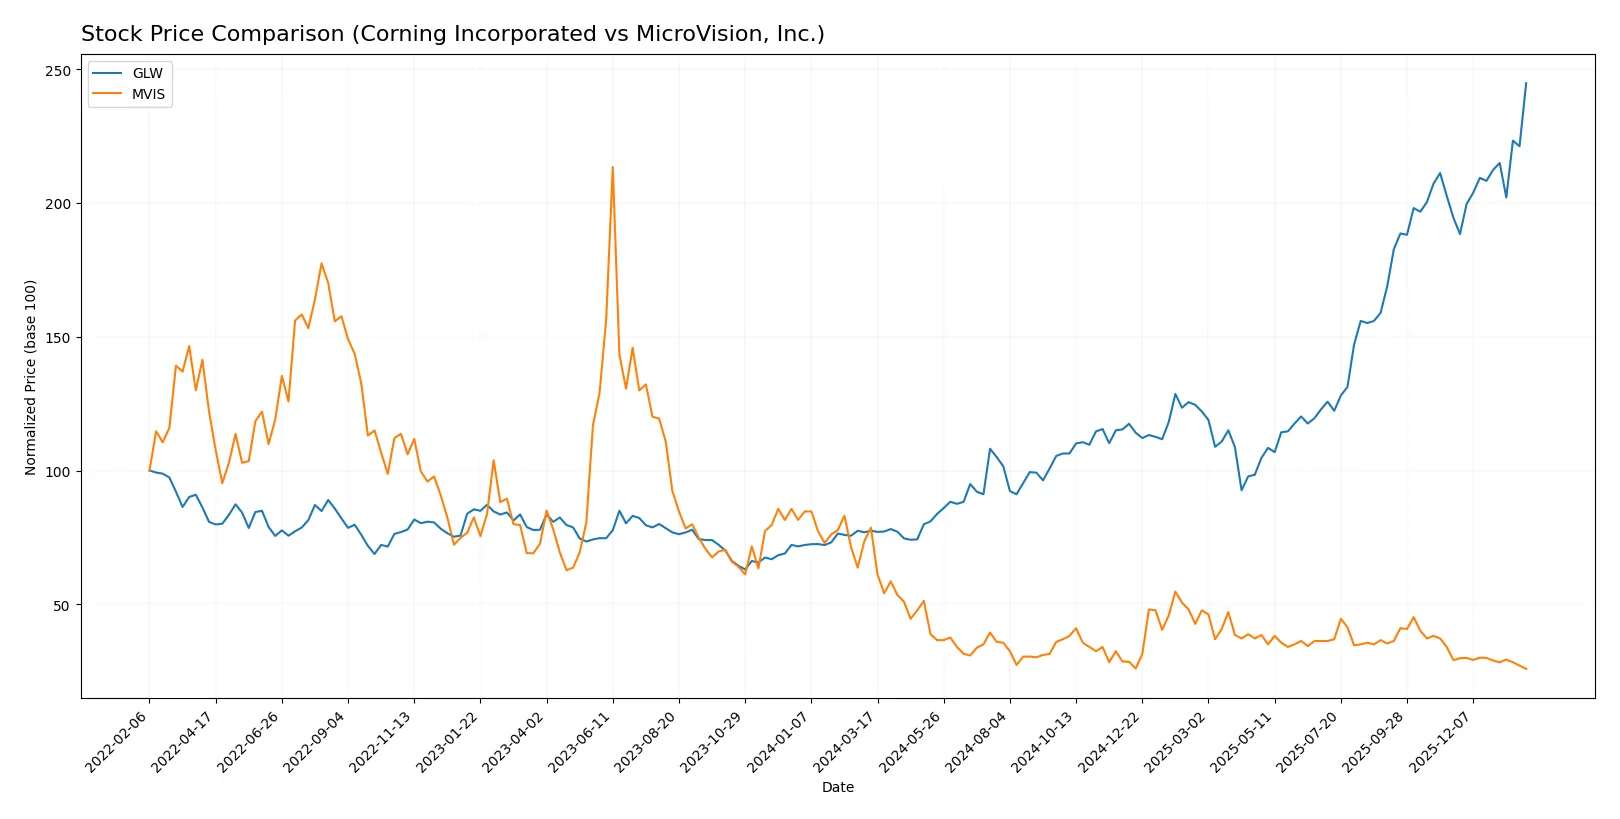
Trend Comparison
Corning Incorporated’s stock price surged 215.65% over the past year, demonstrating a strong bullish trend with accelerating momentum and significant volatility, peaking at 103.25 and bottoming at 31.27.
MicroVision, Inc. experienced a 67.1% decline over the same period, marking a bearish trend with decelerating losses and minimal volatility, ranging from a high of 2.47 to a low of 0.81.
Corning’s performance clearly outpaces MicroVision’s, delivering the highest market returns amid accelerating upward momentum, while MicroVision continues a downward trajectory.
Target Prices
Analyst consensus shows a moderate upside for Corning Incorporated and a steady valuation for MicroVision, Inc.
| Company | Target Low | Target High | Consensus |
|---|---|---|---|
| Corning Incorporated | 100 | 130 | 116.63 |
| MicroVision, Inc. | 5 | 5 | 5 |
Corning’s target consensus at 116.63 suggests roughly 13% upside from its current 103.25 price. MicroVision’s consensus of 5 implies significant upside from 0.81, but this reflects high volatility and risk.

Don’t Let Luck Decide Your Entry Point
Optimize your entry points with our advanced ProRealTime indicators. You’ll get efficient buy signals with precise price targets for maximum performance. Start outperforming now!
How do institutions grade them?
This section reviews the latest institutional grades assigned to Corning Incorporated and MicroVision, Inc.:
Corning Incorporated Grades
Here are the recent grades from reputable financial institutions for Corning Incorporated:
| Grading Company | Action | New Grade | Date |
|---|---|---|---|
| Morgan Stanley | maintain | Equal Weight | 2026-01-29 |
| Mizuho | maintain | Outperform | 2026-01-29 |
| Citigroup | maintain | Buy | 2026-01-29 |
| Susquehanna | maintain | Positive | 2026-01-29 |
| JP Morgan | maintain | Overweight | 2026-01-28 |
| Citigroup | maintain | Buy | 2026-01-12 |
| Morgan Stanley | maintain | Equal Weight | 2025-12-17 |
| UBS | maintain | Buy | 2025-11-21 |
| Citigroup | maintain | Buy | 2025-10-29 |
| JP Morgan | maintain | Overweight | 2025-10-29 |
MicroVision, Inc. Grades
Below are the latest grades from recognized grading firms for MicroVision, Inc.:
| Grading Company | Action | New Grade | Date |
|---|---|---|---|
| D. Boral Capital | maintain | Buy | 2026-01-27 |
| D. Boral Capital | maintain | Buy | 2025-12-16 |
| D. Boral Capital | maintain | Buy | 2025-11-12 |
| WestPark Capital | maintain | Buy | 2025-10-21 |
| WestPark Capital | maintain | Buy | 2025-09-05 |
| D. Boral Capital | maintain | Buy | 2025-09-02 |
| WestPark Capital | maintain | Buy | 2025-08-27 |
| D. Boral Capital | maintain | Buy | 2025-08-11 |
| D. Boral Capital | maintain | Buy | 2025-05-21 |
| D. Boral Capital | maintain | Buy | 2025-05-13 |
Which company has the best grades?
MicroVision, Inc. consistently receives “Buy” ratings from its grading firms. Corning Incorporated’s grades range from “Equal Weight” to “Buy” and “Outperform.” MicroVision’s uniformly positive grades may signal stronger institutional conviction, potentially influencing investor confidence.
Risks specific to each company
The following categories identify the critical pressure points and systemic threats facing both firms in the 2026 market environment:
1. Market & Competition
Corning Incorporated
- Established technology leader with diversified product lines faces intense competition in hardware segments.
MicroVision, Inc.
- Small player in lidar and AR, competing against large, well-funded rivals in emerging technologies.
2. Capital Structure & Debt
Corning Incorporated
- Moderate debt-to-equity ratio (0.71) with strong interest coverage (7.11), indicating manageable leverage.
MicroVision, Inc.
- Higher debt-to-equity (1.06) and negative interest coverage (-16.87) signal significant financial strain.
3. Stock Volatility
Corning Incorporated
- Beta of 1.125 shows moderate sensitivity to market swings, typical for established tech firms.
MicroVision, Inc.
- Beta of 1.274 indicates higher volatility, consistent with its smaller size and speculative nature.
4. Regulatory & Legal
Corning Incorporated
- Operates globally in regulated sectors like emissions control; regulatory compliance is complex but manageable.
MicroVision, Inc.
- Emerging tech in lidar and AR may face evolving regulatory scrutiny, especially around autonomous vehicles and privacy.
5. Supply Chain & Operations
Corning Incorporated
- Large scale and diversified supply chain reduce risk but expose the company to global disruptions.
MicroVision, Inc.
- Smaller scale and reliance on specialized components increase vulnerability to supply chain interruptions.
6. ESG & Climate Transition
Corning Incorporated
- Environmental technologies segment supports ESG goals, but legacy manufacturing processes may pose challenges.
MicroVision, Inc.
- Limited ESG footprint due to smaller size, but innovation in autonomous and AR tech aligns with sustainability trends.
7. Geopolitical Exposure
Corning Incorporated
- Global footprint exposes it to risks from trade tensions and geopolitical instability, especially in Asia.
MicroVision, Inc.
- Primarily US-based with less global reach, but still exposed to supply chain risks linked to global tech components.
Which company shows a better risk-adjusted profile?
Corning’s biggest risk lies in navigating global competition and geopolitical headwinds, yet its diversified operations and solid financial health provide resilience. MicroVision faces critical financial distress and operational risks amid volatile markets. Corning clearly shows a superior risk-adjusted profile supported by a strong Altman Z-Score (4.46) and Piotroski score (7). MicroVision’s distress zone Z-score (-6.53) and very weak Piotroski score (1) confirm its precarious position. The substantial negative margins and poor interest coverage at MicroVision underscore urgent financial vulnerabilities, while Corning’s stable liquidity and moderate leverage bolster confidence.
Final Verdict: Which stock to choose?
Corning Incorporated’s superpower lies in its robust operational execution and improving profitability trends. Its slightly unfavorable moat position signals a need for vigilance on capital efficiency. This stock fits well in portfolios seeking steady, industrial growth with moderate risk tolerance.
MicroVision, Inc. offers a strategic moat through its cutting-edge R&D focus, hinting at disruptive potential despite current financial instability. It presents a higher risk profile but might appeal to investors prioritizing innovation and early-stage growth opportunities, suiting aggressive or speculative portfolios.
If you prioritize consistent operational strength and income stability, Corning Incorporated outshines as the compelling choice due to its favorable income trends and financial safety. However, if you seek high-risk, high-reward innovation plays, MicroVision could offer superior growth potential but demands tolerance for volatility and value destruction.
Disclaimer: Investment carries a risk of loss of initial capital. The past performance is not a reliable indicator of future results. Be sure to understand risks before making an investment decision.
Go Further
I encourage you to read the complete analyses of Corning Incorporated and MicroVision, Inc. to enhance your investment decisions: