Home > Comparison > Technology > GLW vs MLAB
The competitive dynamic between Corning Incorporated and Mesa Laboratories, Inc. shapes key advances in the Technology sector’s Hardware, Equipment & Parts industry. Corning operates as a diversified industrial leader with a broad global footprint and extensive product lines. Mesa focuses on specialized life sciences quality control and calibration tools, emphasizing niche innovation. This analysis will assess which company’s strategic path delivers superior risk-adjusted returns for a balanced, growth-oriented portfolio.

Table of contents
Companies Overview
Corning Incorporated and Mesa Laboratories, Inc. both play vital roles in the hardware and equipment sector, shaping technology markets with distinct approaches.
Corning Incorporated: Leader in Advanced Materials and Optical Solutions
Corning dominates in display technologies and optical communications, generating revenue through glass substrates for LCDs and organic LEDs. Its strategic focus in 2026 centers on expanding specialty materials and environmental technologies, targeting innovation in glass ceramics and emission control products. This diversified portfolio supports Corning’s robust position in mobile electronics and telecommunications.
Mesa Laboratories, Inc.: Specialist in Life Sciences Tools and Calibration Services
Mesa Laboratories excels in life sciences equipment and quality control products, deriving revenue from sterilization indicators, biopharmaceutical analysis systems, and calibration solutions. In 2026, the company prioritizes growth in clinical genomics and automated peptide synthesis, aiming to enhance its foothold in medical device testing and genomic clinical testing markets, reflecting a niche but critical industry focus.
Strategic Collision: Similarities & Divergences
Corning pursues a broad, innovation-driven strategy spanning multiple industries, while Mesa focuses on specialized life sciences tools. Their competition overlaps in precision hardware markets, but their business philosophies diverge—Corning operates a diversified materials ecosystem, Mesa targets calibrated niche solutions. This distinction creates contrasting investment profiles: Corning offers scale and diversity; Mesa presents targeted growth with a narrower scope.
Income Statement Comparison
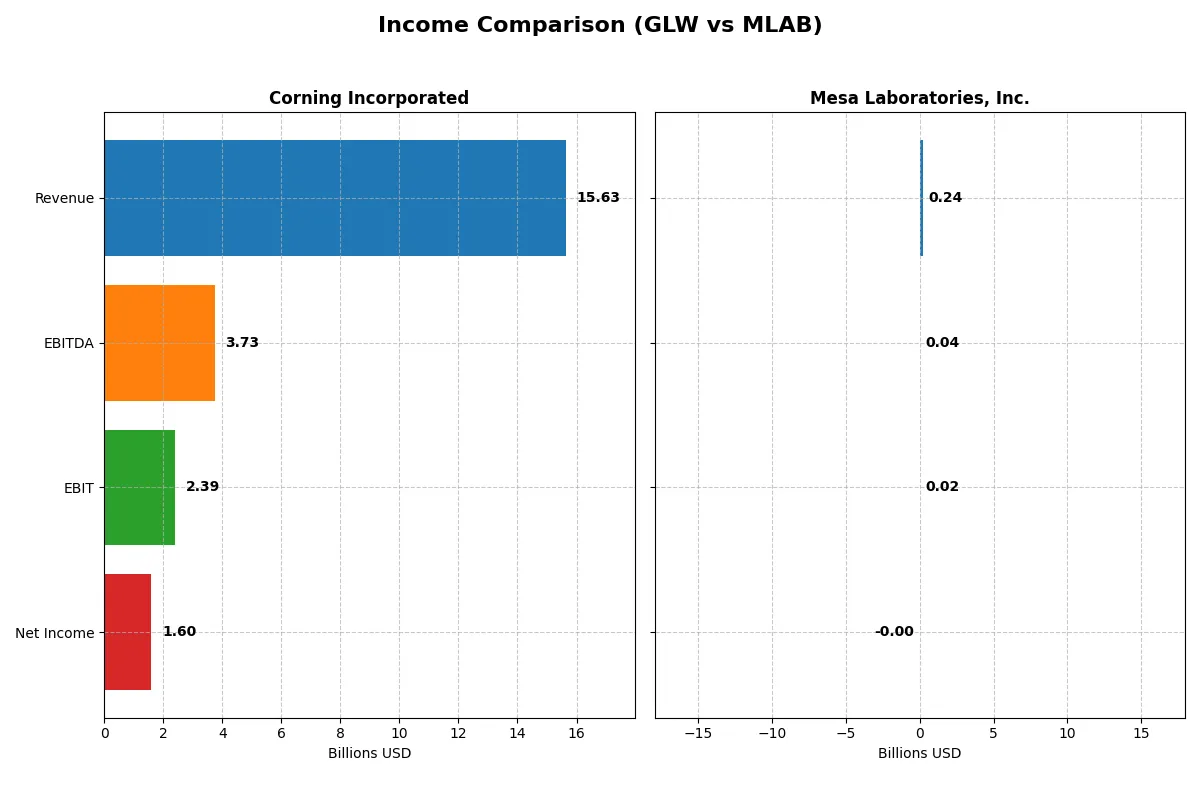
This data dissects the core profitability and scalability of both corporate engines to reveal who dominates the bottom line:
| Metric | Corning Incorporated (GLW) | Mesa Laboratories, Inc. (MLAB) |
|---|---|---|
| Revenue | 15.6B | 241M |
| Cost of Revenue | 10.1B | 90.1M |
| Operating Expenses | 3.18B | 135M |
| Gross Profit | 5.51B | 151M |
| EBITDA | 3.74B | 42.3M |
| EBIT | 2.39B | 17.8M |
| Interest Expense | 336M | 11.9M |
| Net Income | 1.60B | -1.97M |
| EPS | 1.86 | -0.36 |
| Fiscal Year | 2025 | 2025 |
Income Statement Analysis: The Bottom-Line Duel
This income statement comparison reveals which company converts revenue into profits most efficiently, showing true operational strength.
Corning Incorporated Analysis
Corning’s revenue rose steadily from $14.1B in 2021 to $15.6B in 2025, reflecting consistent top-line growth. Net income fluctuated, peaking at $1.9B in 2021, dipping, then rebounding to $1.6B in 2025. Gross and net margins remain healthy at 35.3% and 10.2%, respectively, signaling solid cost control and improving profitability momentum in 2025.
Mesa Laboratories, Inc. Analysis
Mesa’s revenue climbed from $134M in 2021 to $241M in 2025, showing robust growth for a small-cap. Gross margin stays strong at 62.6%, but net margin is negative at -0.8%, reflecting recent losses despite improved EBIT margin around 7.4%. The firm posted a net loss of $2M in 2025, though it shows signs of recovering operational efficiency over the past year.
Margin Strength vs. Revenue Scale
Corning dominates in scale and sustained profitability with favorable margins and a $15.6B revenue base, while Mesa struggles with net losses despite higher gross margins. Corning’s consistent net income and margin recovery mark it as the fundamentally stronger business. Investors seeking stability and efficiency will find Corning’s profile more compelling.
Financial Ratios Comparison
These vital ratios act as a diagnostic tool to expose the underlying fiscal health, valuation premiums, and capital efficiency of the companies compared below:
| Ratios | Corning Incorporated (GLW) | Mesa Laboratories, Inc. (MLAB) |
|---|---|---|
| ROE | 13.52% | -1.24% |
| ROIC | 7.40% | -1.45% |
| P/E | 47.18 | -326.35 |
| P/B | 6.38 | 4.03 |
| Current Ratio | 1.59 | 0.63 |
| Quick Ratio | 1.04 | 0.47 |
| D/E (Debt to Equity) | 0.71 | 1.14 |
| Debt-to-Assets | 27.23% | 41.88% |
| Interest Coverage | 6.78 | 1.38 |
| Asset Turnover | 0.50 | 0.56 |
| Fixed Asset Turnover | 1.05 | 7.45 |
| Payout ratio | 62.59% | -175.68% |
| Dividend yield | 1.33% | 0.54% |
| Fiscal Year | 2025 | 2025 |
Efficiency & Valuation Duel: The Vital Signs
Financial ratios act as a company’s DNA, uncovering hidden risks and signaling operational excellence behind the numbers.
Corning Incorporated
Corning delivers a solid 13.5% ROE with a favorable 10.2% net margin, reflecting consistent profitability. However, its valuation appears stretched, marked by a high 47.2 P/E and a 6.4 price-to-book ratio. The firm returns value to shareholders through a modest 1.33% dividend yield, balancing payout with reinvestment in R&D at over 7% of revenue.
Mesa Laboratories, Inc.
Mesa struggles with negative profitability metrics, including a -1.2% ROE and -0.8% net margin, indicating operational challenges. Despite a favorable P/E due to losses, the stock suffers from a weak current ratio of 0.63 and a high debt-to-equity ratio of 1.14. The company provides a low 0.54% dividend yield, focusing on growth via R&D spending near 8%.
Premium Valuation vs. Operational Strain
Corning offers a more balanced risk-reward profile with stable profitability and conservative leverage, though at a premium valuation. Mesa’s financial weakness and liquidity concerns elevate risk despite its growth focus. Investors seeking operational safety may prefer Corning, while those tolerating risk for turnaround potential might consider Mesa.
Which one offers the Superior Shareholder Reward?
Corning (GLW) delivers a 1.33% dividend yield with a 63% payout ratio, backed by steady free cash flow of 1.64/share and moderate buybacks, reflecting sustainable shareholder returns. Mesa Laboratories (MLAB) pays a scant 0.54% yield with a negative net margin but maintains robust free cash flow of 7.79/share and a strong buyback focus. I see Corning’s balanced dividend and buyback approach as more sustainable for long-term total return in 2026.
Comparative Score Analysis: The Strategic Profile
The radar chart reveals the fundamental DNA and trade-offs of Corning Incorporated and Mesa Laboratories, Inc., highlighting their distinct financial strengths and weaknesses:
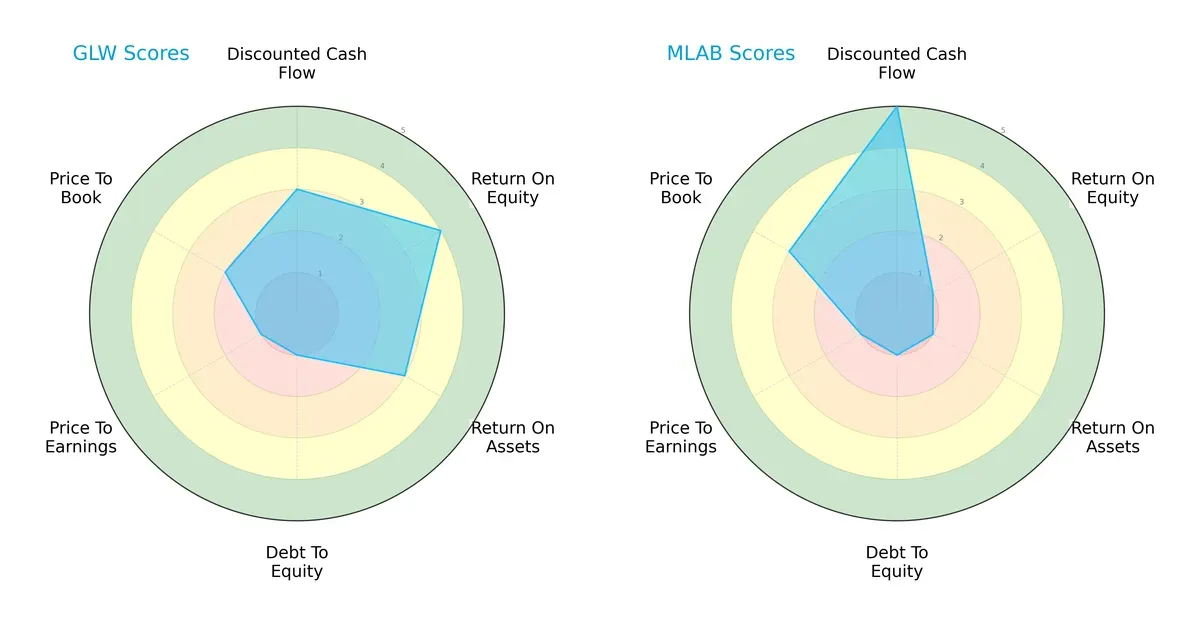
Corning shows balanced efficiency with moderate DCF (3), ROE (4), and ROA (3) scores but struggles with leverage and valuation (Debt/Equity 1, P/E 1). Mesa excels in DCF (5) and P/B (3), signaling strong cash flow and moderate valuation, yet it underperforms in ROE (1), ROA (1), and also suffers from weak debt management (1). Corning’s profile is more balanced, while Mesa relies heavily on its cash flow advantage.
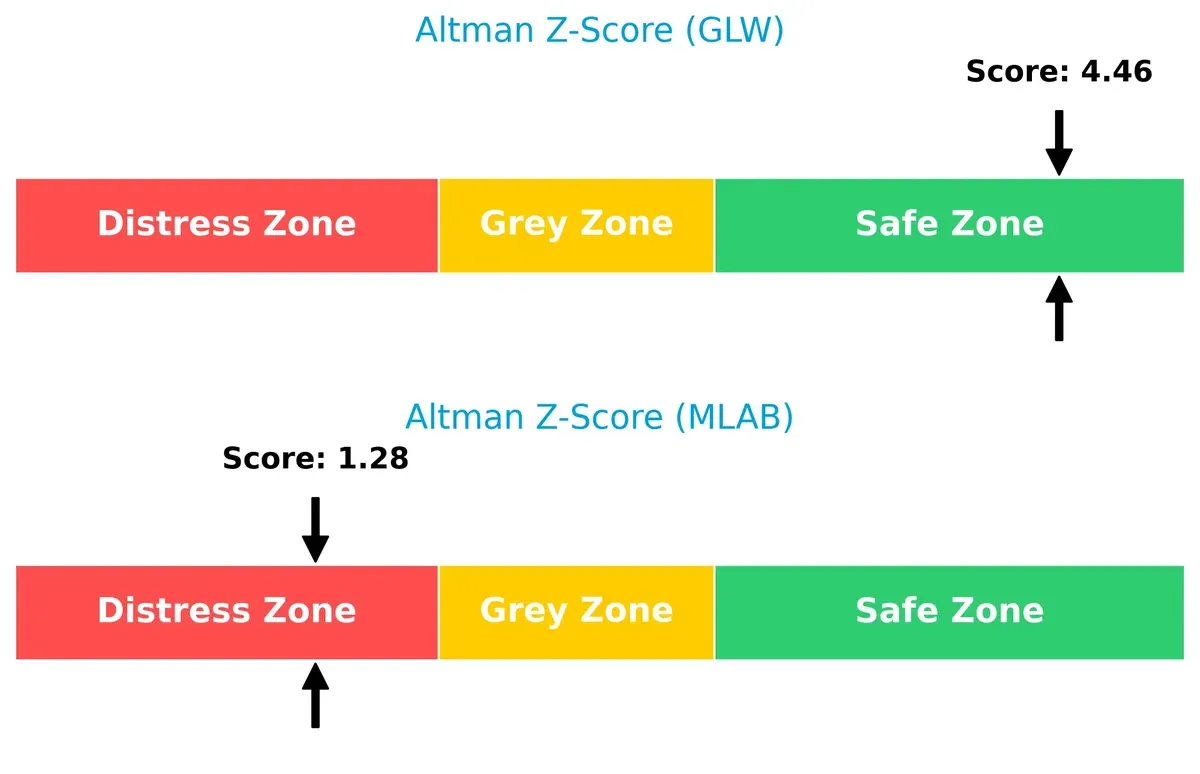
Bankruptcy Risk: Solvency Showdown
Corning’s Altman Z-Score of 4.46 places it firmly in the safe zone, indicating strong long-term solvency. Mesa’s score of 1.28 signals distress risk, raising concerns about its survival prospects in this cycle:
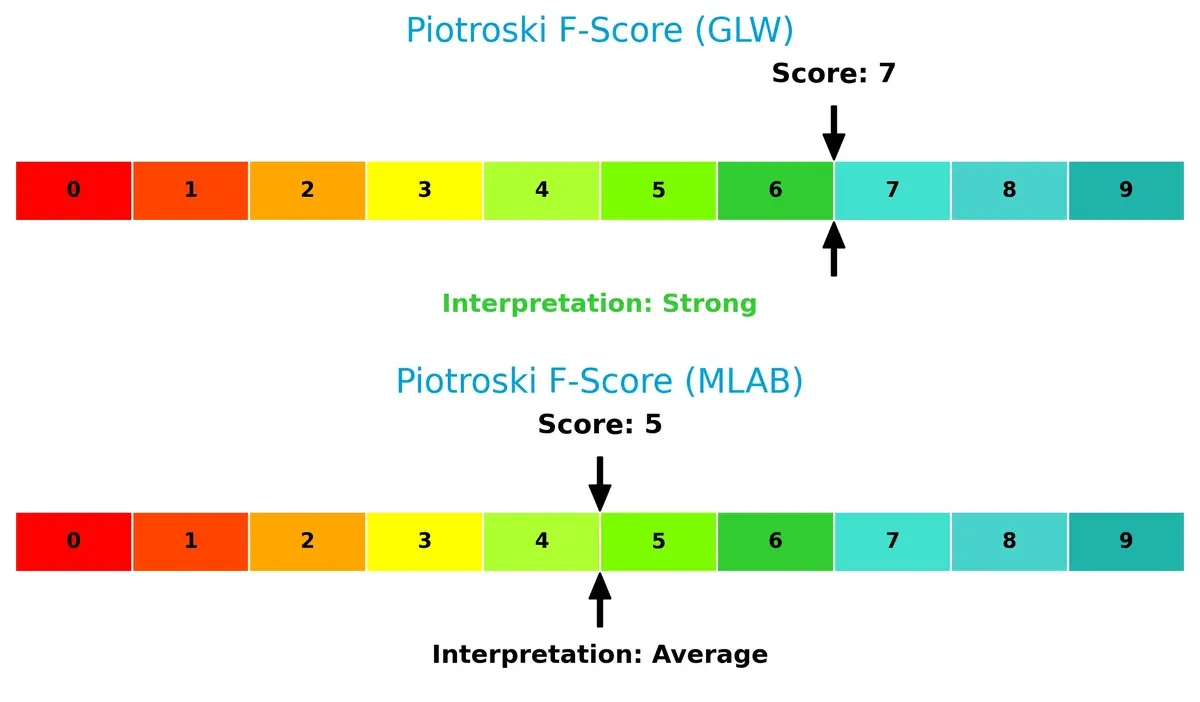
Financial Health: Quality of Operations
Corning’s Piotroski F-Score of 7 reflects strong financial health and operational quality. Mesa’s lower score of 5 suggests average strength, with potential red flags in internal metrics compared to Corning:
How are the two companies positioned?
This section dissects Corning and Mesa Laboratories’ operational DNA by comparing their revenue distribution and internal dynamics. The goal is to confront their economic moats and identify which model delivers the most resilient competitive advantage today.
Revenue Segmentation: The Strategic Mix
This visual comparison dissects how Corning Incorporated and Mesa Laboratories diversify their income streams and where their primary sector bets lie:
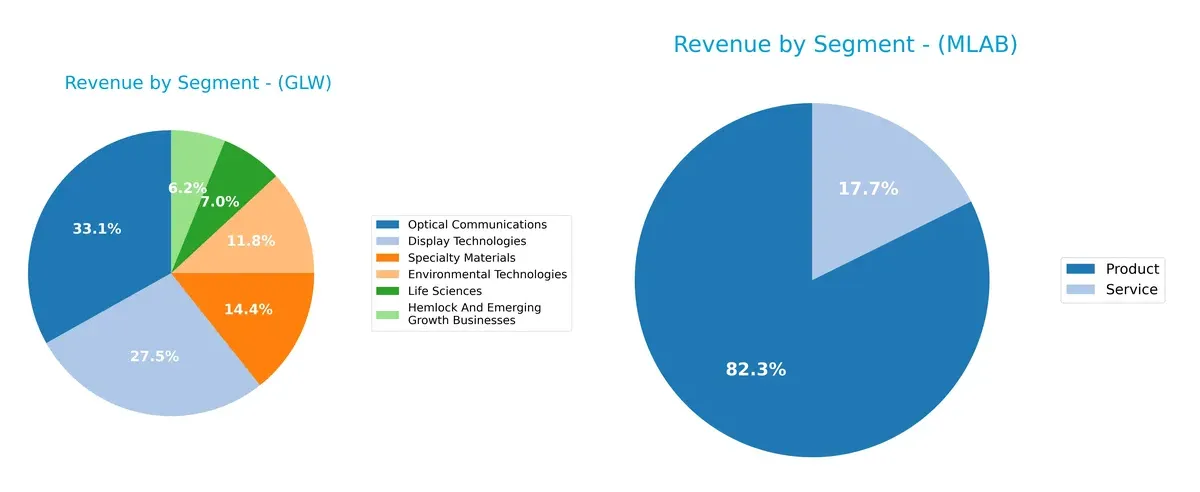
Corning dominates with a broad portfolio: Optical Communications leads at $4.66B, followed closely by Display Technologies at $3.87B. Mesa Laboratories pivots heavily on a single segment—Product sales at $198M—while its 2024 detailed breakdown shows more balanced sub-segments below $75M each. Corning’s diversified mix fuels resilience and ecosystem lock-in, whereas Mesa faces concentration risk but benefits from focused niche dominance.
Strengths and Weaknesses Comparison
This table compares the Strengths and Weaknesses of Corning Incorporated and Mesa Laboratories, Inc.:
Corning Strengths
- Diversified product segments with strong revenues in Optical Communications and Display Technologies
- Favorable net margin at 10.21% indicates profitability
- Solid liquidity with current ratio 1.59 and quick ratio 1.04
- Low debt-to-assets at 27.23% supports financial stability
- Global presence with strong Asia Pacific and North America sales
Mesa Laboratories Strengths
- Favorable WACC at 6.56% reflects low capital cost
- High fixed asset turnover at 7.45 signals efficient asset use
- Some P/E metrics favorable despite losses
- Expanding product and service segments with increasing revenues
- U.S. market dominance with consistent revenue above 100M USD
Corning Weaknesses
- High P/E ratio at 47.18 and P/B at 6.38 imply overvaluation risk
- Neutral ROE and ROIC suggest moderate capital efficiency
- Moderate asset turnover at 0.5 limits growth leverage
- Dividend yield low at 1.33% may deter income investors
Mesa Laboratories Weaknesses
- Negative net margin (-0.82%) and ROE (-1.24%) indicate losses
- Weak liquidity ratios with current ratio 0.63 and quick ratio 0.47
- High debt-to-equity at 1.14 increases financial risk
- Interest coverage low at 1.5 raises solvency concerns
- Dividend yield at 0.54% and unfavorable P/B point to valuation challenges
Corning’s strengths lie in its diversified, global operations and solid profitability, supporting resilience in market cycles. Mesa faces profitability and liquidity headwinds despite efficient asset use and some growth in product lines, which poses strategic challenges.
The Moat Duel: Analyzing Competitive Defensibility
A structural moat is the only reliable barrier protecting long-term profits from relentless competition erosion. Let’s dissect the competitive moats of Corning and Mesa Laboratories:
Corning Incorporated: Intangible Assets and Scale Economies
Corning’s moat stems from its proprietary glass technologies and scale advantages. This reflects in stable 35% gross margins and improving profitability despite ROIC slightly below WACC. Expansion in specialty materials and optical communications could strengthen its moat in 2026.
Mesa Laboratories, Inc.: Niche Product Specialization
Mesa’s moat relies on specialized life sciences tools and calibration products. Unlike Corning, Mesa suffers from declining ROIC and negative net margins despite high gross margins. Its narrow niche provides some defense but faces risks from innovation and scale limitations.
Verdict: Proprietary Technology vs. Niche Specialization
Corning’s intangible asset-driven moat is broader and more durable, supported by improving operational efficiency and global scale. Mesa’s niche focus is narrower, with weakening capital returns. Corning is better positioned to defend market share long term.
Which stock offers better returns?
Over the past 12 months, Corning Incorporated’s stock surged sharply, while Mesa Laboratories, Inc. showed a marked decline with recent modest recovery signs under mixed trading dynamics.
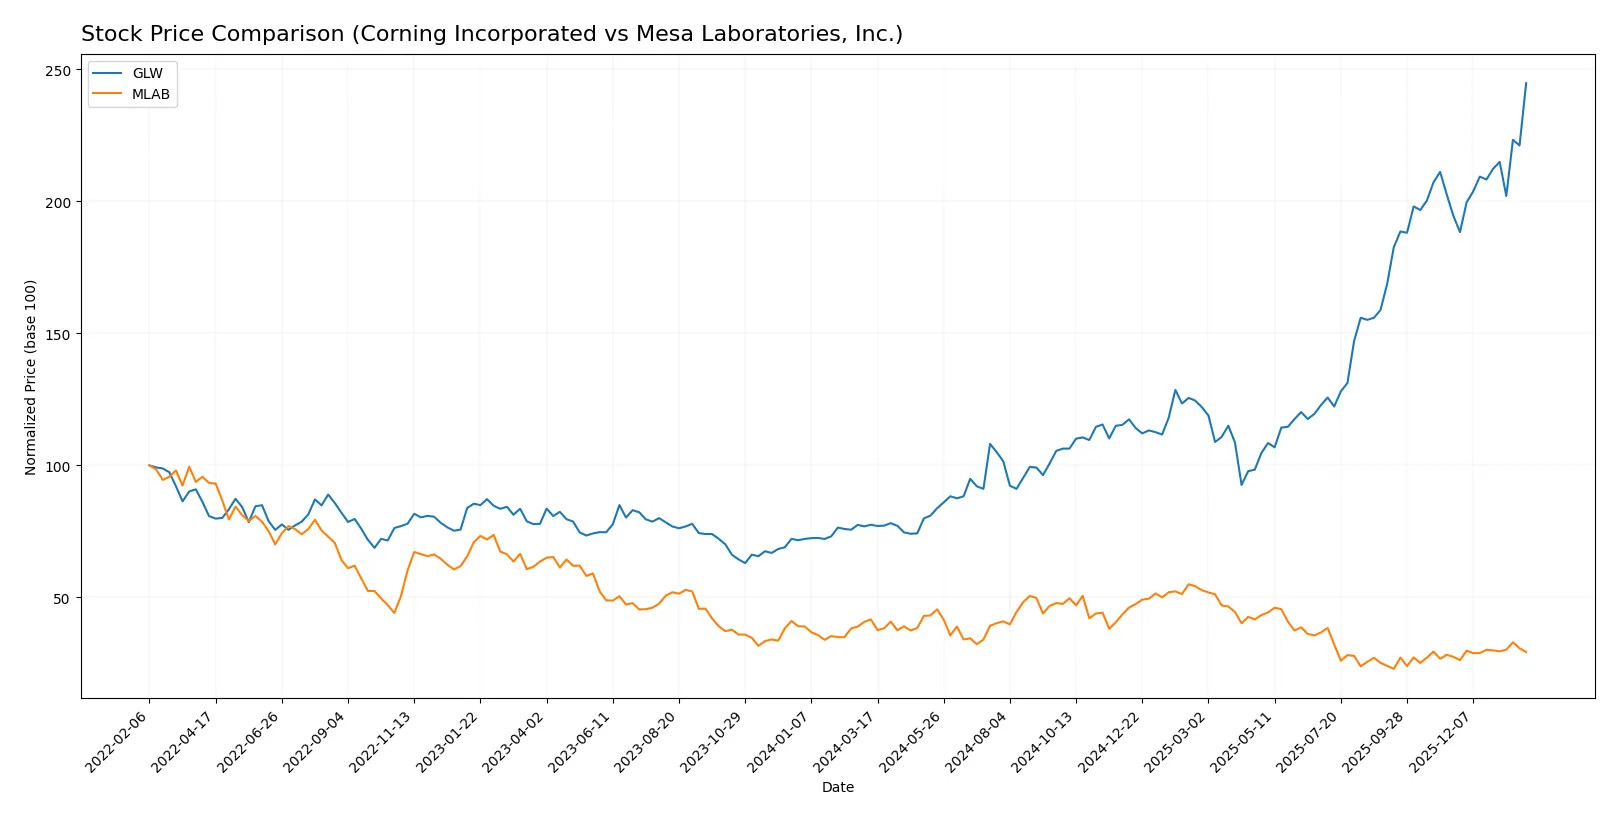
Trend Comparison
Corning Incorporated’s stock price rose 215.65% over the past year, indicating a strong bullish trend with accelerating momentum and notable volatility (std dev 18.43). The price ranged from 31.27 to 103.25.
Mesa Laboratories, Inc. experienced a 29.68% decline over the same period, confirming a bearish trend despite recent acceleration and moderate volatility (std dev 23.47). Prices fluctuated between 61.66 and 147.79.
Comparing both, Corning’s stock clearly outperformed Mesa’s with a substantial positive return versus a significant loss over the past year.
Target Prices
Analysts project moderate upside for Corning Incorporated and Mesa Laboratories, reflecting cautious optimism in hardware and life sciences segments.
| Company | Target Low | Target High | Consensus |
|---|---|---|---|
| Corning Incorporated | 100 | 130 | 116.63 |
| Mesa Laboratories, Inc. | 83 | 83 | 83 |
Corning’s target consensus of $116.63 implies roughly 13% upside from the current $103.25 price. Mesa Laboratories’ fixed target at $83 suggests limited near-term price movement versus its $78.76 stock price.

Don’t Let Luck Decide Your Entry Point
Optimize your entry points with our advanced ProRealTime indicators. You’ll get efficient buy signals with precise price targets for maximum performance. Start outperforming now!
How do institutions grade them?
Corning Incorporated Grades
The following table shows recent institutional grades for Corning Incorporated.
| Grading Company | Action | New Grade | Date |
|---|---|---|---|
| Morgan Stanley | maintain | Equal Weight | 2026-01-29 |
| Mizuho | maintain | Outperform | 2026-01-29 |
| Citigroup | maintain | Buy | 2026-01-29 |
| Susquehanna | maintain | Positive | 2026-01-29 |
| JP Morgan | maintain | Overweight | 2026-01-28 |
| Citigroup | maintain | Buy | 2026-01-12 |
| Morgan Stanley | maintain | Equal Weight | 2025-12-17 |
| UBS | maintain | Buy | 2025-11-21 |
| Citigroup | maintain | Buy | 2025-10-29 |
| JP Morgan | maintain | Overweight | 2025-10-29 |
Mesa Laboratories, Inc. Grades
The following table shows recent institutional grades for Mesa Laboratories, Inc.
| Grading Company | Action | New Grade | Date |
|---|---|---|---|
| Wells Fargo | maintain | Equal Weight | 2025-12-15 |
| Wells Fargo | upgrade | Equal Weight | 2025-08-08 |
| Wells Fargo | maintain | Underweight | 2025-05-30 |
| Evercore ISI Group | maintain | Outperform | 2024-10-01 |
| Evercore ISI Group | maintain | Outperform | 2024-08-06 |
| Evercore ISI Group | maintain | Outperform | 2024-07-02 |
| Evercore ISI Group | maintain | Outperform | 2024-04-04 |
| Evercore ISI Group | upgrade | Outperform | 2024-01-04 |
| Evercore ISI Group | downgrade | In Line | 2021-01-04 |
| Evercore ISI Group | downgrade | In Line | 2021-01-03 |
Which company has the best grades?
Corning Incorporated consistently receives strong Buy, Outperform, and Overweight grades from multiple top-tier firms. Mesa Laboratories shows mixed grades, with recent upgrades but also past downgrades. Investors may perceive Corning’s steadier positive ratings as a sign of broader institutional confidence.
Risks specific to each company
The following categories identify critical pressure points and systemic threats facing Corning Incorporated and Mesa Laboratories in the 2026 market environment:
1. Market & Competition
Corning Incorporated
- Operates globally in diversified tech segments, facing intense competition in display and optical markets.
Mesa Laboratories, Inc.
- Niche focus on life sciences tools with limited scale, vulnerable to specialized competitors and innovation cycles.
2. Capital Structure & Debt
Corning Incorporated
- Moderate leverage with D/E at 0.71 and strong interest coverage of 7.11, signaling manageable debt risk.
Mesa Laboratories, Inc.
- Higher leverage at D/E 1.14 and weak interest coverage of 1.5, increasing financial risk under stress.
3. Stock Volatility
Corning Incorporated
- Beta of 1.125 shows moderate market sensitivity typical of industrial tech firms.
Mesa Laboratories, Inc.
- Lower beta at 0.889 indicates less volatility but also potentially lower liquidity.
4. Regulatory & Legal
Corning Incorporated
- Exposure to environmental and safety regulations across multiple industries, requiring ongoing compliance investment.
Mesa Laboratories, Inc.
- Operates in heavily regulated life sciences sector, with potential for costly compliance and litigation risks.
5. Supply Chain & Operations
Corning Incorporated
- Complex global supply chain supporting multiple product lines, exposed to raw material and logistics disruptions.
Mesa Laboratories, Inc.
- Smaller scale and specialized supply needs may limit operational flexibility but reduce systemic supply risks.
6. ESG & Climate Transition
Corning Incorporated
- Faces pressure to innovate sustainable materials and reduce emissions in manufacturing processes.
Mesa Laboratories, Inc.
- ESG risks tied to chemical handling and product lifecycle in healthcare tools, requiring strict controls.
7. Geopolitical Exposure
Corning Incorporated
- Global footprint subjects it to trade tensions, tariffs, and geopolitical instability impacting supply chains.
Mesa Laboratories, Inc.
- Primarily US-based, with limited international exposure reducing geopolitical risk but limiting growth avenues.
Which company shows a better risk-adjusted profile?
Corning’s most impactful risk is intense market competition coupled with capital structure strength. Mesa Laboratories faces critical financial distress risks, notably weak liquidity and high leverage. Corning’s Altman Z-score at 4.46 signals strong financial health, while Mesa’s 1.28 indicates distress. Overall, Corning shows a superior risk-adjusted profile, supported by stable leverage and operational scale.
Final Verdict: Which stock to choose?
Corning Incorporated’s superpower lies in its resilient operational efficiency and robust cash generation. Its improving profitability trend signals a potential turnaround despite current value destruction. A point of vigilance is its elevated valuation multiples, which could pressure returns. It suits portfolios aiming for aggressive growth with a tolerance for premium pricing.
Mesa Laboratories commands a niche moat through specialized product offerings and recurring revenue streams, though its financial health is strained. Compared to Corning, it presents a riskier profile with declining profitability and liquidity challenges. It aligns with growth-at-a-reasonable-price (GARP) investors willing to navigate volatility for future payoff potential.
If you prioritize operational strength and improving profitability within a mature industry, Corning outshines with superior stability and cash flow quality. However, if you seek high-growth exposure in a niche market and can endure financial headwinds, Mesa offers a speculative yet differentiated growth story. Both paths require cautious monitoring of valuation and cash flow dynamics.
Disclaimer: Investment carries a risk of loss of initial capital. The past performance is not a reliable indicator of future results. Be sure to understand risks before making an investment decision.
Go Further
I encourage you to read the complete analyses of Corning Incorporated and Mesa Laboratories, Inc. to enhance your investment decisions: