Home > Comparison > Technology > GLW vs KEYS
The strategic rivalry between Corning Incorporated and Keysight Technologies defines the current trajectory of the Technology sector. Corning operates as a diversified hardware and specialty materials manufacturer with deep industrial roots. Keysight focuses on high-precision electronic design and test solutions, blending software with hardware innovation. This analysis pits capital-intensive manufacturing against advanced testing technology, aiming to identify which trajectory offers superior risk-adjusted returns for a diversified portfolio.
Table of contents
Companies Overview
Corning Incorporated and Keysight Technologies stand as significant players in the technology hardware sector, each commanding unique market niches.
Corning Incorporated: Pioneer in Specialty Glass and Optical Solutions
Corning Incorporated dominates the specialty materials and optical communications markets. Its revenue hinges on glass substrates for displays and advanced optical fibers, serving sectors from consumer electronics to aerospace. In 2026, Corning focuses strategically on expanding its life sciences and environmental technologies segments, aiming for innovation-driven growth in diversified industrial applications.
Keysight Technologies, Inc.: Leader in Electronic Design and Testing
Keysight Technologies excels in electronic design automation and advanced test solutions. It generates revenue by providing hardware and software for communications, aerospace, and semiconductor industries. In 2026, Keysight prioritizes enhancing its software platforms and network test capabilities, driving precision in digital transformation and emerging communication standards.
Strategic Collision: Similarities & Divergences
Both companies operate within hardware and equipment but diverge in business philosophy: Corning emphasizes materials innovation with a broad industry reach, while Keysight focuses on high-tech electronic testing and design tools. Their primary battleground lies in supporting next-gen technology infrastructure. Corning offers a diversified industrial profile; Keysight presents a specialized technology investment case.
Income Statement Comparison
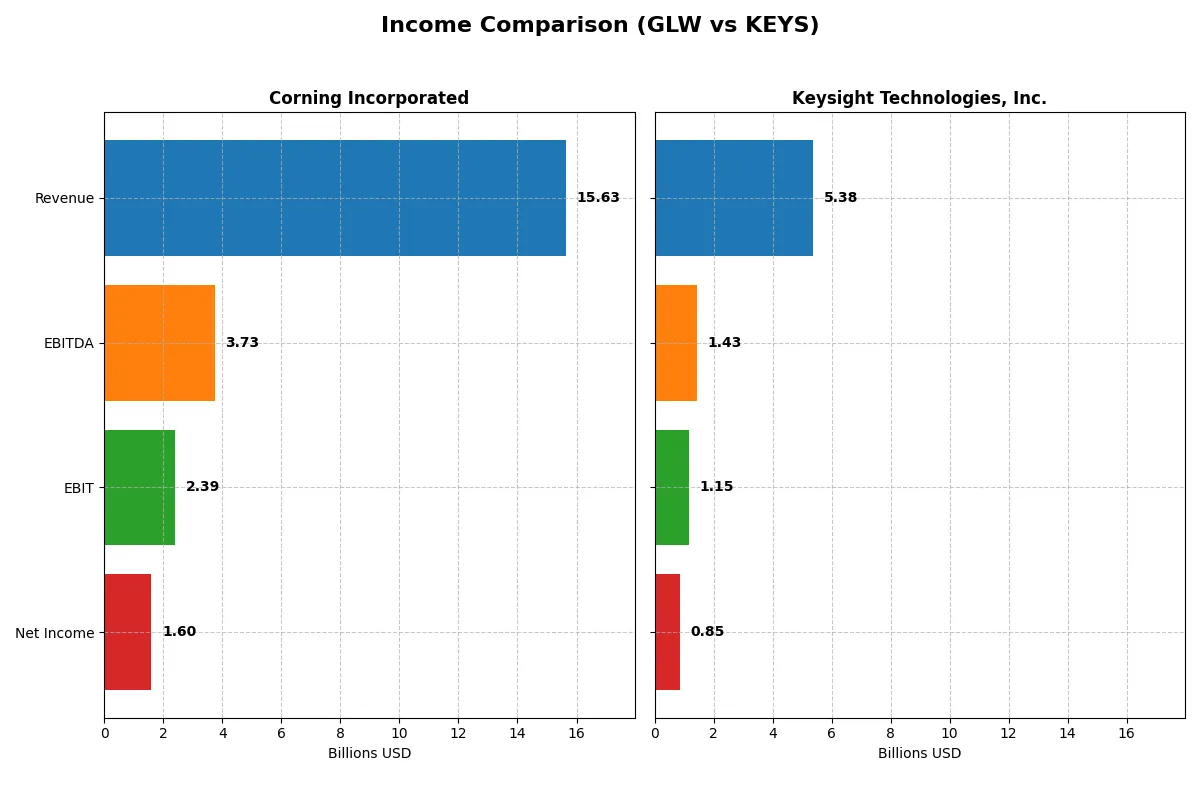
The following data dissects the core profitability and scalability of both corporate engines to reveal who dominates the bottom line:
| Metric | Corning Incorporated (GLW) | Keysight Technologies, Inc. (KEYS) |
|---|---|---|
| Revenue | 15.6B | 5.4B |
| Cost of Revenue | 10.1B | 2.0B |
| Operating Expenses | 3.2B | 2.4B |
| Gross Profit | 5.5B | 3.3B |
| EBITDA | 3.7B | 1.4B |
| EBIT | 2.4B | 1.2B |
| Interest Expense | 336M | 96M |
| Net Income | 1.6B | 846M |
| EPS | 1.86 | 4.90 |
| Fiscal Year | 2025 | 2025 |
Income Statement Analysis: The Bottom-Line Duel
This income statement comparison reveals which company runs a more efficient and profitable corporate engine through revenue and margin dynamics.
Corning Incorporated Analysis
Corning’s revenue climbed from $14.1B in 2021 to $15.6B in 2025, showing steady growth. Net income dipped overall but surged 215% in the last year to $1.6B, reflecting a sharp margin rebound. Its gross margin remains solid at 35.3%, while net margin expanded to 10.2%, signaling improved operational efficiency and profitable momentum in 2025.
Keysight Technologies, Inc. Analysis
Keysight’s revenue grew moderately from $4.9B in 2021 to $5.4B in 2025. Net income peaked at $1.06B in 2023, then declined to $846M in 2025, though net margin stayed robust at 15.7%. Its superior gross margin of 62.1% and ebit margin of 21.4% highlight strong cost control and profitability, sustaining solid operational momentum despite modest recent revenue growth.
Margin Strength vs. Revenue Scale
Corning’s recent surge in net income and margin expansion contrasts with Keysight’s consistent high margins but softer net income growth. Corning leads in revenue scale and accelerating profitability, while Keysight excels in margin quality and operational discipline. Investors seeking growth in earnings may favor Corning; those prioritizing margin stability might prefer Keysight’s profile.
Financial Ratios Comparison
These vital ratios act as a diagnostic tool to expose the underlying fiscal health, valuation premiums, and capital efficiency of the companies compared below:
| Ratios | Corning Incorporated (GLW) | Keysight Technologies, Inc. (KEYS) |
|---|---|---|
| ROE | 13.5% | 14.4% |
| ROIC | 7.4% | 8.0% |
| P/E | 47.2 | 37.4 |
| P/B | 6.38 | 5.39 |
| Current Ratio | 1.59 | 2.35 |
| Quick Ratio | 1.04 | 1.78 |
| D/E (Debt-to-Equity) | 0.71 | 0.51 |
| Debt-to-Assets | 27.2% | 26.3% |
| Interest Coverage | 6.78 | 9.88 |
| Asset Turnover | 0.50 | 0.48 |
| Fixed Asset Turnover | 1.05 | 5.21 |
| Payout Ratio | 62.6% | 0% |
| Dividend Yield | 1.33% | 0% |
| Fiscal Year | 2025 | 2025 |
Efficiency & Valuation Duel: The Vital Signs
Financial ratios act as a company’s DNA, exposing hidden risks and revealing operational strengths critical for investment decisions.
Corning Incorporated
Corning delivers a solid 13.5% ROE with a favorable 10.2% net margin, signaling healthy profitability. However, its P/E of 47.2 and P/B of 6.4 suggest a stretched valuation relative to peers. The company pays a moderate 1.33% dividend, balancing shareholder returns with steady R&D investments supporting future growth.
Keysight Technologies, Inc.
Keysight posts a slightly higher 14.4% ROE and a strong 15.7% net margin, demonstrating operational efficiency. Despite a lower P/E of 37.4 than Corning, it remains expensive by market standards. The absence of dividends points to aggressive reinvestment in R&D, which consumes nearly 19% of revenue, fueling its innovation-driven growth strategy.
Premium Valuation vs. Operational Safety
Both firms show slightly favorable ratios but differ in risk profiles. Corning offers a dividend cushion amid a stretched valuation, while Keysight relies heavily on reinvestment with no immediate shareholder payouts. Investors seeking income may prefer Corning, whereas those targeting growth might find Keysight’s aggressive R&D appealing.
Which one offers the Superior Shareholder Reward?
I see Corning Incorporated (GLW) pays a modest 1.3% dividend yield with a high payout ratio of 62.6%, suggesting limited room for dividend growth. Its free cash flow covers dividends by 1.18x, indicating moderate sustainability. Corning also returns capital via buybacks, but at a slower pace. Keysight Technologies (KEYS) pays no dividend, reinvesting heavily in growth and R&D, as reflected by its robust free cash flow per share of 7.4B and low payout ratio of zero. KEYS aggressively repurchases shares, enhancing shareholder returns through capital appreciation. I believe KEYS’s reinvestment and buyback strategy offers a superior total return profile in 2026, aligning better with long-term value creation than GLW’s dividend-heavy model.
Comparative Score Analysis: The Strategic Profile
The radar chart reveals the fundamental DNA and trade-offs of Corning Incorporated and Keysight Technologies, highlighting their operational efficiencies and valuation dynamics:
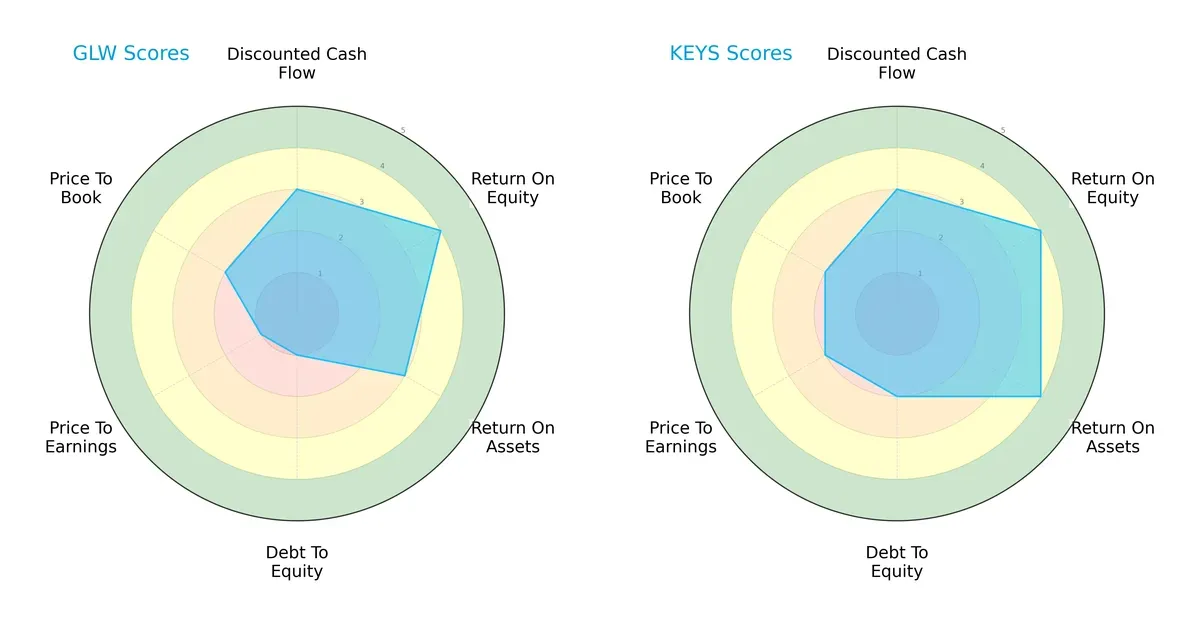
Keysight shows a more balanced profile with favorable ROE (4) and ROA (4) scores and moderate debt-to-equity (2), reflecting financial stability. Corning leans heavily on its ROE (4) but struggles with debt (1) and valuation metrics (P/E 1, P/B 2), signaling riskier capital structure and potential undervaluation. Overall, Keysight’s diversified strengths suggest a steadier strategic position.
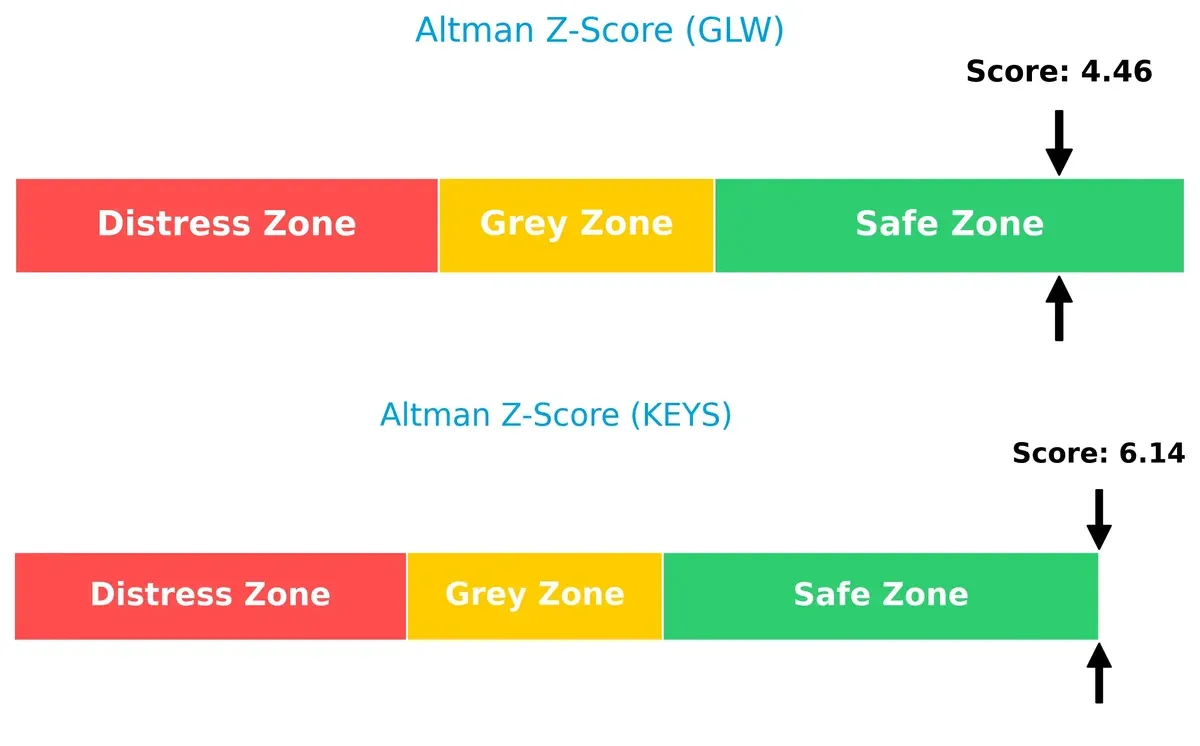
Bankruptcy Risk: Solvency Showdown
Keysight’s Altman Z-Score of 6.14 versus Corning’s 4.46 places both firms safely above distress thresholds, but Keysight’s superior margin signals stronger long-term survival prospects in volatile markets:
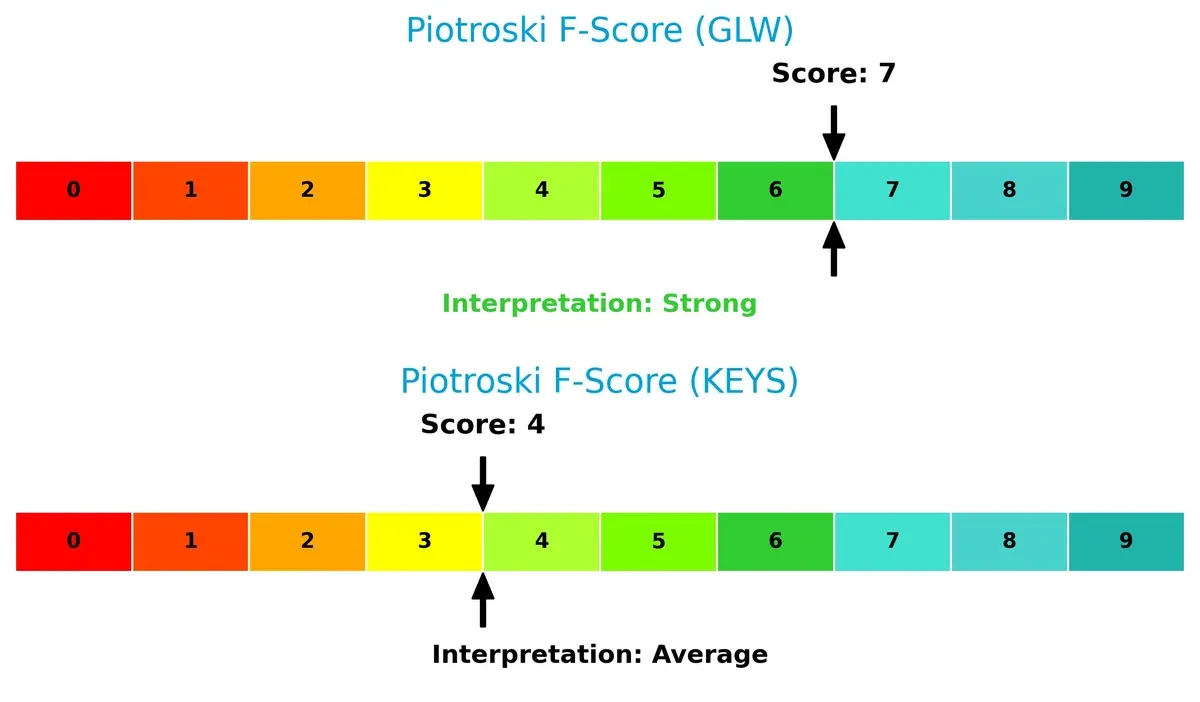
Financial Health: Quality of Operations
Corning’s Piotroski score of 7 indicates strong financial health, outperforming Keysight’s average 4, which raises internal metric concerns and warrants caution on operational efficiency:
How are the two companies positioned?
This section dissects the operational DNA of Corning and Keysight by comparing their revenue distribution and internal strengths and weaknesses. The goal is to confront their economic moats and identify which model delivers the most resilient, sustainable competitive advantage today.
Revenue Segmentation: The Strategic Mix
This visual comparison dissects how Corning Incorporated and Keysight Technologies diversify their income streams and where their primary sector bets lie:
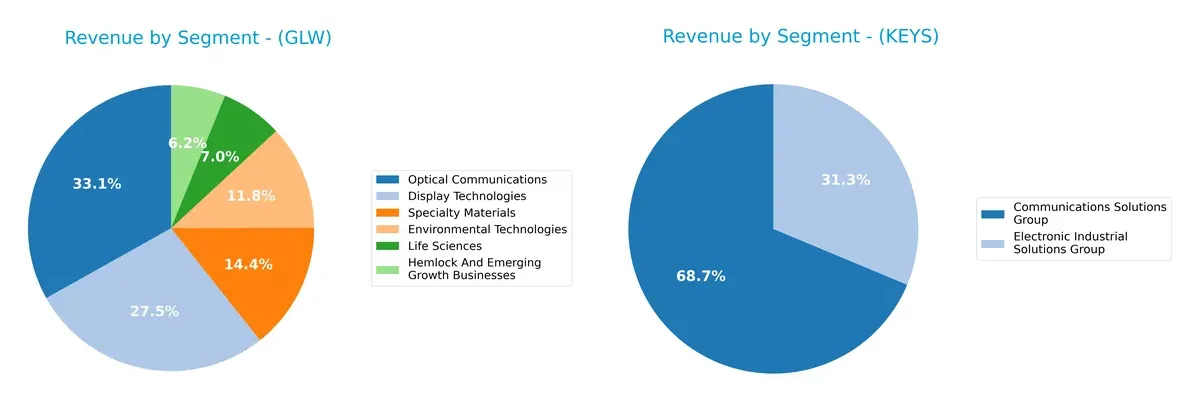
Corning anchors its revenue in Optical Communications ($4.66B) and Display Technologies ($3.87B), showing a broad portfolio including Specialty Materials and Environmental Technologies. Keysight leans heavily on Communications Solutions ($3.42B) and Electronic Industrial Solutions ($1.56B), reflecting a tighter focus. Corning’s diversified base reduces concentration risk, while Keysight’s reliance on two segments suggests greater exposure but potential for deep industry specialization.
Strengths and Weaknesses Comparison
This table compares the strengths and weaknesses of Corning Incorporated and Keysight Technologies, Inc.:
Corning Incorporated Strengths
- Diversified revenue streams across multiple segments
- Favorable net margin at 10.21%
- Strong liquidity with current ratio 1.59
- Favorable debt-to-assets at 27.23%
- Significant global presence, especially Asia Pacific and North America
Keysight Technologies Strengths
- Higher net margin at 15.74%
- Strong liquidity with current ratio 2.35
- Favorable interest coverage at 11.98
- High fixed asset turnover at 5.21
- Balanced geographic presence across Americas, Asia Pacific, and Europe
Corning Incorporated Weaknesses
- Elevated valuation multiples with PE 47.18 and PB 6.38
- Neutral ROIC at 7.4% below WACC 8.56%
- Moderate asset turnover at 0.5
- Neutral debt/equity ratio at 0.71
- ROE neutral at 13.52%
Keysight Technologies Weaknesses
- PE 37.41 and PB 5.39 also indicate high valuation
- Unfavorable asset turnover at 0.48
- No dividend yield
- Higher percentage of unfavorable ratios at 28.57%
- ROIC neutral at 8.02% compared to WACC 8.89%
Both companies show slightly favorable overall financial profiles with strong liquidity and global reach. Corning’s broader diversification contrasts with Keysight’s superior profitability metrics. Both face valuation concerns and neutral returns on invested capital, highlighting challenges in capital efficiency and market pricing.
The Moat Duel: Analyzing Competitive Defensibility
A structural moat is the only reliable shield that protects long-term profits from relentless competition erosion. Let’s examine how Corning and Keysight defend their turf:
Corning Incorporated: Intangible Assets and Innovation Backbone
Corning’s moat stems from proprietary glass technologies and diversified specialty materials. This supports steady margins and an improving ROIC trend despite value erosion. New display and life sciences markets could strengthen its position in 2026.
Keysight Technologies, Inc.: Technology Leadership with High Margins
Keysight’s competitive edge relies on cutting-edge electronic test solutions and a strong brand in aerospace and communications. However, its declining ROIC signals weakening capital efficiency. Expansion in software-driven testing offers growth potential but also market disruption risks.
Innovation Depth vs. Margin Strength: The Moat Showdown
Corning’s intangible asset moat is wider, supported by a growing ROIC trend, while Keysight’s margin advantage is undermined by declining returns. I see Corning better equipped to defend and grow its market share in 2026.
Which stock offers better returns?
Over the past 12 months, both stocks show notable price gains with clear bullish trends. Corning’s surge outpaces Keysight’s, while trading volumes diverge.
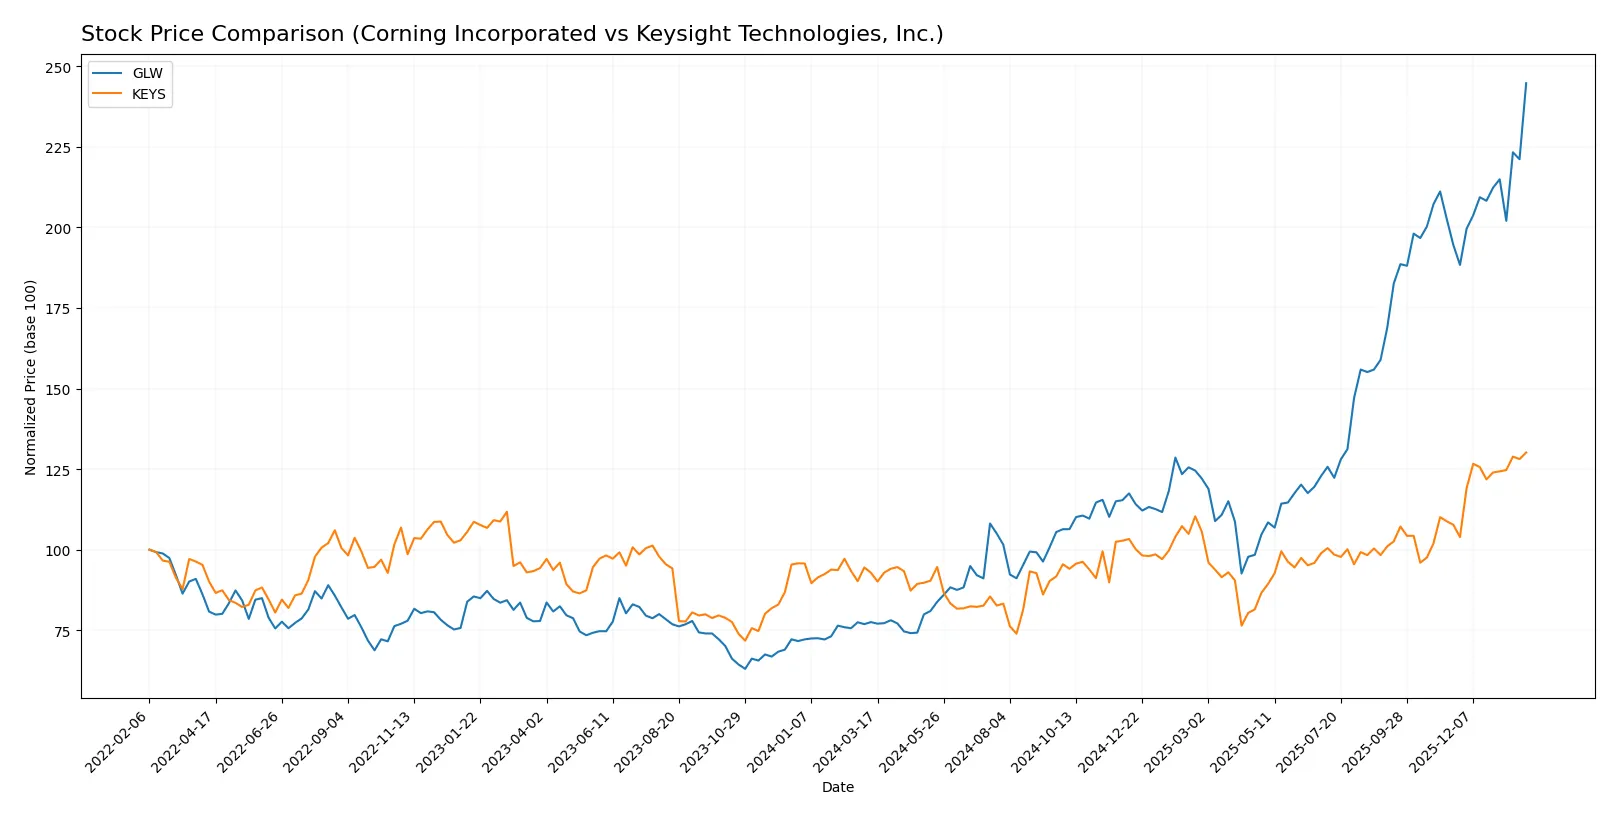
Trend Comparison
Corning Incorporated (GLW) exhibits a strong bullish trend with a 216% price rise over the past year, showing acceleration and a high volatility of 18.43%. Its price ranged from 31.27 to 103.25.
Keysight Technologies, Inc. (KEYS) also shows a bullish trend with a 40% gain in 12 months, accelerating but with higher volatility at 20.07%. Prices moved between 122.87 and 216.33.
Corning outperformed Keysight in market returns, delivering significantly higher price appreciation over the analyzed period.
Target Prices
Analysts present solid target price consensus for both Corning Incorporated and Keysight Technologies, Inc.
| Company | Target Low | Target High | Consensus |
|---|---|---|---|
| Corning Incorporated | 100 | 130 | 116.63 |
| Keysight Technologies, Inc. | 210 | 243 | 226.5 |
The consensus targets for GLW and KEYS imply upside potential of about 13% and 5% respectively versus current prices. Analysts expect moderate growth relative to recent valuations.

Don’t Let Luck Decide Your Entry Point
Optimize your entry points with our advanced ProRealTime indicators. You’ll get efficient buy signals with precise price targets for maximum performance. Start outperforming now!
How do institutions grade them?
The following tables summarize the latest institutional grades for both companies:
Corning Incorporated Grades
This table lists recent grades assigned to Corning Incorporated by major institutions.
| Grading Company | Action | New Grade | Date |
|---|---|---|---|
| Morgan Stanley | Maintain | Equal Weight | 2026-01-29 |
| Mizuho | Maintain | Outperform | 2026-01-29 |
| Citigroup | Maintain | Buy | 2026-01-29 |
| Susquehanna | Maintain | Positive | 2026-01-29 |
| JP Morgan | Maintain | Overweight | 2026-01-28 |
| Citigroup | Maintain | Buy | 2026-01-12 |
| Morgan Stanley | Maintain | Equal Weight | 2025-12-17 |
| UBS | Maintain | Buy | 2025-11-21 |
| Citigroup | Maintain | Buy | 2025-10-29 |
| JP Morgan | Maintain | Overweight | 2025-10-29 |
Keysight Technologies, Inc. Grades
This table presents recent grades assigned to Keysight Technologies, Inc. by leading institutions.
| Grading Company | Action | New Grade | Date |
|---|---|---|---|
| Morgan Stanley | Maintain | Equal Weight | 2025-12-17 |
| Jefferies | Maintain | Hold | 2025-12-10 |
| Baird | Maintain | Outperform | 2025-11-26 |
| Barclays | Maintain | Overweight | 2025-11-25 |
| Morgan Stanley | Maintain | Equal Weight | 2025-11-25 |
| Wells Fargo | Maintain | Overweight | 2025-11-25 |
| JP Morgan | Maintain | Overweight | 2025-11-25 |
| Susquehanna | Maintain | Positive | 2025-11-25 |
| Citigroup | Maintain | Buy | 2025-11-25 |
| UBS | Maintain | Buy | 2025-11-25 |
Which company has the best grades?
Both companies receive strong institutional support with multiple Buy and Outperform ratings. Corning shows a slightly more consistent Buy and Overweight consensus. Keysight also has multiple Overweight and Buy ratings but includes some Hold and Equal Weight grades. Investors may interpret Corning’s steadier positive grades as a sign of broader confidence.
Risks specific to each company
The following categories identify the critical pressure points and systemic threats facing both firms in the 2026 market environment:
1. Market & Competition
Corning Incorporated
- Faces intense competition in display and optical communications sectors, risking margin pressure.
Keysight Technologies, Inc.
- Competes in electronic test solutions with strong innovation demands and evolving customer needs.
2. Capital Structure & Debt
Corning Incorporated
- Moderate debt-to-equity ratio (0.71) with solid interest coverage (7.11), indicating manageable leverage.
Keysight Technologies, Inc.
- Lower debt-to-equity (0.51) and higher interest coverage (11.98) suggest stronger balance sheet stability.
3. Stock Volatility
Corning Incorporated
- Beta at 1.125 implies moderate stock volatility, slightly below industry peers.
Keysight Technologies, Inc.
- Slightly higher beta (1.179) indicates greater sensitivity to market swings.
4. Regulatory & Legal
Corning Incorporated
- Exposure to environmental regulations due to emissions control products could increase compliance costs.
Keysight Technologies, Inc.
- Operates in highly regulated sectors like aerospace and defense, facing stringent export and security rules.
5. Supply Chain & Operations
Corning Incorporated
- Complex global supply chains for glass and specialty materials may face raw material price volatility.
Keysight Technologies, Inc.
- Relies on advanced semiconductor and electronics components, vulnerable to chip shortages and logistics delays.
6. ESG & Climate Transition
Corning Incorporated
- Environmental technologies business aligns with climate goals but may face transition risks in emissions standards.
Keysight Technologies, Inc.
- Increasing focus on sustainable products and operations, yet energy-intensive manufacturing poses challenges.
7. Geopolitical Exposure
Corning Incorporated
- Global footprint exposes it to trade tensions and tariffs, especially with China and Asia-Pacific regions.
Keysight Technologies, Inc.
- Significant exposure to international markets with risks from geopolitical uncertainties impacting defense contracts.
Which company shows a better risk-adjusted profile?
Corning’s largest risk is competitive pressure squeezing margins in its core display and optical segments. Keysight faces greater regulatory and geopolitical risks but benefits from a stronger balance sheet and higher profitability. Their higher interest coverage ratio (11.98 vs. 7.11) and more favorable Altman Z-Score (6.14 vs. 4.46) signal superior financial resilience. I view Keysight as having the better risk-adjusted profile due to its robust capital structure and safer liquidity position despite market volatility.
Final Verdict: Which stock to choose?
Corning Incorporated’s superpower lies in its improving profitability and robust cash flow generation, signaling efficient capital use despite a slight value erosion. Its solid liquidity and bullish price momentum make it a fit for investors seeking exposure in cyclical yet resilient industrials with growth potential. Point of vigilance: elevated valuation multiples suggest caution. This suits an Aggressive Growth portfolio.
Keysight Technologies boasts a strategic moat through its dominant position in high-margin, recurring revenue test and measurement solutions. Its stronger balance sheet and superior interest coverage offer better stability versus Corning. Keysight fits well within a GARP (Growth at a Reasonable Price) strategy, appealing to investors valuing growth backed by financial prudence.
If you prioritize aggressive growth with improving profitability and cash flow, Corning outshines due to its accelerating returns and bullish momentum. However, if you seek a safer growth story with a durable moat and stronger financial stability, Keysight offers better stability despite a declining profitability trend. Both present analytical scenarios worth considering depending on your risk tolerance and portfolio goals.
Disclaimer: Investment carries a risk of loss of initial capital. The past performance is not a reliable indicator of future results. Be sure to understand risks before making an investment decision.
Go Further
I encourage you to read the complete analyses of Corning Incorporated and Keysight Technologies, Inc. to enhance your investment decisions: