Home > Comparison > Technology > GLW vs JBL
The strategic rivalry between Corning Incorporated and Jabil Inc. shapes the trajectory of the technology hardware sector. Corning operates as a diversified innovator in display and specialty materials, while Jabil excels in contract manufacturing and electronics production services. This head-to-head pits product specialization against scale-driven manufacturing. This analysis will determine which business model offers a superior risk-adjusted outlook for a diversified technology portfolio.
Table of contents
Companies Overview
Corning Incorporated and Jabil Inc. both hold pivotal roles in the hardware and equipment sectors, shaping global technology supply chains.
Corning Incorporated: Innovator in Specialty Glass and Optical Solutions
Corning Incorporated dominates in display technologies and optical communications. It generates revenue by supplying glass substrates for LCDs and OLEDs used in consumer electronics. In 2026, Corning prioritizes expanding its specialty materials and life sciences segments to leverage emerging market demands in precision optics and lab consumables.
Jabil Inc.: Leader in Electronics Manufacturing Services
Jabil Inc. specializes in electronics manufacturing and design services. Its core revenue stems from producing and managing electronic assemblies, including PCBA and electro-mechanical enclosures. In 2026, Jabil focuses on broadening its diversified manufacturing solutions to support high-growth sectors like 5G, automotive, and healthcare technology.
Strategic Collision: Similarities & Divergences
Corning emphasizes proprietary materials and niche product innovation, while Jabil pursues a scalable, service-oriented manufacturing model. Their competition centers on supplying advanced components and assemblies to overlapping tech markets. Corning offers a product-driven investment profile; Jabil leans on operational scale and client diversification for growth.
Income Statement Comparison
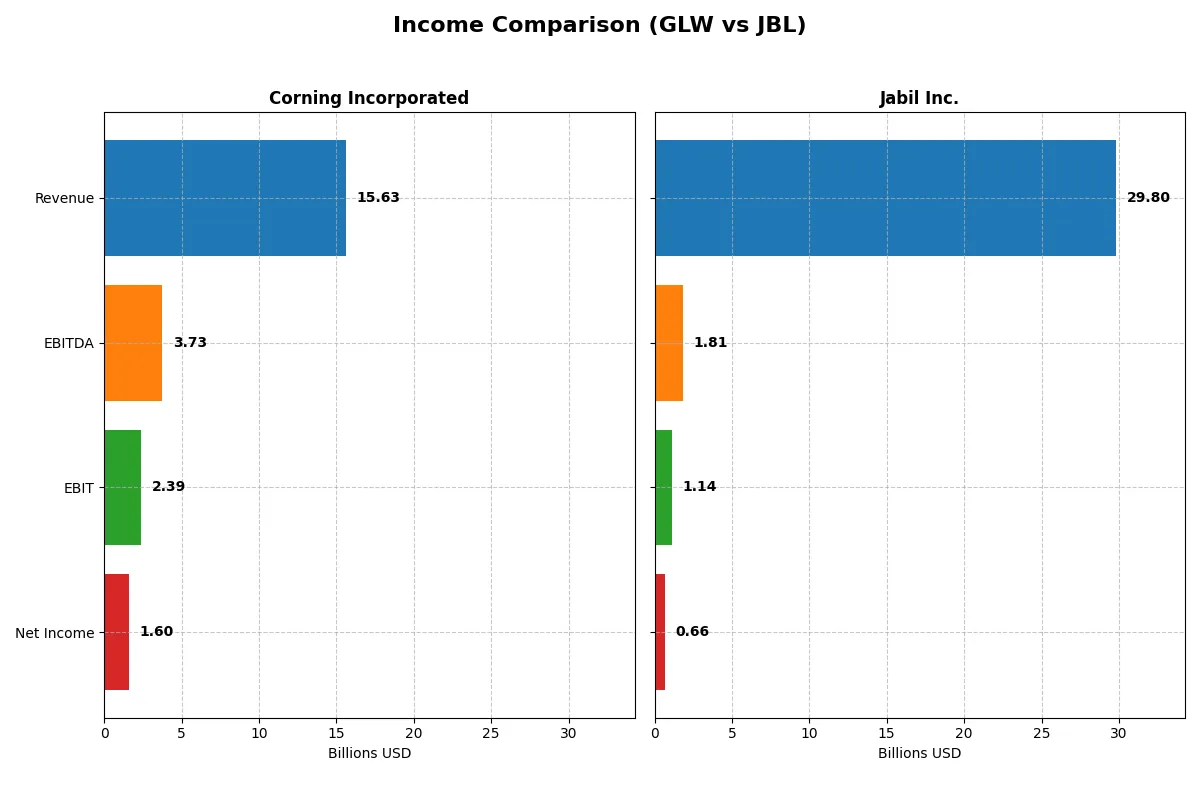
This data dissects the core profitability and scalability of both corporate engines to reveal who dominates the bottom line:
| Metric | Corning Incorporated (GLW) | Jabil Inc. (JBL) |
|---|---|---|
| Revenue | 15.6B | 29.8B |
| Cost of Revenue | 10.1B | 27.2B |
| Operating Expenses | 3.18B | 1.46B |
| Gross Profit | 5.51B | 2.65B |
| EBITDA | 3.74B | 1.81B |
| EBIT | 2.39B | 1.14B |
| Interest Expense | 336M | 244M |
| Net Income | 1.60B | 657M |
| EPS | 1.86 | 6.00 |
| Fiscal Year | 2025 | 2025 |
Income Statement Analysis: The Bottom-Line Duel
This income statement comparison exposes which company runs a more efficient and profitable corporate engine in 2025.
Corning Incorporated Analysis
Corning’s revenue rose from $12.6B in 2023 to $15.6B in 2025, demonstrating strong growth momentum. Net income surged from $581M to $1.6B, reflecting sharp margin expansion. Their gross margin stands at a healthy 35.3%, and net margin at 10.2%, signaling robust operational efficiency and improving profitability.
Jabil Inc. Analysis
Jabil’s revenue grew modestly from $29.3B in 2021 to $29.8B in 2025, showing flat top-line momentum. Net income declined from $696M to $657M, with net margin at a weak 2.2%. Their gross margin is only 8.9%, and EBIT margin 3.8%, indicating cost pressure and deteriorating profitability over time.
Margin Power vs. Revenue Scale
Corning outperforms Jabil with superior margin profiles and faster net income growth despite smaller revenue. Corning’s efficient cost structure delivers more profit per dollar of sales. Investors seeking profitability and margin expansion will find Corning’s profile more attractive than Jabil’s flat revenue and compressed margins.
Financial Ratios Comparison
These vital ratios act as a diagnostic tool to expose the underlying fiscal health, valuation premiums, and capital efficiency of the companies analyzed:
| Ratios | Corning Incorporated (GLW) | Jabil Inc. (JBL) |
|---|---|---|
| ROE | 13.52% | 43.42% |
| ROIC | 7.40% | 16.06% |
| P/E | 47.18 | 34.14 |
| P/B | 6.38 | 14.82 |
| Current Ratio | 1.59 | 1.00 |
| Quick Ratio | 1.04 | 0.66 |
| D/E | 0.71 | 2.22 |
| Debt-to-Assets | 27.23% | 18.15% |
| Interest Coverage | 6.78 | 4.84 |
| Asset Turnover | 0.50 | 1.61 |
| Fixed Asset Turnover | 1.05 | 9.01 |
| Payout Ratio | 62.59% | 5.48% |
| Dividend Yield | 1.33% | 0.16% |
| Fiscal Year | 2025 | 2025 |
Efficiency & Valuation Duel: The Vital Signs
Financial ratios serve as a company’s DNA, exposing hidden risks and operational strength beneath surface numbers.
Corning Incorporated
Corning shows a solid 13.5% ROE and favorable 10.2% net margin, reflecting steady profitability. However, its 47.2 P/E and 6.4 P/B ratios mark the stock as stretched. The 1.3% dividend yield offers moderate shareholder returns, while reinvestment into R&D at 7.1% of revenue supports future growth.
Jabil Inc.
Jabil delivers an impressive 43.4% ROE and 16.1% ROIC, signaling strong operational efficiency. Yet, its net margin languishes at 2.2%, and valuation metrics remain stretched with a 34.1 P/E and 14.8 P/B. Dividend yield is negligible at 0.16%, emphasizing reliance on capital allocation for expansion.
Premium Valuation vs. Operational Strength
Corning balances moderate profitability with a stretched valuation and steady dividends. Jabil offers superior returns on equity and capital but carries weaker margins and heavier leverage. Investors seeking growth via operational efficiency may favor Jabil, while those prioritizing income and stability might lean toward Corning.
Which one offers the Superior Shareholder Reward?
I compare Corning Incorporated (GLW) and Jabil Inc. (JBL) on their shareholder reward strategies. GLW yields 1.33% with a 63% payout ratio, supported by steady free cash flow of 1.64/share and a moderate buyback pace. JBL offers a paltry 0.16% yield, a minuscule payout ratio under 6%, but aggressively repurchases shares fueled by robust free cash flow of 10.7/share. GLW’s model balances dividends and buybacks sustainably, while JBL prioritizes growth via buybacks over dividends. I find GLW’s more consistent distribution and dividend coverage better for long-term total return in 2026.
Comparative Score Analysis: The Strategic Profile
The radar chart reveals the fundamental DNA and trade-offs of Corning Incorporated and Jabil Inc., highlighting their financial strengths and weaknesses:
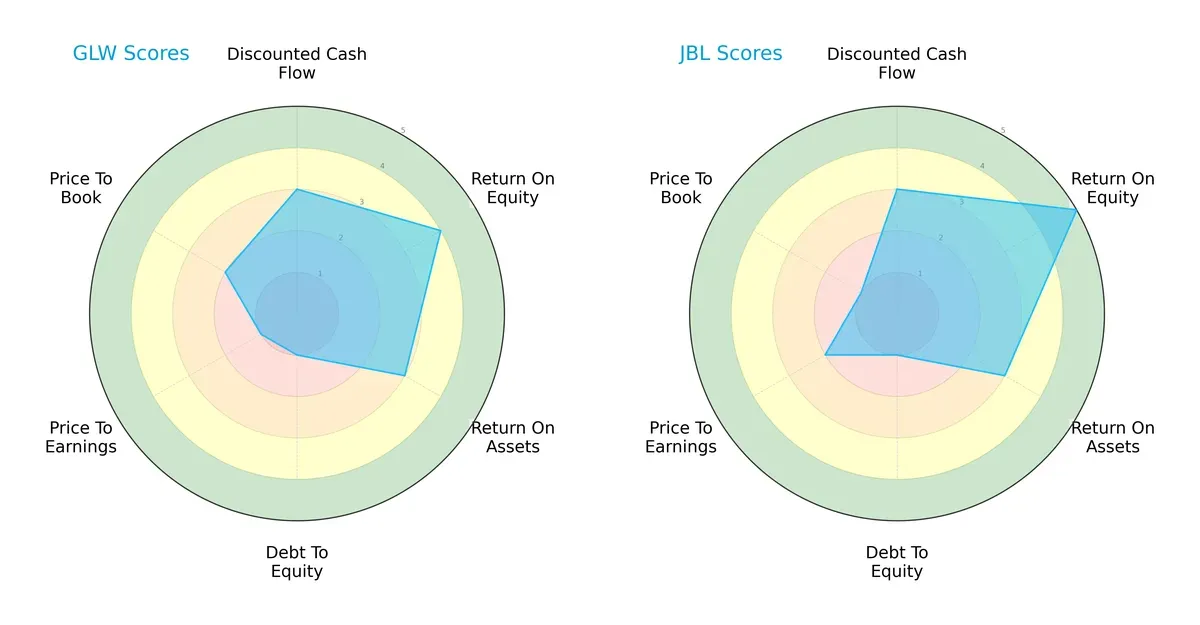
Jabil holds a slightly more balanced profile with a higher overall score (3 vs. 2) and superior return on equity (5 vs. 4). Both firms show moderate discounted cash flow and return on assets scores (3). Corning’s valuation metrics (PE and PB) lag, scoring very unfavorably, while Jabil fares better on PE but worse on PB. Both suffer from weak debt-to-equity scores (1), signaling elevated leverage risks. Jabil leans on ROE strength; Corning lacks valuation appeal.
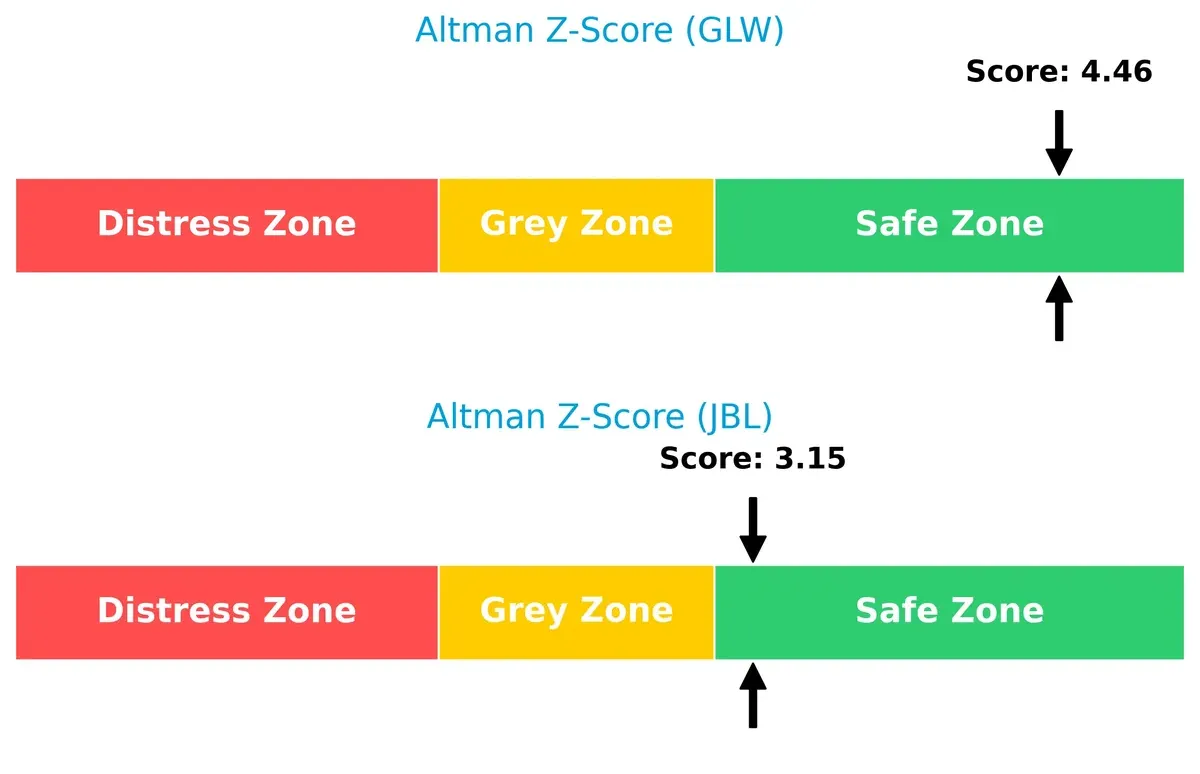
Bankruptcy Risk: Solvency Showdown
Jabil’s Altman Z-Score of 3.15 versus Corning’s 4.46 places both firms safely above bankruptcy risk thresholds, but Corning shows stronger solvency and resilience in this cycle:
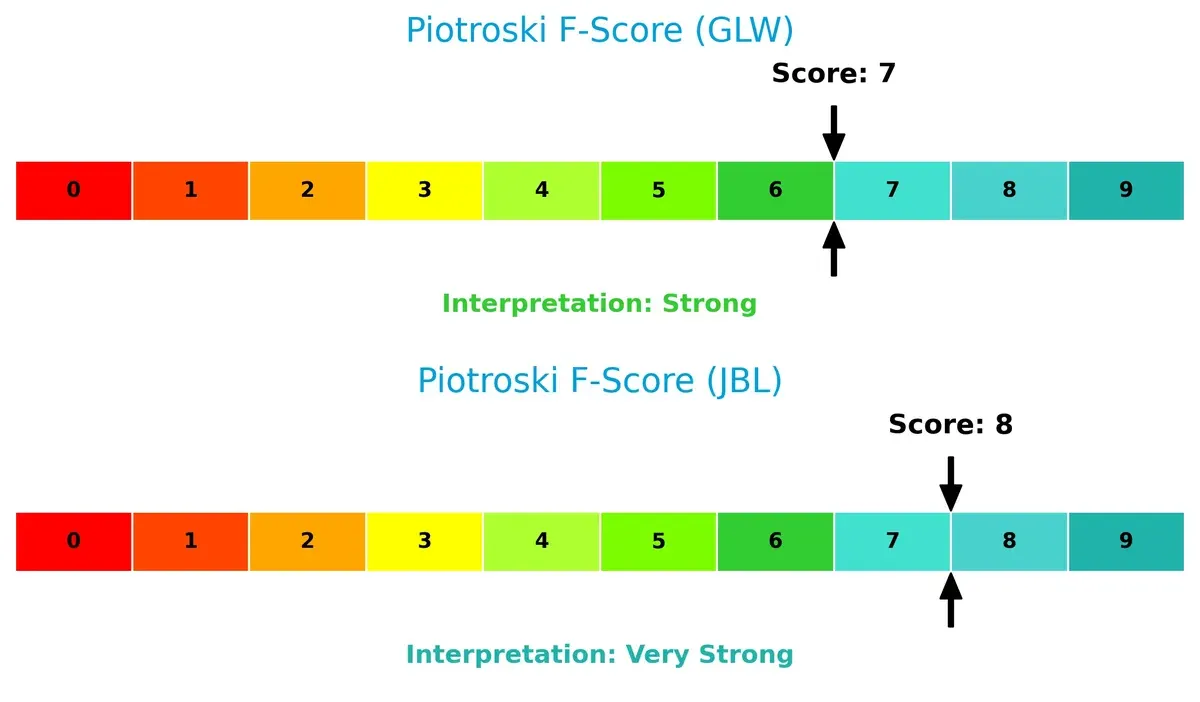
Financial Health: Quality of Operations
Jabil’s Piotroski F-Score of 8 versus Corning’s 7 indicates superior operational quality and fewer internal red flags, marking Jabil as the financially healthier firm today:
How are the two companies positioned?
This section dissects the operational DNA of Corning and Jabil by comparing revenue distribution and internal dynamics. The goal is to confront their economic moats to identify which model offers the most resilient, sustainable advantage today.
Revenue Segmentation: The Strategic Mix
The following comparison dissects how Corning Incorporated and Jabil Inc. diversify their income streams and where their primary sector bets lie:
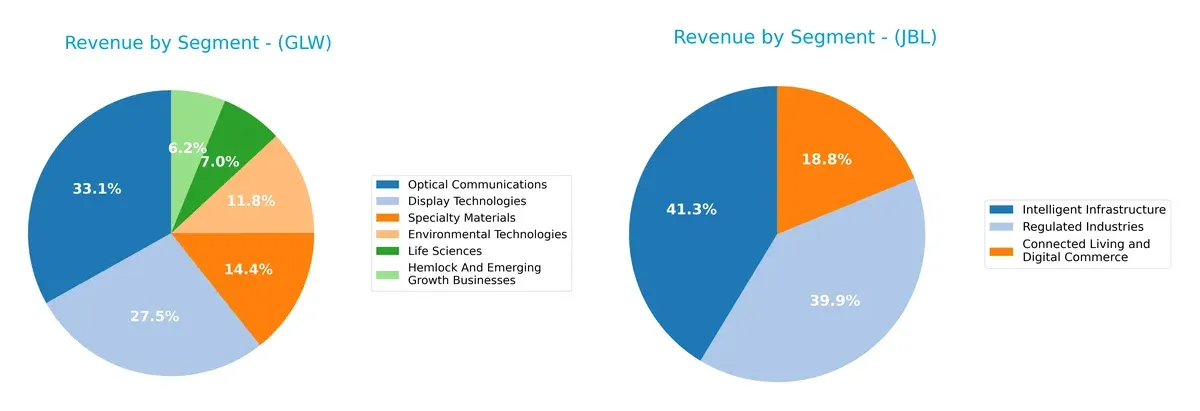
Corning’s 2024 revenue spreads across six key segments, with Optical Communications ($4.7B) and Display Technologies ($3.9B) anchoring its portfolio. This mix signals a balanced focus on high-tech materials and communications infrastructure. In contrast, Jabil’s 2025 revenue concentrates heavily in Intelligent Infrastructure ($12.3B) and Regulated Industries ($11.9B), showing reliance on large, capital-intensive sectors. Corning’s diversified segments reduce concentration risk, while Jabil’s scale in fewer sectors suggests strong ecosystem lock-in but higher exposure to sector-specific downturns.
Strengths and Weaknesses Comparison
This table compares the Strengths and Weaknesses of Corning Incorporated and Jabil Inc.:
Corning Incorporated Strengths
- Diverse product segments including Optical Communications and Display Technologies
- Favorable net margin at 10.21%
- Strong liquidity ratios with current ratio 1.59 and quick ratio 1.04
- Low debt-to-assets at 27.23% with favorable interest coverage
- Significant revenue from Asia Pacific and North America
- Corning Incorporated Weaknesses
- :—
- High valuation multiples with P/E 47.18 and P/B 6.38 marked unfavorable
- ROIC below WACC, indicating neutral capital efficiency
- Moderate debt to equity at 0.71 with neutral leverage
- Net margin lower than Jabil at 10.21% but competitive
Jabil Inc. Strengths
- High profitability with ROE 43.42% and ROIC 16.06%
- Favorable asset turnover indicating efficient use of assets
- Large revenue base in Intelligent Infrastructure and Regulated Industries
- Geographic diversification including US, China, Mexico, and Singapore
- Favorable debt-to-assets at 18.15%
- Jabil Inc. Weaknesses
- :—
- Low net margin at 2.2% indicates weak profitability
- Unfavorable leverage with debt-to-equity of 2.22
- Quick ratio at 0.66 signals liquidity risk
- High P/B ratio 14.82 and unfavorable dividend yield of 0.16%
- Slightly unfavorable overall financial ratios
Both companies exhibit strengths in different financial areas. Corning shows stable profitability and liquidity with diversified products and geographic reach. Jabil excels in capital efficiency and asset utilization but faces profitability and liquidity challenges. These contrasts highlight differing strategic focuses and risk profiles.
The Moat Duel: Analyzing Competitive Defensibility
A structural moat is the only reliable shield protecting long-term profits from relentless competitive pressure and market disruption:
Corning Incorporated: Intangible Assets and Technological Leadership
Corning leverages decades of intangible assets and advanced glass technologies, reflected in stable margins and strong revenue growth. Its expanding applications in life sciences and display tech could deepen this moat in 2026.
Jabil Inc.: Cost Advantage and Operational Scale
Jabil’s moat centers on cost efficiency and scale in electronics manufacturing, contrasting Corning’s innovation-driven edge. It delivers rising ROIC and expanding profitability, with growth opportunities in 5G and cloud manufacturing services.
Verdict: Innovation Depth vs. Scale Efficiency
Jabil possesses the wider moat with a 6.9% ROIC premium over WACC and accelerating profitability. Corning’s moat is narrower, as it currently destroys value despite rising ROIC. Jabil stands better positioned to defend and grow market share in 2026.
Which stock offers better returns?
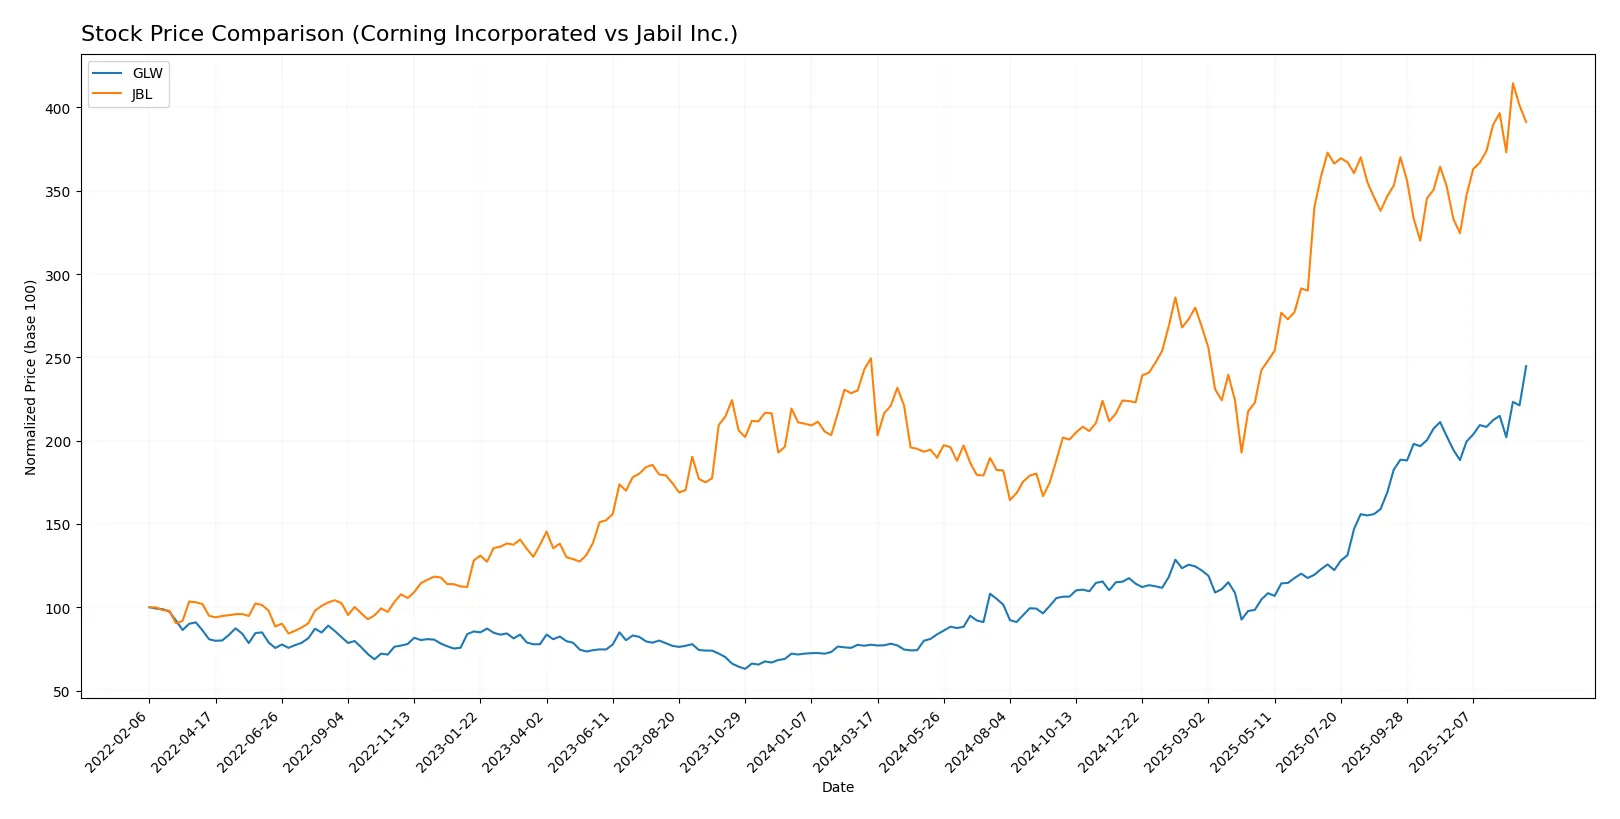
Over the past 12 months, both Corning Incorporated (GLW) and Jabil Inc. (JBL) showed strong bullish trends with accelerating price gains, reflecting robust market momentum and active trading dynamics.
Trend Comparison
Corning Incorporated’s stock surged 215.65% over the past year, marking a clear bullish trend with accelerating momentum and a volatility measure (std deviation) of 18.43. Its price ranged from a low of 31.27 to a high of 103.25, showing sustained upward strength.
Jabil Inc.’s stock also posted a bullish trend with a 56.83% gain over 12 months and acceleration in price movement. However, it demonstrated higher volatility (std deviation 44.31) and a wider price range between 99.62 and 251.29.
Comparing these trends, Corning’s stock delivered the highest market performance with significantly stronger price appreciation despite lower volatility relative to Jabil.
Target Prices
Analysts provide a clear target price range for Corning Incorporated and Jabil Inc., reflecting positive growth expectations.
| Company | Target Low | Target High | Consensus |
|---|---|---|---|
| Corning Incorporated | 100 | 130 | 116.63 |
| Jabil Inc. | 244 | 283 | 267.25 |
The consensus target for Corning sits about 13% above its current price of 103.25, suggesting modest upside. Jabil’s consensus target exceeds its current 237.19 price by roughly 13%, indicating strong analyst confidence.

Don’t Let Luck Decide Your Entry Point
Optimize your entry points with our advanced ProRealTime indicators. You’ll get efficient buy signals with precise price targets for maximum performance. Start outperforming now!
How do institutions grade them?
Corning Incorporated Grades
Here are the recent grades issued by major financial institutions for Corning Incorporated:
| Grading Company | Action | New Grade | Date |
|---|---|---|---|
| Morgan Stanley | Maintain | Equal Weight | 2026-01-29 |
| Mizuho | Maintain | Outperform | 2026-01-29 |
| Citigroup | Maintain | Buy | 2026-01-29 |
| Susquehanna | Maintain | Positive | 2026-01-29 |
| JP Morgan | Maintain | Overweight | 2026-01-28 |
| Citigroup | Maintain | Buy | 2026-01-12 |
| Morgan Stanley | Maintain | Equal Weight | 2025-12-17 |
| UBS | Maintain | Buy | 2025-11-21 |
| Citigroup | Maintain | Buy | 2025-10-29 |
| JP Morgan | Maintain | Overweight | 2025-10-29 |
Jabil Inc. Grades
Below are the latest grades from reputable firms for Jabil Inc.:
| Grading Company | Action | New Grade | Date |
|---|---|---|---|
| UBS | Maintain | Neutral | 2025-12-18 |
| Barclays | Maintain | Overweight | 2025-12-18 |
| JP Morgan | Maintain | Overweight | 2025-12-18 |
| B of A Securities | Maintain | Buy | 2025-12-10 |
| B of A Securities | Maintain | Buy | 2025-09-26 |
| Barclays | Maintain | Overweight | 2025-09-26 |
| JP Morgan | Maintain | Overweight | 2025-07-17 |
| B of A Securities | Maintain | Buy | 2025-06-20 |
| UBS | Maintain | Neutral | 2025-06-18 |
| B of A Securities | Maintain | Buy | 2025-06-18 |
Which company has the best grades?
Corning Incorporated generally receives stronger buy and outperform ratings, indicating analyst confidence. Jabil Inc. mostly holds overweight and buy ratings but also neutral grades, suggesting a more cautious outlook. This difference could influence investor sentiment and portfolio weight decisions.
Risks specific to each company
The following categories identify the critical pressure points and systemic threats facing both firms in the 2026 market environment:
1. Market & Competition
Corning Incorporated
- Faces intense competition in display and optical segments with modest net margin of 10.21%.
Jabil Inc.
- Operates in highly competitive EMS sector with low net margin of 2.2%, pressuring profitability.
2. Capital Structure & Debt
Corning Incorporated
- Maintains moderate leverage with debt-to-assets at 27.23% and interest coverage of 7.11, reflecting solid debt management.
Jabil Inc.
- Exhibits higher leverage; debt-to-equity ratio of 2.22 and interest coverage of 4.66 signal elevated financial risk.
3. Stock Volatility
Corning Incorporated
- Beta of 1.125 suggests moderate sensitivity to market swings, aligning with sector norms.
Jabil Inc.
- Higher beta at 1.246 indicates greater stock volatility, reflecting cyclical exposure in manufacturing.
4. Regulatory & Legal
Corning Incorporated
- Subject to environmental regulations impacting specialty materials and emissions control products.
Jabil Inc.
- Faces regulatory scrutiny in diverse manufacturing processes including electronics and safety compliance.
5. Supply Chain & Operations
Corning Incorporated
- Relies on complex global supply chains for advanced glass and optics, vulnerable to raw material fluctuations.
Jabil Inc.
- Operates extensive global manufacturing network; supply chain disruptions could significantly impact production.
6. ESG & Climate Transition
Corning Incorporated
- Environmental tech segment exposure to emissions control offers ESG opportunities but regulatory risks persist.
Jabil Inc.
- Pressure to improve ESG metrics amid energy-intensive manufacturing and global footprint.
7. Geopolitical Exposure
Corning Incorporated
- Global sales expose Corning to trade tensions and tariffs, especially in Asia-Pacific markets.
Jabil Inc.
- Broad international operations heighten sensitivity to geopolitical risks and supply chain interruptions.
Which company shows a better risk-adjusted profile?
Corning’s strongest risk remains its valuation stretched with a high P/E of 47.18, but its solid liquidity and moderate debt mitigate financial distress risks. Jabil faces pronounced operational leverage and low margins, increasing vulnerability to market downturns. Corning’s Altman Z-score (4.46) and Piotroski score (7) indicate safer financial footing than Jabil’s Z-score (3.15) and stronger Piotroski (8) partly offset by weaker liquidity. Overall, Corning presents a better risk-adjusted profile driven by stable balance sheet and lower volatility.
Corning’s valuation premium demands caution, yet its stable debt and liquidity contrast sharply with Jabil’s higher financial leverage and narrow margins. The recent surge in Corning’s trading volume (13.4M vs. 6.7M average) signals renewed investor interest, underscoring market confidence in its resilience despite valuation risks.
Final Verdict: Which stock to choose?
Corning Incorporated’s superpower lies in its resilient operational efficiency and strong income growth trajectory. Its capacity to generate consistent cash flow, despite a slight value erosion indicated by ROIC below WACC, highlights a company in transition toward better profitability. This stock suits investors seeking steady income with moderate growth potential.
Jabil Inc. commands a strategic moat through its robust capital allocation and superior return on invested capital well above its cost of capital. The company’s high asset turnover and improving ROIC trend underscore durable competitive advantages, albeit with higher leverage risks. It appeals to growth-oriented portfolios willing to balance volatility for stronger value creation.
If you prioritize stable cash flow and a measured growth path, Corning appears a compelling choice due to its steady income statement improvements and operational discipline. However, if you seek aggressive value creation with a durable moat and can tolerate higher financial risk, Jabil offers better growth potential and expanding profitability despite its leverage profile.
Disclaimer: Investment carries a risk of loss of initial capital. The past performance is not a reliable indicator of future results. Be sure to understand risks before making an investment decision.
Go Further
I encourage you to read the complete analyses of Corning Incorporated and Jabil Inc. to enhance your investment decisions: