Home > Comparison > Technology > GLW vs GRMN
The strategic rivalry between Corning Incorporated and Garmin Ltd. shapes the evolving landscape of the technology sector. Corning operates as a diversified industrial powerhouse specializing in advanced glass and optical materials, while Garmin excels as an innovative hardware manufacturer focused on consumer and aviation navigation devices. This analysis pits Corning’s capital-intensive legacy against Garmin’s niche market agility to determine which trajectory offers superior risk-adjusted potential for a balanced portfolio.
Table of contents
Companies Overview
Corning Incorporated and Garmin Ltd. stand as pivotal players in the global hardware and equipment market.
Corning Incorporated: Innovator in Specialty Glass and Optical Solutions
Corning Incorporated dominates in glass substrates and optical communications. Its revenue stems from supplying advanced glass for displays and fiber optic components. In 2026, Corning’s strategic focus emphasizes expanding its specialty materials and environmental technologies segments to leverage growth in mobile electronics and emissions control.
Garmin Ltd.: Leader in Wireless Navigation and Fitness Devices
Garmin Ltd. excels in designing and marketing wireless fitness and navigation devices. It generates revenue through fitness wearables, aviation avionics, and marine electronics. The company’s 2026 strategy concentrates on enhancing product integration across fitness, outdoor, and aviation sectors to deepen customer engagement and platform connectivity.
Strategic Collision: Similarities & Divergences
Both companies operate in the hardware sector but diverge sharply in approach. Corning focuses on supplying critical materials and components, while Garmin delivers end-user devices and software ecosystems. Their competition centers on innovation and expanding technological moats. Corning offers a materials-based investment profile, whereas Garmin presents a consumer-centric growth story.
Income Statement Comparison
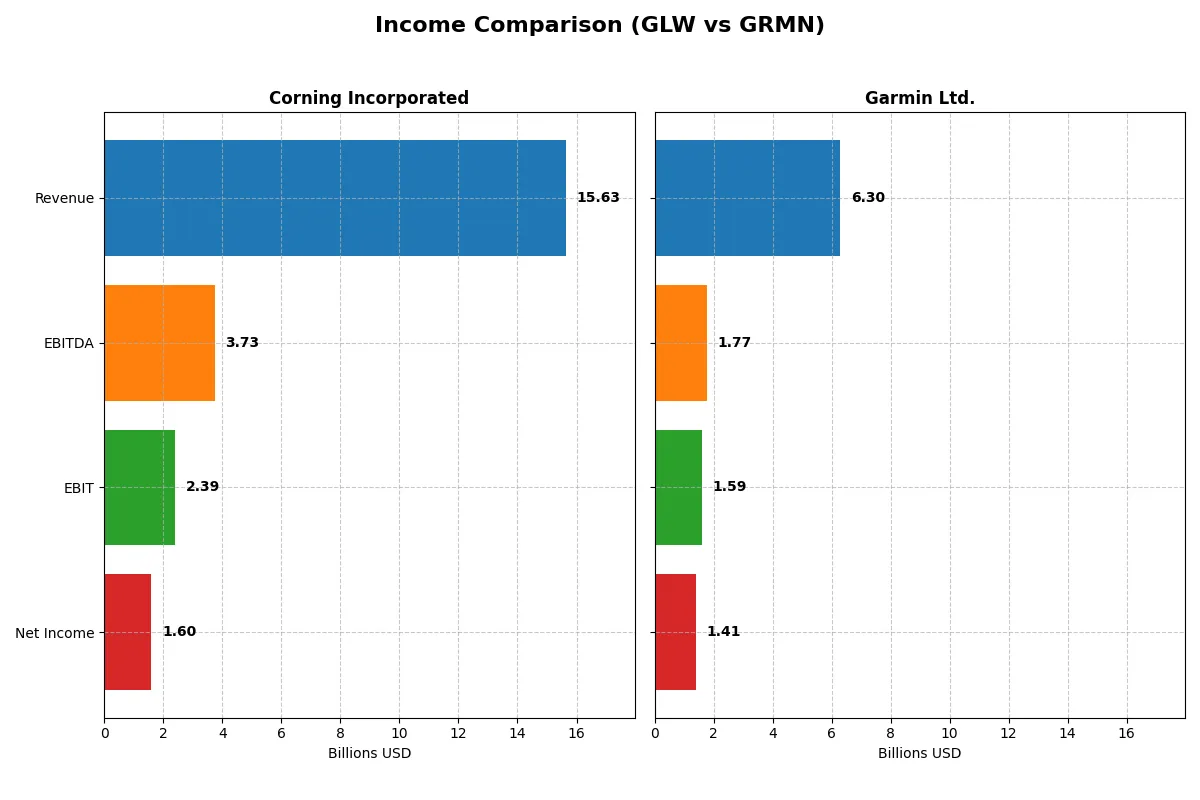
This data dissects the core profitability and scalability of both corporate engines to reveal who dominates the bottom line:
| Metric | Corning Incorporated (GLW) | Garmin Ltd. (GRMN) |
|---|---|---|
| Revenue | 15.63B | 6.30B |
| Cost of Revenue | 10.12B | 2.60B |
| Operating Expenses | 3.18B | 2.10B |
| Gross Profit | 5.51B | 3.70B |
| EBITDA | 3.74B | 1.77B |
| EBIT | 2.39B | 1.59B |
| Interest Expense | 336M | 0 |
| Net Income | 1.60B | 1.41B |
| EPS | 1.86 | 7.35 |
| Fiscal Year | 2025 | 2024 |
Income Statement Analysis: The Bottom-Line Duel
This income statement comparison reveals which company converts sales into profits most efficiently, exposing each business’s financial engine strength.
Corning Incorporated Analysis
Corning’s revenue surged from $12.6B in 2023 to $15.6B in 2025, reflecting robust top-line growth. Net income jumped from $581M to $1.6B, lifting net margins to a favorable 10.2%. Its gross margin of 35.3% and EBIT margin of 15.3% signal solid operational control. The 2025 figures show accelerating profitability and margin expansion.
Garmin Ltd. Analysis
Garmin increased revenue from $5.2B in 2023 to $6.3B in 2024, posting strong 20% growth. Net income rose to $1.41B, maintaining a high net margin near 22.4%. Garmin’s gross margin of 58.7% and EBIT margin of 25.3% demonstrate superior cost efficiency. The latest results reflect consistent margin strength despite a slight net margin dip.
Margin Efficiency vs. Revenue Expansion
Garmin dominates with higher margins, converting more revenue into profit, while Corning impresses with rapid revenue and net income growth. Garmin’s stable profitability suits investors favoring margin quality. Corning appeals to those prioritizing growth momentum and expanding scale. Each profile offers distinct fundamental strengths for portfolio consideration.
Financial Ratios Comparison
These vital ratios act as a diagnostic tool to expose the underlying fiscal health, valuation premiums, and capital efficiency of the companies compared below:
| Ratios | Corning Incorporated (GLW) | Garmin Ltd. (GRMN) |
|---|---|---|
| ROE | 13.5% | 18.0% |
| ROIC | 7.4% | 16.3% |
| P/E | 47.2 | 28.5 |
| P/B | 6.38 | 5.13 |
| Current Ratio | 1.59 | 3.54 |
| Quick Ratio | 1.04 | 2.56 |
| D/E | 0.71 | 0.02 |
| Debt-to-Assets | 27.2% | 1.7% |
| Interest Coverage | 6.78 | N/A |
| Asset Turnover | 0.50 | 0.65 |
| Fixed Asset Turnover | 1.05 | 4.49 |
| Payout ratio | 62.6% | 40.6% |
| Dividend yield | 1.33% | 1.42% |
| Fiscal Year | 2025 | 2024 |
Efficiency & Valuation Duel: The Vital Signs
Financial ratios serve as a company’s DNA, uncovering hidden risks and operational strengths that raw numbers alone cannot reveal.
Corning Incorporated
Corning shows a neutral ROE of 13.5% and a favorable net margin at 10.2%, indicating moderate profitability. However, its valuation looks stretched with a high P/E of 47.2 and P/B of 6.4. The 1.33% dividend yield suggests steady shareholder returns, balancing modest growth reinvestment with income.
Garmin Ltd.
Garmin delivers robust profitability with a 17.98% ROE and a strong 22.4% net margin. Its valuation, while expensive at a P/E of 28.5 and P/B of 5.1, is less stretched than Corning’s. Garmin maintains a 1.42% dividend yield and reinvests heavily in R&D, fueling operational efficiency and growth potential.
Valuation Stretch vs. Profit Power
Garmin offers superior profitability and better operational metrics despite a high valuation, while Corning’s stretched multiples contrast with more modest returns. Investors seeking growth with solid margins may lean toward Garmin; those focused on steadier dividend income might consider Corning’s profile.
Which one offers the Superior Shareholder Reward?
I observe that Corning Incorporated (GLW) offers a higher dividend yield at 3.83% in 2023 but with payout ratios above 70%, straining free cash flow coverage (~50%). Garmin Ltd. (GRMN) yields lower at 2.27% but maintains a conservative payout ratio near 43%, preserving free cash flow (~86%) for growth. Garmin’s robust buyback intensity and pristine balance sheet with negligible debt enhance its total return sustainability. Historically, firms like Garmin with balanced dividends and strong buybacks outperform in volatile markets. I conclude Garmin offers a more attractive, sustainable shareholder reward profile in 2026.
Comparative Score Analysis: The Strategic Profile
The radar chart reveals the fundamental DNA and trade-offs of Corning Incorporated and Garmin Ltd., highlighting their distinct financial strengths and vulnerabilities:
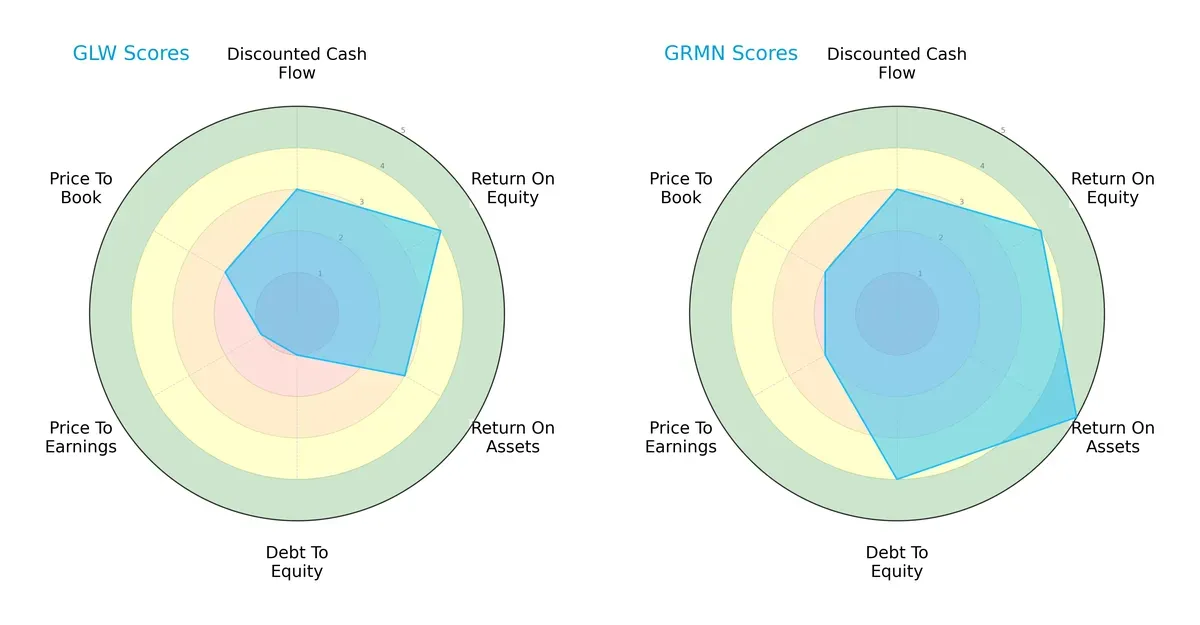
Garmin leads with a more balanced profile, excelling in ROA (5 vs. 3) and debt-to-equity (4 vs. 1), signaling strong asset efficiency and financial stability. Corning leans on solid ROE (4 each) but struggles with leverage and valuation (P/E and debt-to-equity scores at 1). Garmin’s diversified strengths reduce risk, while Corning relies heavily on equity returns amid financial constraints.
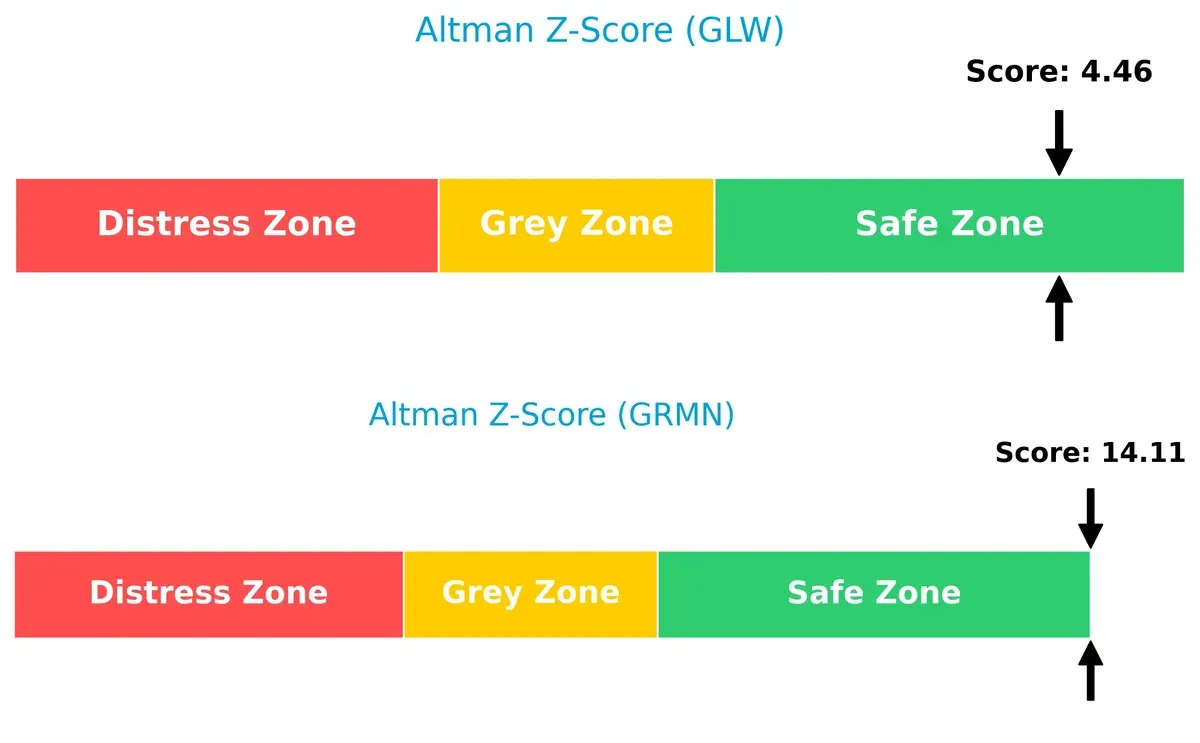
Bankruptcy Risk: Solvency Showdown
Garmin’s Altman Z-Score of 14.1 far surpasses Corning’s 4.5, both safely above the distress threshold, underscoring Garmin’s superior solvency and lower bankruptcy risk in this cycle:
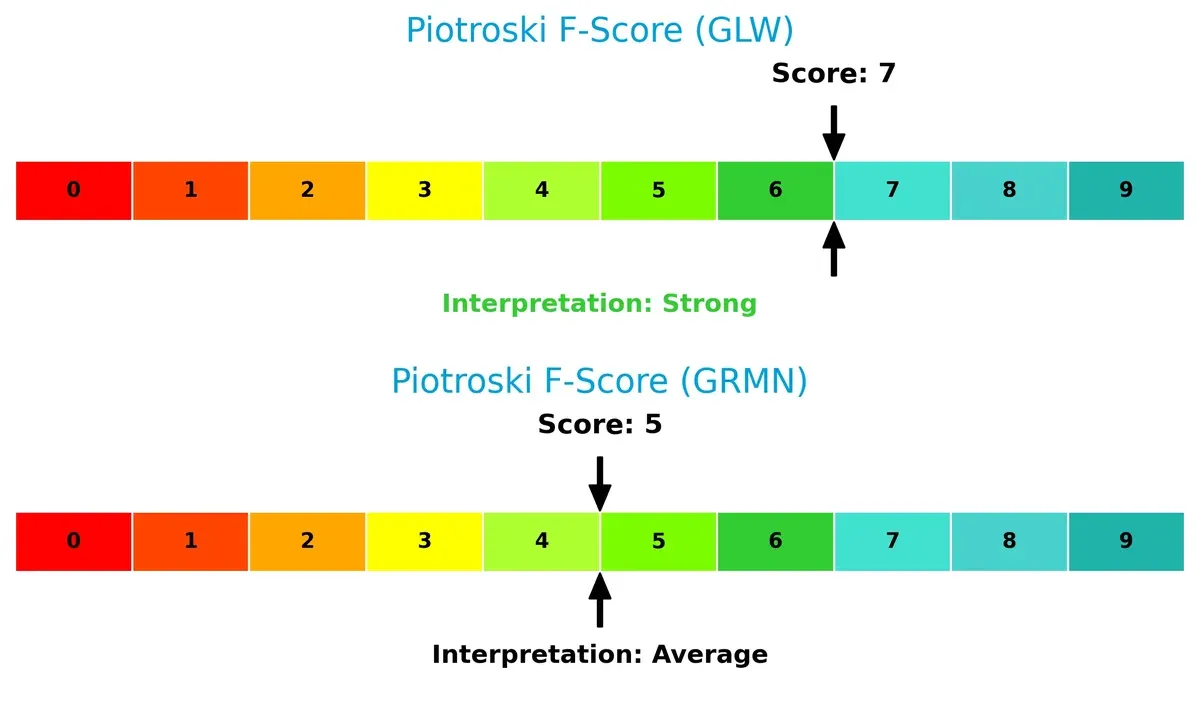
Financial Health: Quality of Operations
Corning’s Piotroski F-Score of 7 indicates strong financial health, outperforming Garmin’s average 5, suggesting Corning maintains better operational quality despite solvency concerns:
How are the two companies positioned?
This section dissects Corning and Garmin’s operational DNA by comparing revenue distribution and internal strengths and weaknesses. The goal is to confront their economic moats to reveal which model offers the most resilient competitive advantage today.
Revenue Segmentation: The Strategic Mix
This visual comparison dissects how Corning Incorporated and Garmin Ltd. diversify their income streams and where their primary sector bets lie:
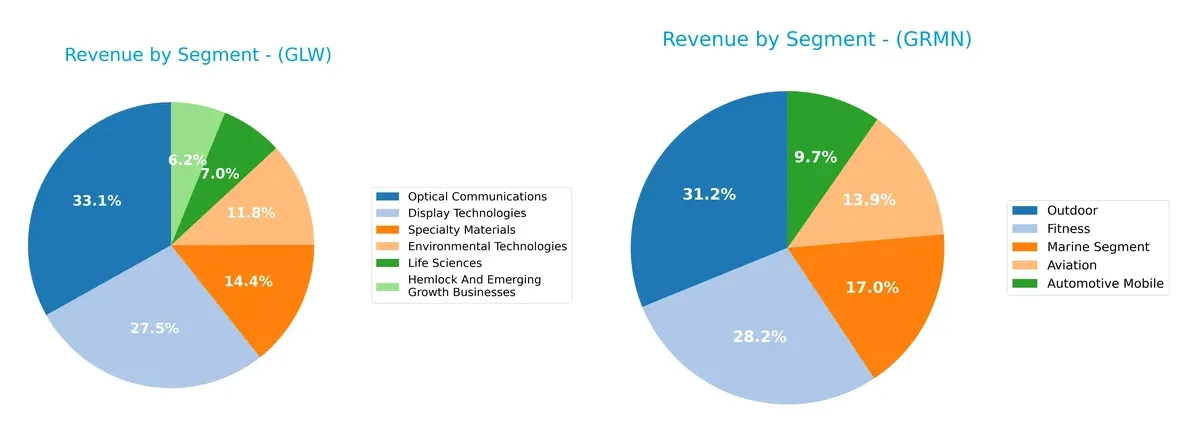
Corning leans heavily on Optical Communications at $4.7B and Display Technologies at $3.9B, anchoring its revenue in infrastructure and tech materials. Garmin shows a more balanced mix, with Outdoor at $2B and Fitness at $1.8B leading but no segment dwarfing others. Corning’s concentration signals strong ecosystem lock-in but higher risk; Garmin’s spread reduces volatility through diversified end markets.
Strengths and Weaknesses Comparison
This table compares the Strengths and Weaknesses of Corning Incorporated and Garmin Ltd.:
Corning Incorporated Strengths
- Diversified revenue streams across Optical Communications, Display Technologies, and Environmental Technologies
- Favorable net margin of 10.21% supports solid profitability
- Balanced leverage with favorable debt-to-assets at 27.23%
- Global presence with strong Asia Pacific and North America sales
Garmin Ltd. Strengths
- Strong profitability with net margin at 22.41% and ROIC at 16.28%
- Very low debt and excellent interest coverage support financial stability
- Favorable asset turnover and fixed asset efficiency
- Diversified product segments including Fitness, Outdoor, and Marine
Corning Incorporated Weaknesses
- High valuation multiples with PE at 47.18 and PB at 6.38 indicate potential overpricing
- Return on equity and ROIC slightly below cost of capital, signaling neutral capital efficiency
- Moderate asset turnover may limit growth leverage
- Concentrated market exposure in Asia Pacific and North America
Garmin Ltd. Weaknesses
- Unfavorable current ratio of 3.54 suggests potential liquidity management issues
- PE and PB ratios remain elevated, reducing margin of safety
- Heavy reliance on Americas region for revenue
- Some product segments less diversified compared to Corning
Corning’s strengths lie in its broad product and geographic diversification, though valuation and capital efficiency require caution. Garmin excels in profitability and financial health but faces challenges in geographic concentration and liquidity metrics. Both companies demonstrate distinct strategic profiles that influence their market positions.
The Moat Duel: Analyzing Competitive Defensibility
A structural moat is the only reliable shield protecting long-term profits from relentless competitive erosion in today’s dynamic markets:
Corning Incorporated: Intangible Asset Powerhouse
Corning’s moat centers on proprietary glass technologies and scale, driving stable margins near 15% EBIT and robust revenue growth. New product innovations in specialty materials could deepen this advantage in 2026.
Garmin Ltd.: Ecosystem-Driven Network Effects
Garmin’s strength lies in its integrated device-software ecosystem, sustaining a high 25% EBIT margin. Unlike Corning, Garmin’s value creation is stable with modest ROIC growth, leveraging expansion in fitness and aviation segments.
Proprietary Tech vs. Ecosystem Lock-in: The Moat Face-off
Garmin maintains a wider moat with ROIC exceeding WACC by 7.7%, signaling efficient capital use and consistent value creation. Corning, despite growing profitability, currently sheds value with ROIC below WACC. Garmin stands better poised to defend market share through its sticky ecosystem.
Which stock offers better returns?
The past year reveals pronounced bullish momentum for both stocks, highlighted by sharp price gains and distinct acceleration phases in their market trajectories.
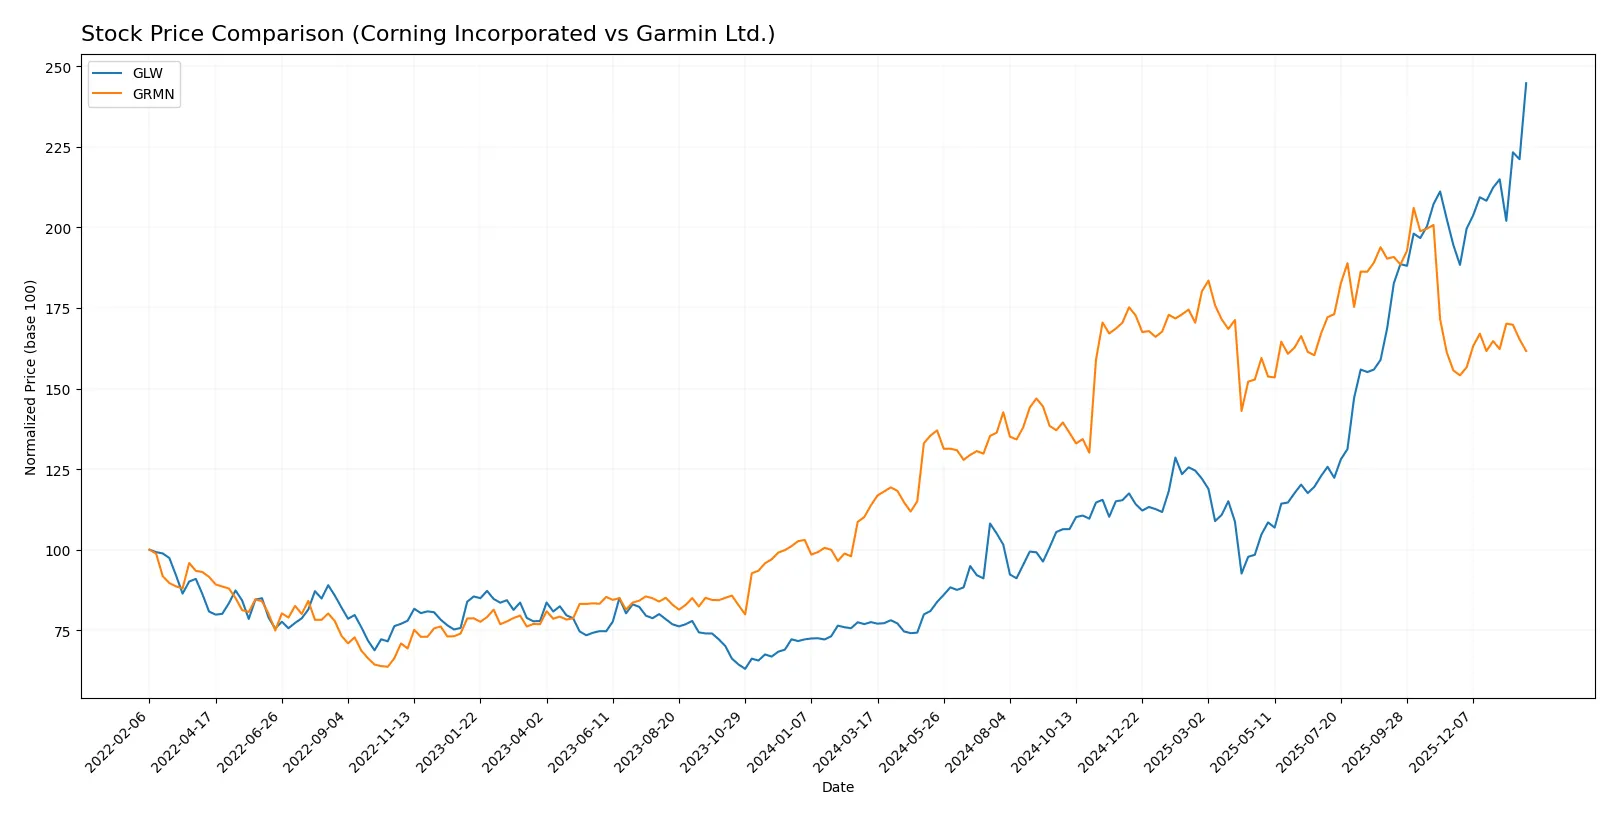
Trend Comparison
Corning Incorporated (GLW) surged 215.65% over the last 12 months, showing a strong bullish trend with price acceleration and notable volatility at an 18.43 standard deviation. The stock hit a high of 103.25 and a low of 31.27.
Garmin Ltd. (GRMN) rose 42.06% in the same period, also bullish with accelerating momentum but higher volatility, indicated by a 28.33 standard deviation. Its price ranged from 139.52 to 257.06.
GLW outperformed GRMN by a wide margin, delivering the highest market return and more sustained upward price acceleration over the past year.
Target Prices
Analysts present a robust target consensus for Corning Incorporated and Garmin Ltd., reflecting positive growth expectations.
| Company | Target Low | Target High | Consensus |
|---|---|---|---|
| Corning Incorporated | 100 | 130 | 116.63 |
| Garmin Ltd. | 193 | 310 | 240 |
The target consensus for Corning at 116.63 sits well above its current price of 103.25, signaling upside potential. Garmin’s consensus target of 240 also exceeds its current 201.64 price, indicating strong analyst confidence despite recent volatility.

Don’t Let Luck Decide Your Entry Point
Optimize your entry points with our advanced ProRealTime indicators. You’ll get efficient buy signals with precise price targets for maximum performance. Start outperforming now!
How do institutions grade them?
Corning Incorporated Grades
The following table summarizes recent grades from major institutions for Corning Incorporated.
| Grading Company | Action | New Grade | Date |
|---|---|---|---|
| Morgan Stanley | Maintain | Equal Weight | 2026-01-29 |
| Mizuho | Maintain | Outperform | 2026-01-29 |
| Citigroup | Maintain | Buy | 2026-01-29 |
| Susquehanna | Maintain | Positive | 2026-01-29 |
| JP Morgan | Maintain | Overweight | 2026-01-28 |
| Citigroup | Maintain | Buy | 2026-01-12 |
| Morgan Stanley | Maintain | Equal Weight | 2025-12-17 |
| UBS | Maintain | Buy | 2025-11-21 |
| Citigroup | Maintain | Buy | 2025-10-29 |
| JP Morgan | Maintain | Overweight | 2025-10-29 |
Garmin Ltd. Grades
The following table summarizes recent grades from major institutions for Garmin Ltd.
| Grading Company | Action | New Grade | Date |
|---|---|---|---|
| Barclays | Upgrade | Equal Weight | 2026-01-16 |
| Tigress Financial | Maintain | Strong Buy | 2025-12-19 |
| Longbow Research | Upgrade | Buy | 2025-12-03 |
| Morgan Stanley | Maintain | Underweight | 2025-10-30 |
| Barclays | Maintain | Underweight | 2025-10-30 |
| Tigress Financial | Maintain | Strong Buy | 2025-09-30 |
| Morgan Stanley | Maintain | Underweight | 2025-09-19 |
| Morgan Stanley | Maintain | Underweight | 2025-07-31 |
| Barclays | Maintain | Underweight | 2025-07-31 |
| JP Morgan | Maintain | Neutral | 2025-07-17 |
Which company has the best grades?
Corning Incorporated consistently receives buy and outperform ratings from top firms, signaling steady confidence. Garmin Ltd.’s grades show mixed sentiment, with notable underweight ratings offset by strong buy calls. Corning’s stronger overall grades suggest more institutional conviction, potentially influencing investor interest and market perception.
Risks specific to each company
The following categories identify the critical pressure points and systemic threats facing both firms in the 2026 market environment:
1. Market & Competition
Corning Incorporated
- Faces intense competition in display technologies and specialty materials, with pressure from rapid tech innovation.
Garmin Ltd.
- Competes across diverse segments including fitness and aviation electronics, requiring constant product innovation to maintain market share.
2. Capital Structure & Debt
Corning Incorporated
- Maintains moderate leverage (D/E 0.71), manageable debt-to-assets at 27.23%, and solid interest coverage of 7.11.
Garmin Ltd.
- Exhibits very low debt (D/E 0.02), minimal debt-to-assets (1.69%), and infinite interest coverage, signaling strong balance sheet stability.
3. Stock Volatility
Corning Incorporated
- Beta of 1.125 indicates slightly higher volatility than market average, increasing risk in turbulent markets.
Garmin Ltd.
- Beta near 1.013 suggests stock volatility closely tracks the market, offering relatively stable price movements.
4. Regulatory & Legal
Corning Incorporated
- Subject to regulations in environmental technologies and specialty materials sectors, with potential costs from compliance.
Garmin Ltd.
- Faces regulatory scrutiny mainly in aviation and communications, where certification and safety standards are stringent.
5. Supply Chain & Operations
Corning Incorporated
- Complex global supply chain for glass and optical components susceptible to raw material price fluctuations and disruptions.
Garmin Ltd.
- Depends on diverse manufacturing locations and component sourcing, vulnerable to logistics delays and semiconductor shortages.
6. ESG & Climate Transition
Corning Incorporated
- Environmental technologies segment exposes it to both risks and opportunities amid tightening emissions standards globally.
Garmin Ltd.
- ESG risks moderate; focus on sustainable product design and operations critical to meet evolving investor and regulatory expectations.
7. Geopolitical Exposure
Corning Incorporated
- US-based but operates worldwide, exposed to trade tensions and tariffs impacting supply chains and sales.
Garmin Ltd.
- Swiss-based with global footprint; geopolitical risks include currency fluctuations and regional regulatory barriers.
Which company shows a better risk-adjusted profile?
Garmin faces its biggest risk in market competition due to its broad segment exposure requiring relentless innovation. Corning’s primary concern lies in supply chain complexity and raw material volatility. Garmin’s strong balance sheet, superior profitability, and safer Altman Z-Score support a better risk-adjusted profile. Corning’s higher leverage and valuation multiples add risk despite stable operations. The recent surge in raw material costs heightens Corning’s operational risk, reinforcing Garmin as the safer investment in 2026.
Final Verdict: Which stock to choose?
Corning Incorporated’s superpower lies in its accelerating revenue growth paired with solid income quality. It operates with improving profitability despite a slight value destruction indicated by its ROIC below WACC. Its elevated valuation multiples and moderate financial leverage warrant caution. This stock suits aggressive growth portfolios willing to embrace cyclicality and execution risks.
Garmin Ltd. boasts a robust strategic moat through consistent value creation supported by a wide margin and high returns on capital. Its fortress-like balance sheet and stable profitability offer better financial safety compared to Corning. Garmin aligns well with GARP investors seeking steady growth with durable competitive advantages and lower volatility.
If you prioritize rapid expansion and are comfortable with higher valuation risk, Corning’s improving earnings trajectory might make it the compelling choice. However, if you seek stable cash generation and a stronger economic moat, Garmin offers better stability and a proven track record of value creation, commanding a premium for defensive qualities.
Disclaimer: Investment carries a risk of loss of initial capital. The past performance is not a reliable indicator of future results. Be sure to understand risks before making an investment decision.
Go Further
I encourage you to read the complete analyses of Corning Incorporated and Garmin Ltd. to enhance your investment decisions: