Home > Comparison > Technology > GLW vs FTV
The strategic rivalry between Corning Incorporated and Fortive Corporation shapes the technology hardware sector’s evolution. Corning, a diversified materials innovator, contrasts with Fortive’s focus on professional and engineered products, software, and services. This head-to-head pits Corning’s capital-intensive manufacturing against Fortive’s precision technology and software integration. This analysis aims to identify which company’s trajectory offers superior risk-adjusted returns for a diversified portfolio navigating the technology hardware landscape.
Table of contents
Companies Overview
Corning Incorporated and Fortive Corporation stand as pivotal players in the hardware and equipment sector, shaping industrial innovation.
Corning Incorporated: Global Leader in Specialty Glass and Optical Solutions
Corning dominates the technology hardware market through diversified segments including display technologies, optical communications, and specialty materials. Its revenue hinges on glass substrates for displays and optical fibers for communications. In 2026, Corning strategically emphasizes expanding its life sciences and environmental technologies businesses to capture emerging market demand.
Fortive Corporation: Specialist in Professional and Engineered Products
Fortive operates in the precision instruments and software space, generating revenue from connected reliability tools, calibration instruments, and healthcare solutions. Its 2026 focus lies in integrating software-driven services with hardware offerings to boost operational efficiency across manufacturing, healthcare, and industrial verticals.
Strategic Collision: Similarities & Divergences
Corning pursues a product innovation-driven strategy with a broad industrial base, while Fortive emphasizes software-enabled service integration. Both compete intensely in industrial hardware markets but diverge on business models—Corning builds on proprietary materials; Fortive leverages connected solutions. Their distinct investment profiles reflect Corning’s scale and R&D depth versus Fortive’s niche specialization and recurring revenue focus.
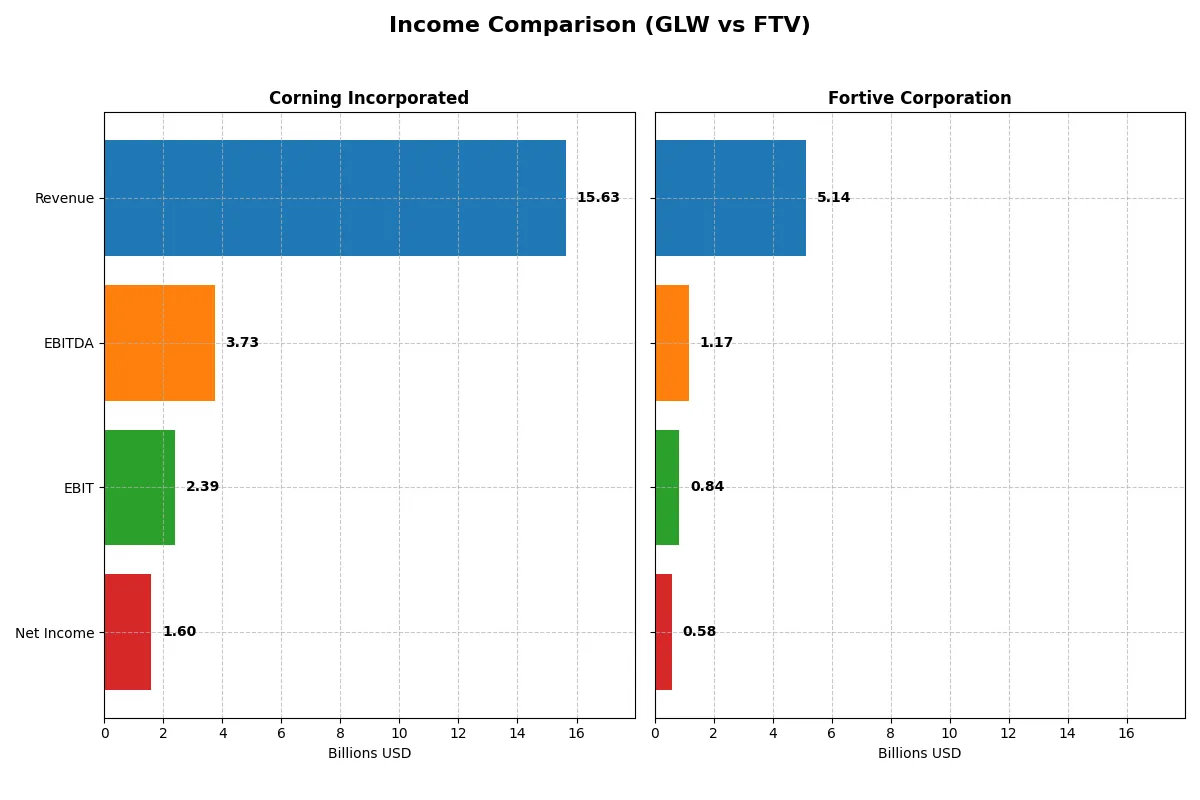
Income Statement Comparison
This data dissects the core profitability and scalability of both corporate engines to reveal who dominates the bottom line:
| Metric | Corning Incorporated (GLW) | Fortive Corporation (FTV) |
|---|---|---|
| Revenue | 15.6B | 5.14B |
| Cost of Revenue | 10.1B | 2.01B |
| Operating Expenses | 3.18B | 2.23B |
| Gross Profit | 5.51B | 3.13B |
| EBITDA | 3.74B | 1.17B |
| EBIT | 2.39B | 843M |
| Interest Expense | 336M | 121M |
| Net Income | 1.60B | 579M |
| EPS | 1.86 | 1.75 |
| Fiscal Year | 2025 | 2025 |
Income Statement Analysis: The Bottom-Line Duel
This income statement comparison reveals the true operational efficiency and profitability trends shaping each company’s financial engine.
Corning Incorporated Analysis
Corning’s revenue surged 19% to $15.6B in 2025, with net income tripling to $1.6B, signaling strong momentum. Its gross margin holds steady at 35%, while net margin rose to 10.2%, reflecting improved cost control and operating leverage. The company’s EBIT more than doubled, highlighting accelerating operational efficiency.
Fortive Corporation Analysis
Fortive posted $5.1B revenue in 2025, down 17% from prior year, with net income falling 30% to $579M. Despite a robust gross margin near 61%, net margin compressed to 11.3%, pressured by declining top line and shrinking EBIT. The decline in revenue and earnings marks a pause in Fortive’s prior growth trajectory.
Margin Resilience vs. Top-Line Growth
Corning demonstrates clear revenue and earnings growth with expanding margins, outperforming Fortive’s shrinking revenue base despite its superior gross margins. Corning’s rising EBIT and net income growth make it the fundamental winner in operational efficiency. Investors seeking momentum and profitability might find Corning’s profile more compelling in the current cycle.
Financial Ratios Comparison
These vital ratios act as a diagnostic tool to expose the underlying fiscal health, valuation premiums, and capital efficiency of the companies compared:
| Ratios | Corning Incorporated (GLW) | Fortive Corporation (FTV) |
|---|---|---|
| ROE | 13.52% | 8.98% |
| ROIC | 7.57% | 7.44% |
| P/E | 47.18 | 30.16 |
| P/B | 6.38 | 2.71 |
| Current Ratio | 1.59 | 0.71 |
| Quick Ratio | 1.04 | 0.58 |
| D/E | 0.71 | 0.50 |
| Debt-to-Assets | 27.23% | 27.31% |
| Interest Coverage | 6.94 | 7.54 |
| Asset Turnover | 0.50 | 0.44 |
| Fixed Asset Turnover | 1.05 | 19.06 |
| Payout ratio | 62.59% | 15.92% |
| Dividend yield | 1.33% | 0.53% |
| Fiscal Year | 2025 | 2025 |
Efficiency & Valuation Duel: The Vital Signs
Financial ratios act as a company’s DNA, uncovering hidden risks and revealing operational strengths critical for investment decisions.
Corning Incorporated
Corning shows a solid 13.5% ROE and a favorable 10.2% net margin, signaling decent profitability. However, its P/E at 47.2 and P/B at 6.4 mark the stock as stretched. Shareholders receive a modest 1.33% dividend yield, with the firm balancing returns and reinvestment into R&D for growth.
Fortive Corporation
Fortive posts an 11.3% net margin but a weaker 9.0% ROE, indicating less efficient equity use. Its P/E of 30.2 is high but more reasonable than Corning’s, while P/B stands neutral at 2.7. Dividend yield at 0.53% is low, reflecting reinvestment emphasis on growth rather than immediate payouts.
Premium Valuation vs. Operational Safety
Corning’s high valuation contrasts with Fortive’s more moderate multiples. Corning excels in profitability and liquidity, while Fortive offers better balance sheet leverage but weaker equity returns. Risk-tolerant investors may prefer Corning’s growth focus; conservative ones might lean toward Fortive’s operational prudence.
Which one offers the Superior Shareholder Reward?
I compare Corning Incorporated (GLW) and Fortive Corporation (FTV) on dividends, payout ratios, and buybacks. GLW yields 1.33% with a high 63% payout ratio, risking sustainability. FTV pays a lower 0.53% yield, with a conservative 16% payout, preserving free cash flow for growth. FTV’s aggressive buybacks and strong free cash flow coverage (90%) contrast with GLW’s moderate buyback and weaker free cash flow yield. I see FTV’s distribution model as more sustainable and value-accretive. In 2026, FTV offers a superior total shareholder return profile.
Comparative Score Analysis: The Strategic Profile
The radar chart reveals the fundamental DNA and trade-offs of Corning Incorporated and Fortive Corporation, highlighting their financial strengths and weaknesses:
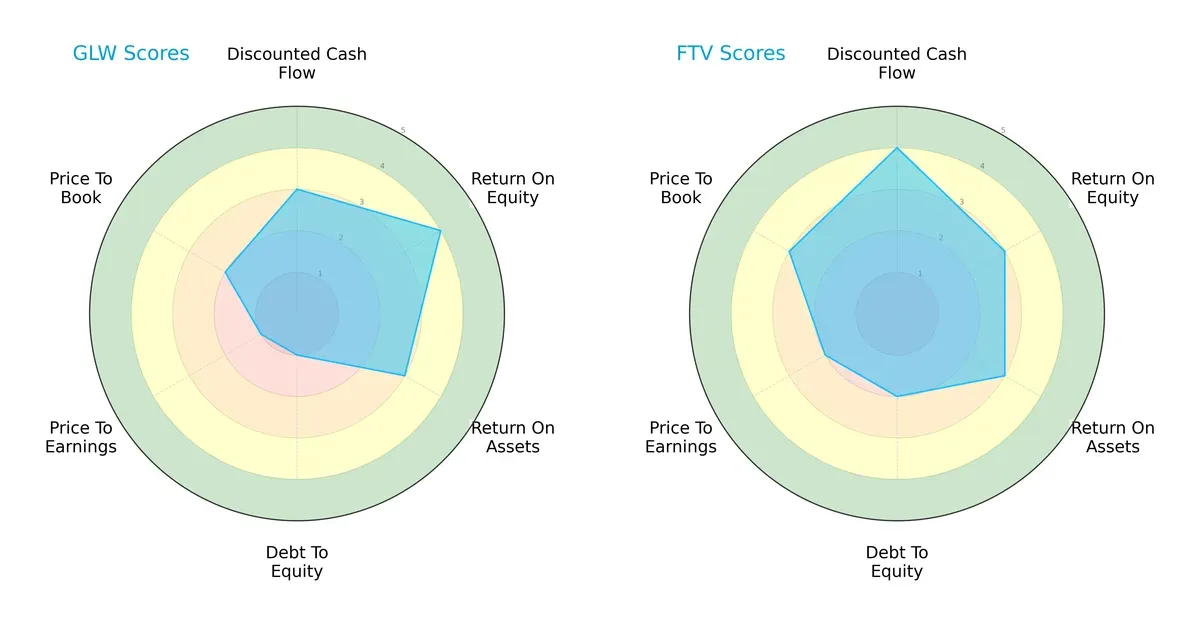
Corning shows strength in return on equity (4) but struggles with debt (1) and valuation metrics (PE: 1, PB: 2). Fortive presents a more balanced profile, scoring moderately to favorably across DCF (4), ROE (3), and valuation (PE: 2, PB: 3). I observe Fortive relies less on a single edge and manages leverage better, while Corning’s profile depends heavily on equity returns but carries notable financial risk.
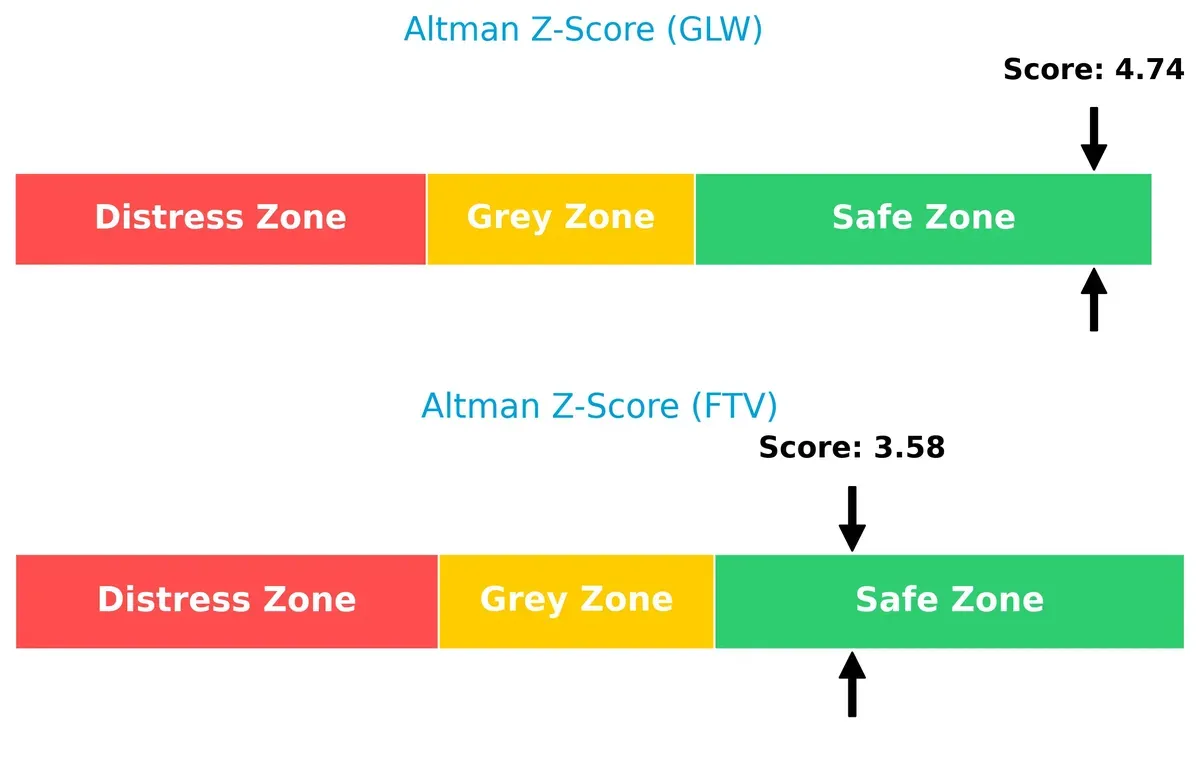
Bankruptcy Risk: Solvency Showdown
Corning’s Altman Z-Score of 4.74 surpasses Fortive’s 3.58, placing both in the safe zone but with Corning showing a stronger cushion against bankruptcy risk in this cycle:
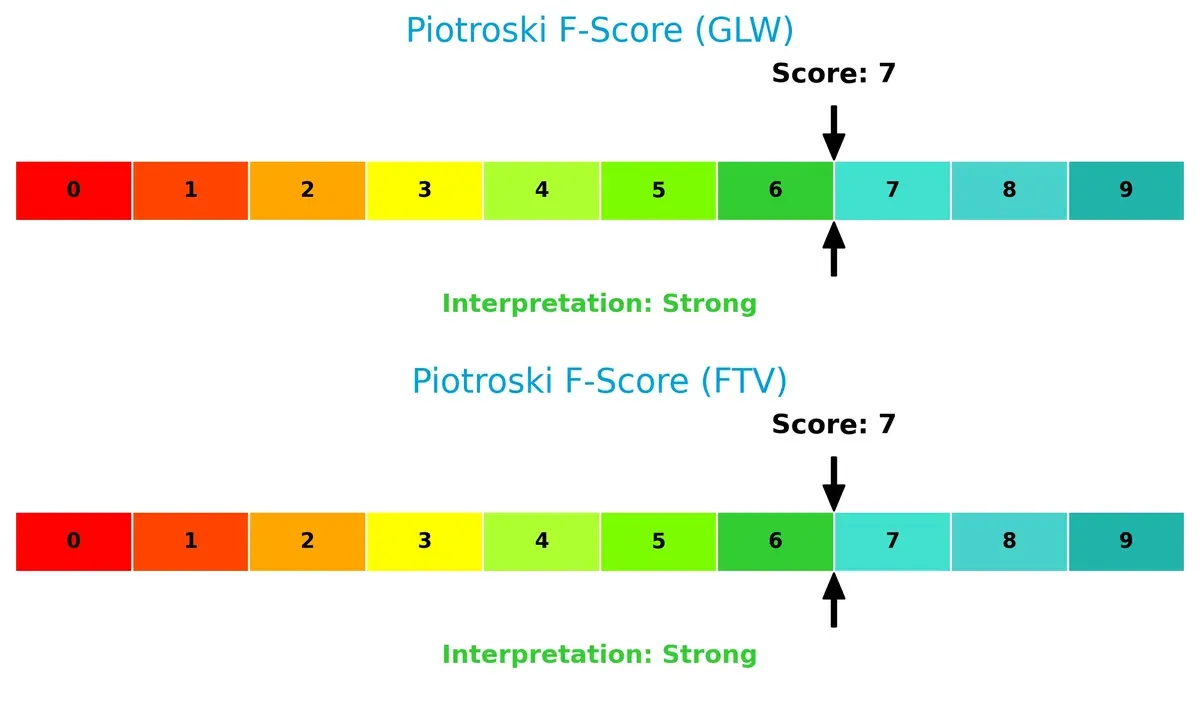
Financial Health: Quality of Operations
Both companies share a Piotroski F-Score of 7, indicating strong financial health. Neither shows red flags, but this score leaves room for improvement to reach peak operational quality:
How are the two companies positioned?
This section dissects the operational DNA of Corning and Fortive by comparing their revenue distribution by segment and internal dynamics. The final objective confronts their economic moats to identify which model offers the most resilient competitive advantage today.
Revenue Segmentation: The Strategic Mix
This visual comparison dissects how Corning Incorporated and Fortive Corporation diversify their income streams and where their primary sector bets lie:
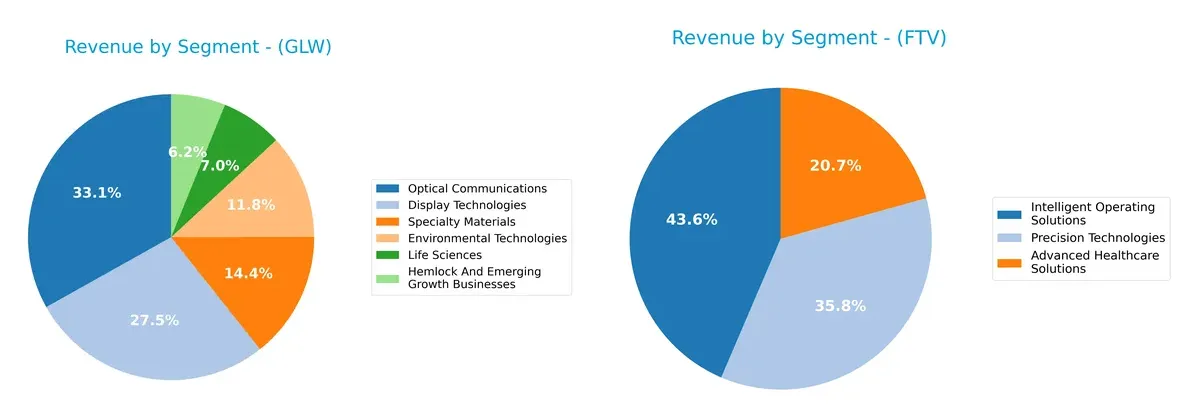
Corning anchors its revenue in Optical Communications at $4.66B and Display Technologies at $3.87B, showing a dual-giant focus. Fortive’s top segment, Intelligent Operating Solutions, tallies $2.71B but pairs closely with Precision Technologies at $2.23B and Advanced Healthcare Solutions at $1.29B, revealing a more balanced mix. Corning’s concentration suggests reliance on infrastructure dominance, while Fortive’s spread mitigates concentration risk through diverse industrial and healthcare exposure.
Strengths and Weaknesses Comparison
This table compares the Strengths and Weaknesses of Corning Incorporated and Fortive Corporation:
Corning Incorporated Strengths
- Diversified revenue streams across multiple technology and materials segments
- Favorable net margin at 10.21%
- Strong liquidity ratios with current ratio 1.59 and quick ratio 1.04
- Low debt-to-assets at 27.23% and high interest coverage of 7.11
- Significant global presence, especially Asia Pacific at $7.31B
- Neutral return metrics (ROE 13.52%, ROIC 7.57%)
Fortive Corporation Strengths
- Favorable net margin at 11.26%
- Low debt-to-equity ratio of 0.5 indicating conservative leverage
- Strong fixed asset turnover at 19.06 indicating efficient asset use
- Solid interest coverage of 7.0
- Diversified product segments including healthcare and precision technologies
- Large U.S. market exposure at $3.37B
Corning Incorporated Weaknesses
- Unfavorable valuation multiples with PE 47.18 and PB 6.38
- Neutral ROIC (7.57%) slightly below WACC (8.61%) indicating limited capital efficiency
- Moderate asset turnover at 0.5 limits sales productivity
- Neutral ROE at 13.52% may warrant improvement
- Market share concentrated in Asia Pacific and North America only
Fortive Corporation Weaknesses
- Unfavorable ROE at 8.98% below industry benchmarks
- Weak liquidity with low current ratio 0.71 and quick ratio 0.58
- Unfavorable PE at 30.16 and low dividend yield 0.53%
- Unfavorable asset turnover at 0.44 limits revenue generation efficiency
- Geographic concentration with heavy reliance on U.S. and limited China exposure
Corning shows strength in liquidity and global diversification but faces valuation and capital efficiency challenges. Fortive excels in asset utilization and leverage but must address liquidity and return on equity weaknesses for balanced growth.
The Moat Duel: Analyzing Competitive Defensibility
A structural moat alone protects long-term profits from relentless competition erosion. Let’s dissect the competitive moats of Corning and Fortive:
Corning Incorporated: Intangible Assets Powerhouse
Corning’s moat stems from proprietary glass and specialty material technologies. This advantage yields stable margins and rising ROIC, though value destruction persists. Expansion in display and life sciences could deepen its moat in 2026.
Fortive Corporation: Diversified Operational Excellence
Fortive leans on a broad portfolio of engineered products and software, creating switching costs and recurring revenue. Its ROIC trend outpaces Corning’s, despite recent revenue declines. Fortive’s software integration offers growth potential to disrupt markets.
Verdict: Technology-Driven Intangibles vs. Operational Scale
Both firms show slightly unfavorable ROIC vs. WACC but growing profitability trends. Corning’s intangible asset moat is deeper, linked to innovation and patents. Fortive’s operational scale and software offer flexibility but narrower defensibility. Corning stands better poised to defend its market share long term.
Which stock offers better returns?
Over the past 12 months, Corning Incorporated’s stock surged notably, while Fortive Corporation’s shares declined, reflecting contrasting trading dynamics and investor sentiment.
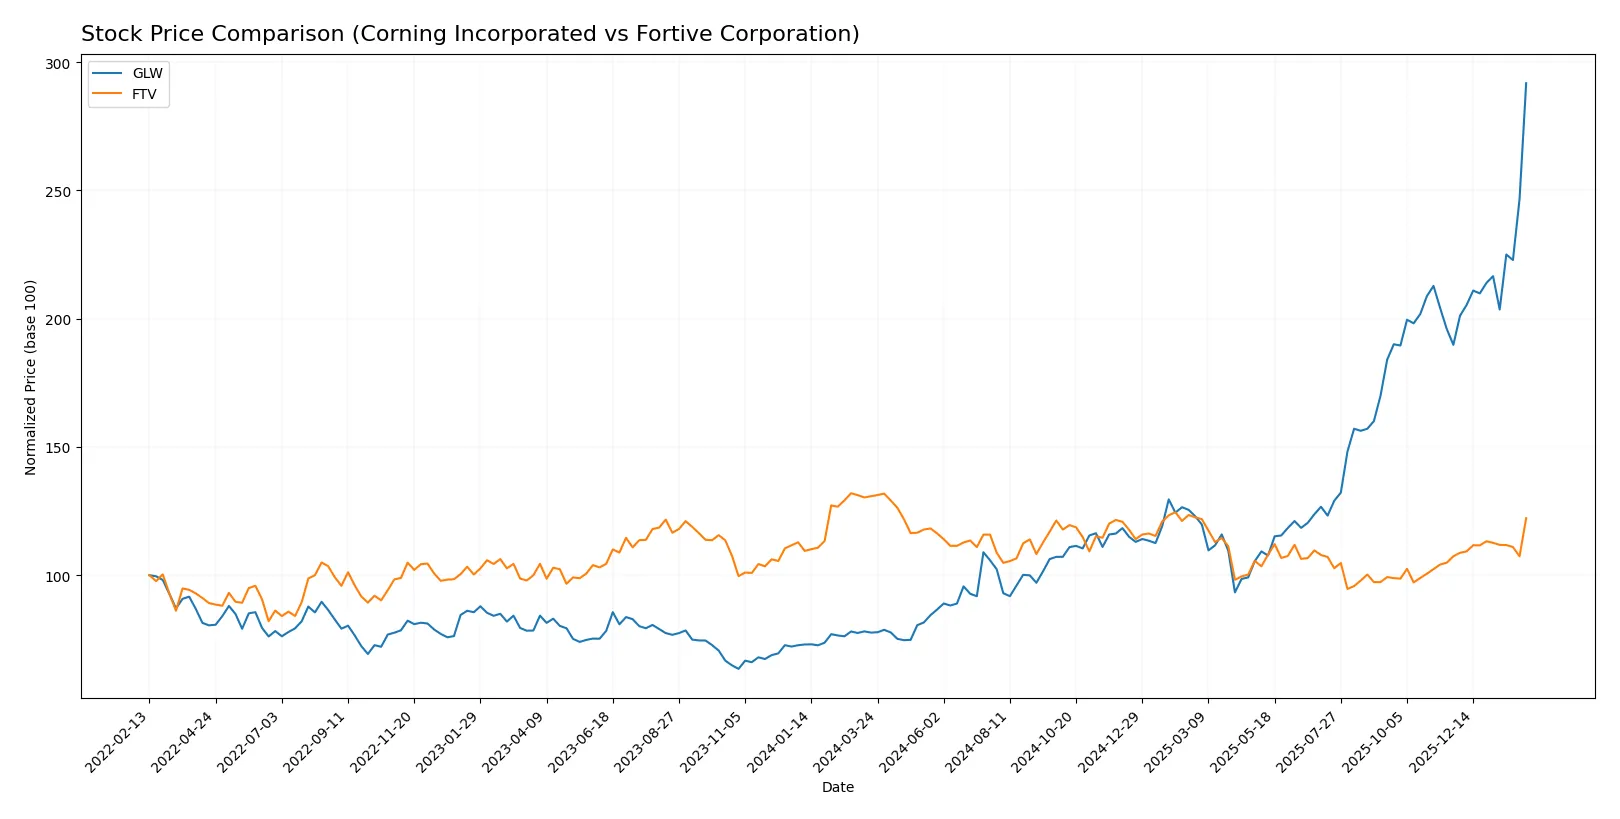
Trend Comparison
Corning Incorporated’s stock price gained 275.76% over the past year, showing a clear bullish trend with accelerating momentum and a high volatility level (std deviation 19.5). It reached a peak of 122.16 and a low of 31.27.
Fortive Corporation’s stock price fell 6.53% in the same period, indicating a bearish trend despite accelerating movement. Its volatility is moderate (std deviation 4.16), with prices ranging between 46.55 and 64.82.
Comparing the two, Corning Incorporated outperformed Fortive Corporation significantly, delivering the highest market performance over the past year.
Target Prices
Analysts present a clear target consensus for Corning Incorporated and Fortive Corporation, reflecting measured growth expectations.
| Company | Target Low | Target High | Consensus |
|---|---|---|---|
| Corning Incorporated | 100 | 130 | 116.63 |
| Fortive Corporation | 51 | 70 | 59.83 |
The target consensus for Corning sits slightly below its current price of 122.16, suggesting moderate upside risk. Fortive’s consensus aligns closely with its current 60.12 price, indicating market expectations are fairly priced.

Don’t Let Luck Decide Your Entry Point
Optimize your entry points with our advanced ProRealTime indicators. You’ll get efficient buy signals with precise price targets for maximum performance. Start outperforming now!
How do institutions grade them?
Corning Incorporated Grades
Here are the recent institutional grades for Corning Incorporated from major firms:
| Grading Company | Action | New Grade | Date |
|---|---|---|---|
| Susquehanna | maintain | Positive | 2026-01-29 |
| Morgan Stanley | maintain | Equal Weight | 2026-01-29 |
| Mizuho | maintain | Outperform | 2026-01-29 |
| Citigroup | maintain | Buy | 2026-01-29 |
| JP Morgan | maintain | Overweight | 2026-01-28 |
Fortive Corporation Grades
Here are the recent institutional grades for Fortive Corporation from major firms:
| Grading Company | Action | New Grade | Date |
|---|---|---|---|
| Wells Fargo | maintain | Equal Weight | 2026-02-05 |
| RBC Capital | maintain | Sector Perform | 2026-02-05 |
| Citigroup | maintain | Neutral | 2026-02-05 |
| JP Morgan | downgrade | Underweight | 2026-01-16 |
| Mizuho | downgrade | Underperform | 2026-01-05 |
Which company has the best grades?
Corning holds stronger grades overall, with multiple “Buy,” “Outperform,” and “Overweight” ratings. Fortive shows a mix of “Equal Weight” and downgrades to “Underweight” and “Underperform.” This disparity may influence investor confidence and portfolio positioning.
Risks specific to each company
The following categories identify the critical pressure points and systemic threats facing both firms in the 2026 market environment:
1. Market & Competition
Corning Incorporated
- Operates in highly competitive display and optical markets; faces innovation pressure from tech advances.
Fortive Corporation
- Competes in diversified professional tools and software sectors; must maintain differentiation in niche markets.
2. Capital Structure & Debt
Corning Incorporated
- Moderate debt-to-equity ratio (0.71), interest coverage favorable at 7.11; stable but with some leverage risk.
Fortive Corporation
- Lower debt-to-equity (0.5) and strong interest coverage at 7.0; more conservative balance sheet stance.
3. Stock Volatility
Corning Incorporated
- Beta moderately elevated at 1.124, suggesting above-market volatility risks.
Fortive Corporation
- Beta near 1.033, indicating volatility closer to market average and potentially less risk.
4. Regulatory & Legal
Corning Incorporated
- Exposure to environmental regulations in emissions control products; legal risks tied to global manufacturing.
Fortive Corporation
- Faces compliance demands in healthcare and industrial software sectors; regulatory changes could affect product certifications.
5. Supply Chain & Operations
Corning Incorporated
- Complex global supply chain for glass and optical components; sensitive to raw material price swings.
Fortive Corporation
- Relies on advanced manufacturing and software delivery; supply chain disruptions could impact service contracts.
6. ESG & Climate Transition
Corning Incorporated
- Environmental tech segment supports emissions control, positioning well; climate risks in manufacturing energy use remain.
Fortive Corporation
- Focus on safety and environmental software offers ESG opportunities; operational carbon footprint and transition risks persist.
7. Geopolitical Exposure
Corning Incorporated
- Global footprint exposes it to trade tensions, especially US-China tech restrictions.
Fortive Corporation
- International presence in industrial and healthcare markets; geopolitical shifts could disrupt supply and customer relationships.
Which company shows a better risk-adjusted profile?
Corning’s principal risk lies in market competition and high valuation multiples, which pressure future returns. Fortive’s most significant risk is its weak liquidity ratios, posing short-term financial stress. Despite Corning’s higher leverage, its stronger liquidity and Altman Z-Score indicate a safer financial zone. Fortive’s lower beta and more conservative debt profile moderate its risk. I observe that Corning’s elevated P/E and P/B ratios heighten valuation risk, while Fortive’s subpar current ratios raise red flags on operational liquidity. Overall, Corning presents a slightly better risk-adjusted profile given its financial stability amid valuation concerns.
Final Verdict: Which stock to choose?
Corning Incorporated’s superpower lies in its robust cash generation and accelerating revenue growth. Its slightly unfavorable valuation multiples serve as a point of vigilance amid market optimism. This stock fits well in aggressive growth portfolios seeking exposure to a company with improving profitability and strong operational momentum.
Fortive Corporation offers a strategic moat through its high-margin, recurring revenue model and efficient capital allocation. Despite weaker liquidity ratios compared to Corning, it provides a more stable risk profile supported by consistent free cash flow yields. Fortive suits GARP investors prioritizing steady cash flow and reasonable valuation.
If you prioritize dynamic growth backed by strong income statement momentum, Corning outshines with accelerating revenue and EPS growth. However, if you seek better stability and a defensive edge with recurring revenue, Fortive offers a compelling scenario despite recent headwinds. Both companies show improving profitability but require careful monitoring of valuation and liquidity risks.
Disclaimer: Investment carries a risk of loss of initial capital. The past performance is not a reliable indicator of future results. Be sure to understand risks before making an investment decision.
Go Further
I encourage you to read the complete analyses of Corning Incorporated and Fortive Corporation to enhance your investment decisions: