Home > Comparison > Technology > GLW vs FN
The strategic rivalry between Corning Incorporated and Fabrinet defines the current trajectory of the optical hardware sector. Corning, a diversified technology leader, integrates advanced materials and life sciences with optical communications. Fabrinet, a precision contract manufacturer, focuses on specialized optical and electro-mechanical components for global OEMs. This analysis contrasts their capital allocation and growth models to determine which offers superior risk-adjusted returns for a diversified portfolio.
Table of contents
Companies Overview
Corning Incorporated and Fabrinet both play pivotal roles in the hardware and equipment sector, shaping global technology supply chains with their specialized products.
Corning Incorporated: Pioneer in Specialty Glass and Optical Technologies
Corning dominates in specialty glass and optical communications. Its core revenue comes from glass substrates for displays and optical fibers. In 2026, it focuses strategically on expanding advanced materials for mobile electronics and environmental technologies, leveraging its diversified product mix to meet evolving tech demands.
Fabrinet: Precision Manufacturing Specialist for Optical Components
Fabrinet excels in precision optical and electro-mechanical manufacturing. It generates revenue by assembling complex optical modules for data communication and industrial lasers. In 2026, Fabrinet targets advanced packaging and integration services to support high-speed network and semiconductor industries, emphasizing customization and supply chain efficiency.
Strategic Collision: Similarities & Divergences
Both firms serve the optical hardware market but differ in approach. Corning builds a vertically integrated portfolio centered on proprietary glass technologies, while Fabrinet offers contract manufacturing with a focus on customization and assembly. Their competition centers on network infrastructure components. Corning’s broad product base contrasts with Fabrinet’s specialized manufacturing model, defining distinct risk and growth profiles for investors.
Income Statement Comparison
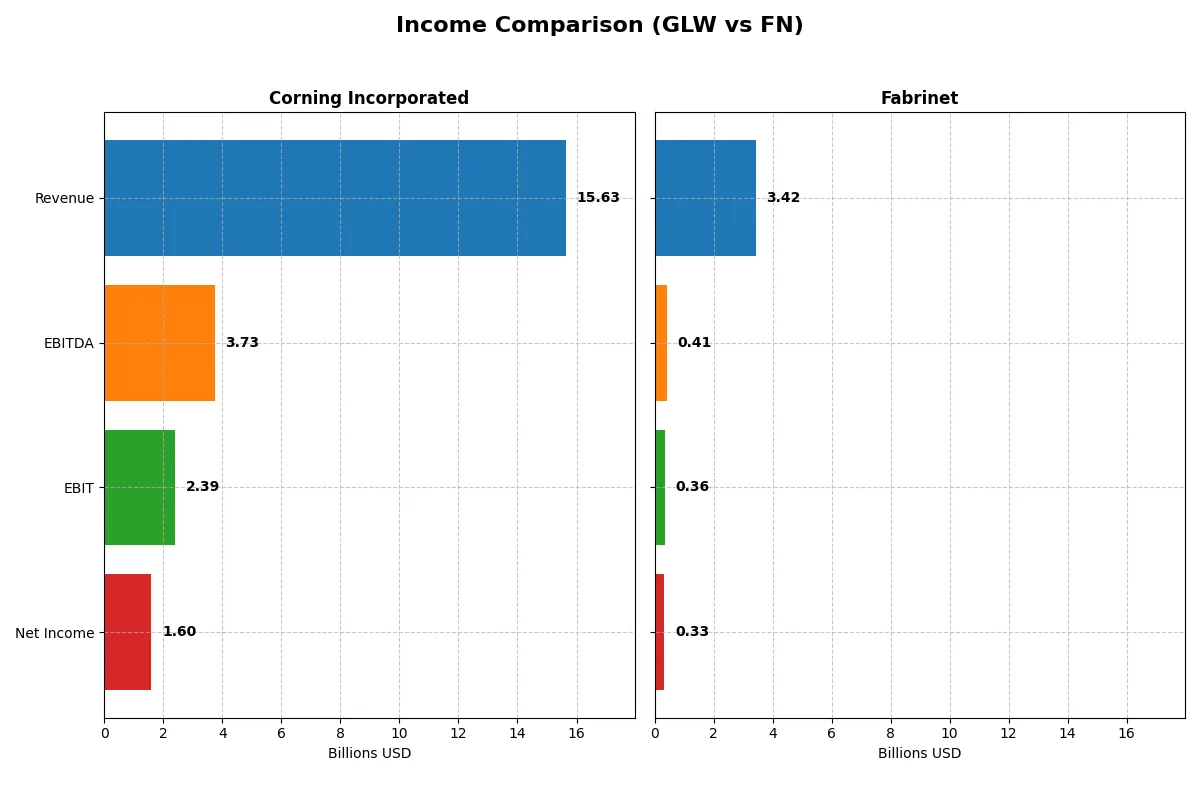
This data dissects the core profitability and scalability of both corporate engines to reveal who dominates the bottom line:
| Metric | Corning Incorporated (GLW) | Fabrinet (FN) |
|---|---|---|
| Revenue | 15.6B | 3.42B |
| Cost of Revenue | 10.1B | 3.01B |
| Operating Expenses | 3.18B | 89M |
| Gross Profit | 5.51B | 413M |
| EBITDA | 3.74B | 409M |
| EBIT | 2.39B | 355M |
| Interest Expense | 336M | 0 |
| Net Income | 1.60B | 333M |
| EPS | 1.86 | 9.23 |
| Fiscal Year | 2025 | 2025 |
Income Statement Analysis: The Bottom-Line Duel
This income statement comparison reveals which company converts revenue into profit most efficiently and sustains growth momentum.
Corning Incorporated Analysis
Corning’s revenue climbed steadily from $14.1B in 2021 to $15.6B in 2025, showing a 19% rise in the last year. Net income fluctuated, peaking at $1.9B in 2021, dipping in 2023, then surging to $1.6B in 2025. Gross margin remains robust near 35%, while net margin improved to 10.2% in 2025, signaling enhanced operational efficiency and scale benefits.
Fabrinet Analysis
Fabrinet grew revenue from $1.9B in 2021 to $3.4B in 2025, posting an 18.6% increase last year alone. Net income more than doubled over five years, reaching $333M in 2025, despite a slight net margin dip to 9.7%. Gross margin is modest at 12%, but EBIT margin at 10.4% shows tight cost control and steady profitability improvement.
Margin Strength vs. Growth Trajectory
Corning commands superior gross and net margins, reflecting strong pricing power and operational leverage. Fabrinet, however, outpaces Corning in revenue and net income growth, showcasing dynamic expansion. For investors, Corning’s profile suits those prioritizing margin resilience, while Fabrinet appeals to growth-focused portfolios seeking accelerating earnings.
Financial Ratios Comparison
These vital ratios act as a diagnostic tool to expose the underlying fiscal health, valuation premiums, and capital efficiency of the companies compared below:
| Ratios | Corning Inc. (GLW) | Fabrinet (FN) |
|---|---|---|
| ROE | 13.52% | 16.78% |
| ROIC | 7.40% | 15.01% |
| P/E | 47.18 | 32.02 |
| P/B | 6.38 | 5.37 |
| Current Ratio | 1.59 | 3.00 |
| Quick Ratio | 1.04 | 2.28 |
| D/E | 0.71 | 0.00 |
| Debt-to-Assets | 27.23% | 0.19% |
| Interest Coverage | 6.78 | 0.00 |
| Asset Turnover | 0.50 | 1.21 |
| Fixed Asset Turnover | 1.05 | 8.85 |
| Payout ratio | 62.59% | 0% |
| Dividend yield | 1.33% | 0% |
| Fiscal Year | 2025 | 2025 |
Efficiency & Valuation Duel: The Vital Signs
Financial ratios act as a company’s DNA, uncovering hidden risks and operational strengths that shape shareholder value and market positioning.
Corning Incorporated
Corning shows solid profitability with a 13.5% ROE and a favorable 10.2% net margin. Its valuation appears stretched, trading at a high P/E of 47.2 and P/B of 6.4. The firm delivers modest shareholder returns with a 1.33% dividend yield, balancing dividend payments and ongoing R&D investment at 7.1% of revenue.
Fabrinet
Fabrinet impresses with a robust 16.8% ROE and 15.0% ROIC, signaling operational efficiency. Its valuation is also elevated, with a P/E of 32.0 and P/B of 5.4, though less stretched than Corning. The company reinvests cash flow into growth, reflecting zero dividends but strong balance sheet metrics and a superior asset turnover of 1.21.
Premium Valuation vs. Operational Efficiency
Fabrinet offers a better ratio balance, boasting higher returns on equity and invested capital with more favorable leverage and liquidity. Corning’s premium valuation and dividend provide income but carry valuation risk. Growth-oriented investors may prefer Fabrinet’s efficiency profile, while income seekers might lean toward Corning’s yield.
Which one offers the Superior Shareholder Reward?
Corning Incorporated (GLW) pays dividends with a modest 1.33% yield and a high payout ratio near 63%, signaling a mature distribution policy. Its free cash flow covers dividends comfortably, supporting sustainability. GLW also runs steady buybacks, enhancing total returns. Fabrinet (FN) pays no dividends, opting to reinvest robust free cash flow (5.7/share) into growth and acquisitions. FN’s buybacks are minimal but its low debt and high cash position allow flexibility. Historically, Corning’s yield plus buyback combo suits income-focused investors, while Fabrinet appeals to growth investors. In 2026, I find GLW’s balanced distribution model offers a superior total shareholder reward for income and stability, whereas FN’s reinvestment strategy targets long-term capital gains with higher risk.
Comparative Score Analysis: The Strategic Profile
The radar chart reveals the fundamental DNA and trade-offs of Corning Incorporated and Fabrinet, highlighting their financial strengths and vulnerabilities:
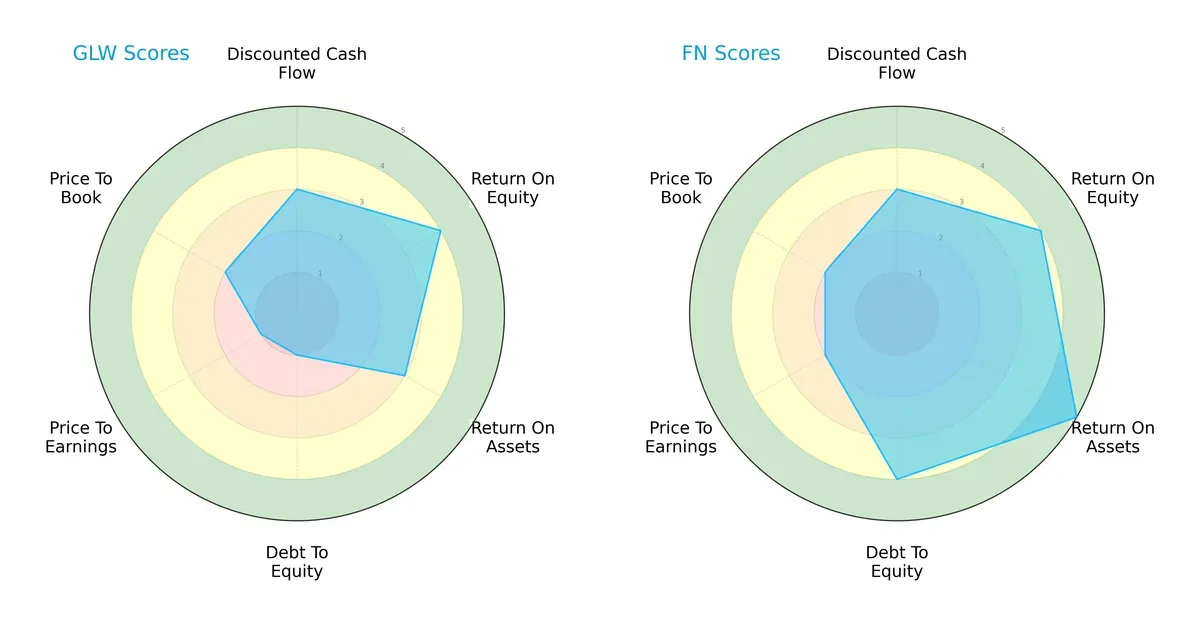
Corning shows strong ROE but struggles with high debt and poor valuation scores, indicating financial risk. Fabrinet delivers a more balanced profile, excelling in ROA and maintaining prudent leverage. Fabrinet’s diversified strength contrasts with Corning’s reliance on equity efficiency amid valuation challenges.
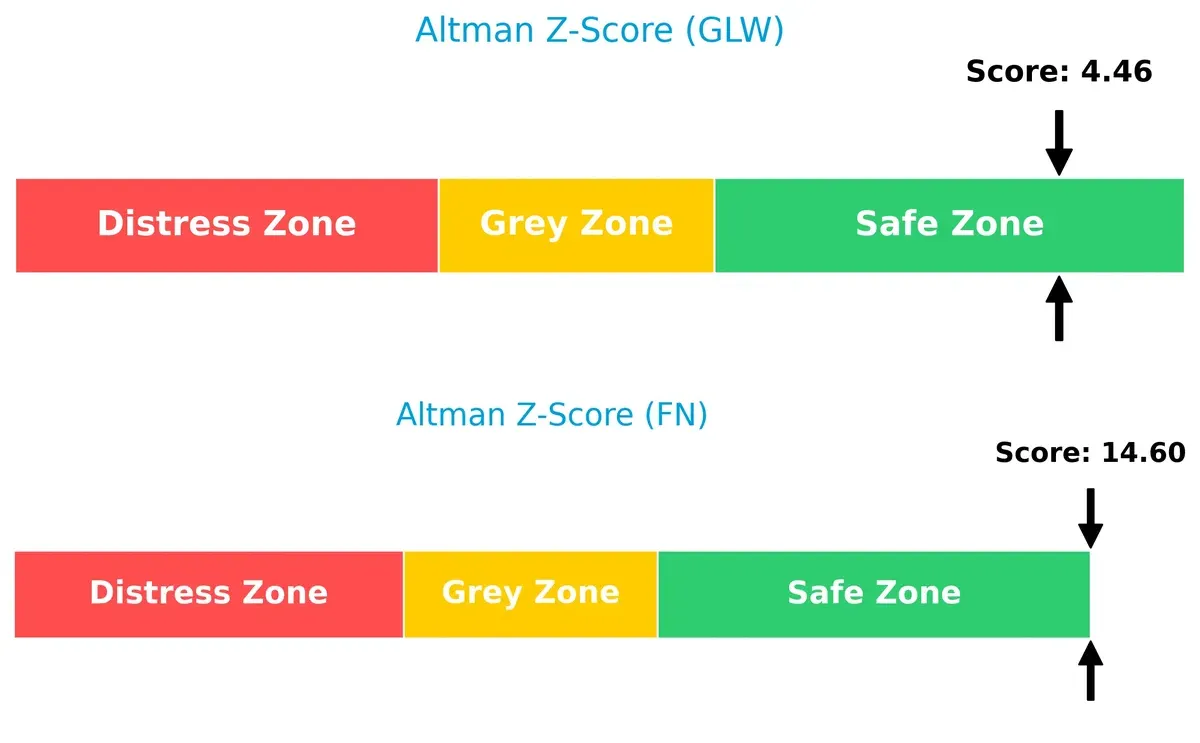
Bankruptcy Risk: Solvency Showdown
The Altman Z-Score gap signals Fabrinet’s superior solvency, far above Corning’s already safe level, underscoring Fabrinet’s robust financial footing for long-term survival in this cycle:
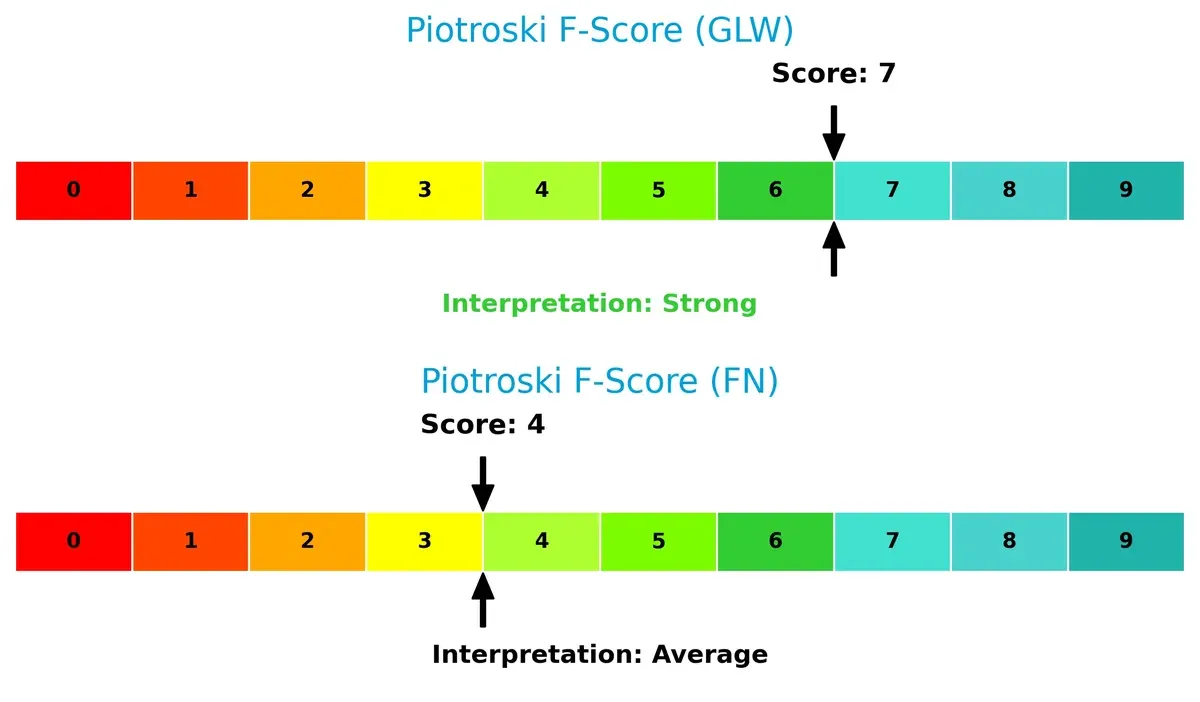
Financial Health: Quality of Operations
Corning’s Piotroski F-Score of 7 points to strong operational quality, outperforming Fabrinet’s moderate score of 4, which raises caution about its internal financial consistency:
How are the two companies positioned?
This section dissects GLW and FN’s operational DNA by comparing their revenue distribution and internal dynamics. The goal is to confront their economic moats and identify which business model offers the most resilient competitive advantage today.
Revenue Segmentation: The Strategic Mix
The following visual comparison dissects how Corning Incorporated and Fabrinet diversify their income streams and where their primary sector bets lie:
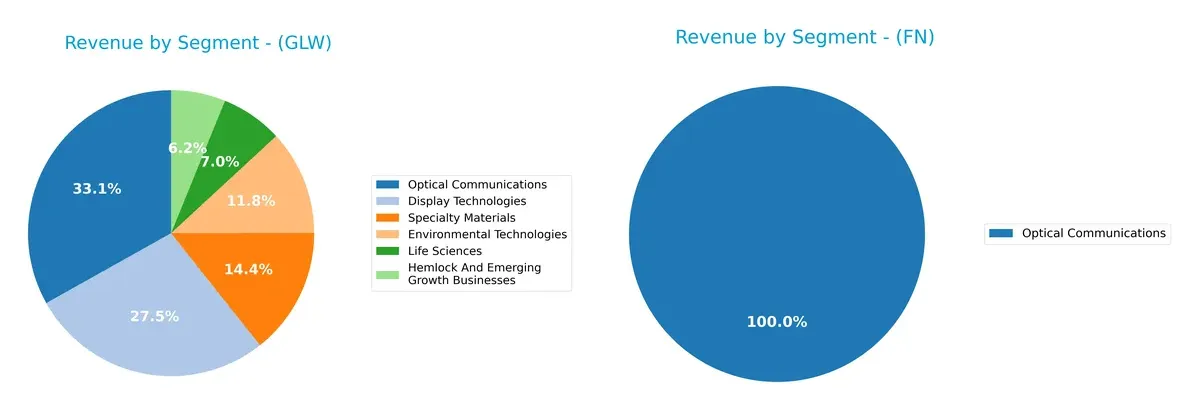
Corning Incorporated displays a well-diversified portfolio, with Optical Communications leading at $4.66B, followed by Display Technologies at $3.87B, and Specialty Materials at $2.02B. In contrast, Fabrinet relies almost entirely on Optical Communications, generating $2.62B in 2025, showing little diversification. Corning’s mix reduces concentration risk and leverages infrastructure dominance, while Fabrinet’s narrow focus may boost specialization but increases vulnerability to sector shifts.
Strengths and Weaknesses Comparison
This table compares the strengths and weaknesses of Corning Incorporated and Fabrinet:
Corning Incorporated Strengths
- Diverse product segments including Optical Communications, Display Technologies, and Specialty Materials
- Strong global presence with revenue from Asia Pacific, North America, and Europe
- Favorable liquidity ratios indicating solid short-term financial health
Fabrinet Strengths
- Favorable profitability metrics with ROE and ROIC above WACC
- High asset turnover demonstrating efficient use of assets
- Strong liquidity and zero debt signaling financial flexibility
Corning Incorporated Weaknesses
- High valuation multiples with unfavorable P/E and P/B ratios
- Neutral profitability ratios like ROE and ROIC close to WACC
- Moderate leverage with debt-to-equity ratio at 0.71
Fabrinet Weaknesses
- Unfavorable dividend yield at 0% potentially limiting investor income
- Unfavorable P/E and P/B ratios indicating high valuation
- Less diversified product portfolio focused mainly on Optical Communications
Corning’s broad product and geographic diversification supports resilience but faces valuation pressure. Fabrinet excels in profitability and asset efficiency but shows concentration risks and limited shareholder returns. Both companies reflect strengths aligned with their strategic focus and areas warranting investor caution.
The Moat Duel: Analyzing Competitive Defensibility
A true structural moat shields long-term profits from relentless competitive pressures. Let’s dissect the sources behind their defenses:
Corning Incorporated: Intangible Assets and Innovation Backbone
Corning’s moat stems from its proprietary glass technologies and R&D leadership. This delivers stable margins and a rising ROIC trend despite value erosion. New optical and specialty materials markets in 2026 could deepen this moat if innovation pace sustains.
Fabrinet: Operational Excellence and Scale Advantage
Fabrinet’s moat relies on precision manufacturing and customer intimacy, contrasting Corning’s tech focus. It commands superior ROIC well above WACC with expanding profitability. Growth in optical packaging and emerging sensor markets offer solid runway for further moat expansion.
Innovation Edge vs. Operational Mastery: The Moat Showdown
Fabrinet holds the deeper moat with ROIC exceeding WACC by 6.3%, signaling genuine value creation and durable profitability gains. Corning’s intangible asset moat is eroding but shows promise through innovation-driven margin stability. Fabrinet appears better positioned to defend and grow its market share in 2026.
Which stock offers better returns?
The past year shows strong upward momentum for both stocks, with Corning Incorporated exhibiting a sharper gain and stable buyer dominance compared to Fabrinet’s higher volatility and steadier ascent.
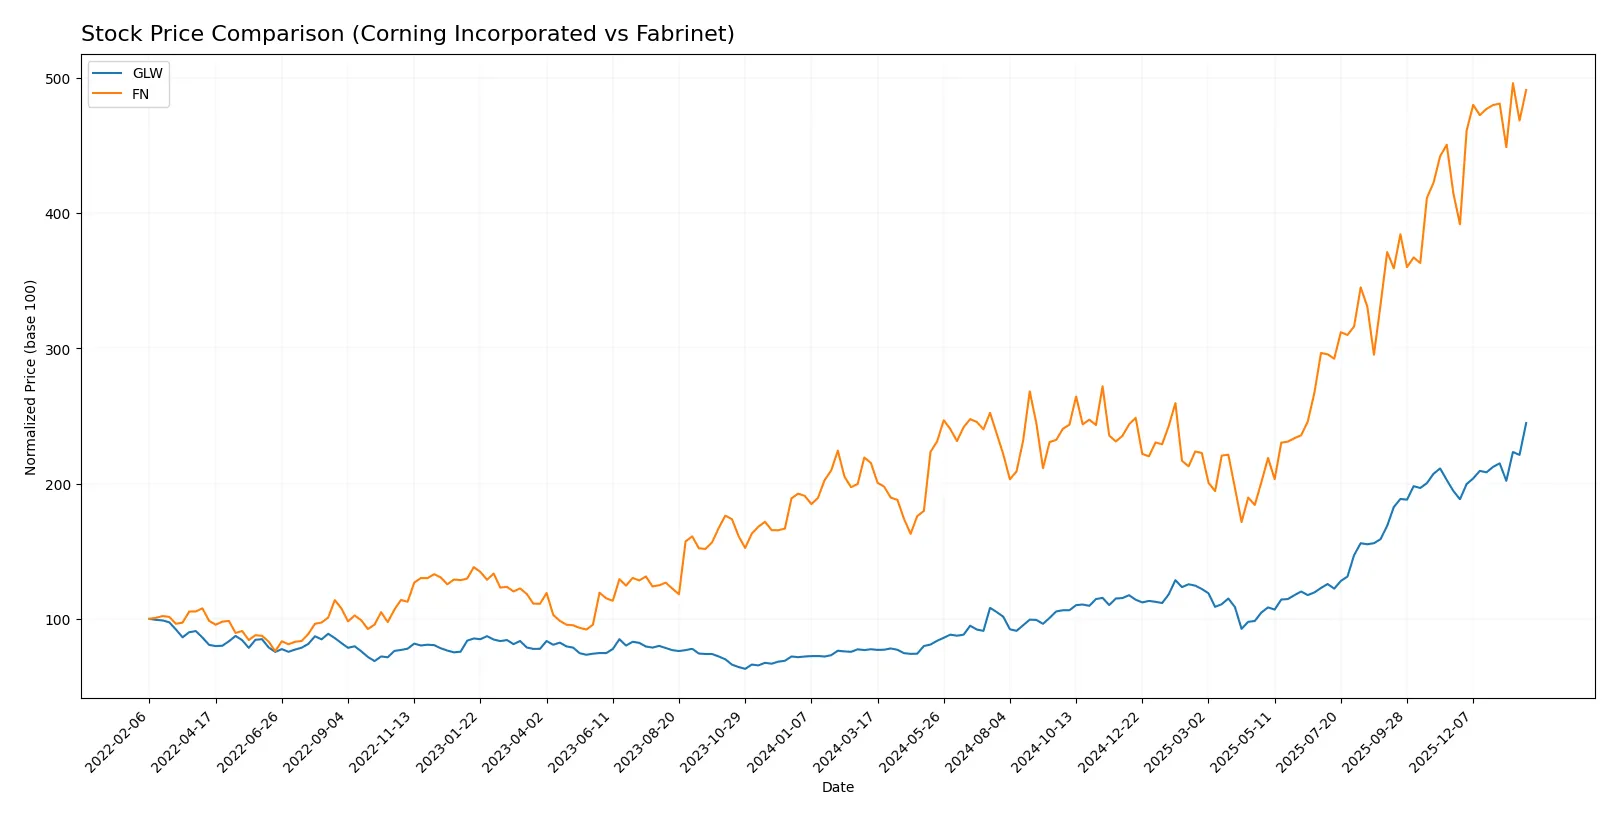
Trend Comparison
Corning Incorporated (GLW) posted a 216% increase over 12 months, confirming a bullish trend with accelerating momentum and moderate volatility (std dev 18.43). Its price range spanned from 31.27 to 103.25.
Fabrinet (FN) rose 128% over the same period, also bullish with acceleration but far higher volatility (std dev 90.27). Prices fluctuated between 162.32 and 494.45, reflecting wider swings.
GLW outperformed FN in total price appreciation, exhibiting steadier growth and less volatility, making it the stronger performer among the two over the last year.
Target Prices
Analysts show a bullish consensus for Corning Incorporated and Fabrinet, reflecting confidence in both firms’ growth potential.
| Company | Target Low | Target High | Consensus |
|---|---|---|---|
| Corning Incorporated | 100 | 130 | 116.63 |
| Fabrinet | 537 | 600 | 569 |
The consensus target for Corning stands about 13% above its current 103.25 USD price, signaling moderate upside. Fabrinet’s target exceeds its current 489.44 USD price by roughly 16%, indicating strong analyst optimism.

Don’t Let Luck Decide Your Entry Point
Optimize your entry points with our advanced ProRealTime indicators. You’ll get efficient buy signals with precise price targets for maximum performance. Start outperforming now!
How do institutions grade them?
This section compares recent institutional grades for Corning Incorporated and Fabrinet:
Corning Incorporated Grades
The following table summarizes Corning Incorporated’s latest grades from major institutions.
| Grading Company | Action | New Grade | Date |
|---|---|---|---|
| Morgan Stanley | Maintain | Equal Weight | 2026-01-29 |
| Mizuho | Maintain | Outperform | 2026-01-29 |
| Citigroup | Maintain | Buy | 2026-01-29 |
| Susquehanna | Maintain | Positive | 2026-01-29 |
| JP Morgan | Maintain | Overweight | 2026-01-28 |
Fabrinet Grades
The following table shows Fabrinet’s recent institutional grades.
| Grading Company | Action | New Grade | Date |
|---|---|---|---|
| Susquehanna | Maintain | Positive | 2026-01-22 |
| Barclays | Upgrade | Overweight | 2026-01-14 |
| Needham | Maintain | Buy | 2025-11-04 |
| Rosenblatt | Maintain | Buy | 2025-11-04 |
| JP Morgan | Maintain | Overweight | 2025-11-04 |
Which company has the best grades?
Fabrinet consistently receives stronger grades, including multiple Buy and Overweight ratings. Corning shows a mix of Equal Weight and Outperform grades. Fabrinet’s superior consensus could signal higher confidence from analysts, potentially influencing investor sentiment more positively.
Risks specific to each company
The following categories identify the critical pressure points and systemic threats facing both firms in the 2026 market environment:
1. Market & Competition
Corning Incorporated
- Faces intense competition in display technologies and specialty materials, requiring constant innovation.
Fabrinet
- Operates in niche optical manufacturing with advanced capabilities but faces rising competition from tech suppliers.
2. Capital Structure & Debt
Corning Incorporated
- Moderate leverage (D/E 0.71) with favorable debt-to-assets (27.2%) and solid interest coverage (7.11x).
Fabrinet
- Virtually no debt (D/E 0.0), exceptionally strong balance sheet, and infinite interest coverage.
3. Stock Volatility
Corning Incorporated
- Beta of 1.125 shows slightly higher volatility than the market.
Fabrinet
- Beta of 1.035 indicates near-market volatility, lower risk from price swings.
4. Regulatory & Legal
Corning Incorporated
- Exposure to global regulatory environments across multiple sectors, including environmental and life sciences.
Fabrinet
- Faces regulatory scrutiny mainly in manufacturing standards across Asia-Pacific and US markets.
5. Supply Chain & Operations
Corning Incorporated
- Complex global supply chain sensitive to raw material costs and geopolitical disruptions.
Fabrinet
- Relies on precision manufacturing with concentrated supplier bases, vulnerable to regional disruptions.
6. ESG & Climate Transition
Corning Incorporated
- Active in environmental technologies but must manage emissions and sustainable materials transition.
Fabrinet
- ESG focus less pronounced; sustainability efforts are emerging but not yet a core differentiator.
7. Geopolitical Exposure
Corning Incorporated
- Significant US-centric operations with global sales, moderate exposure to trade tensions.
Fabrinet
- Based in Cayman Islands, manufacturing in Asia-Pacific, highly exposed to China-US geopolitical frictions.
Which company shows a better risk-adjusted profile?
Corning’s primary risk lies in market competition and complex supply chains, while Fabrinet’s standout risk is geopolitical exposure due to its Asia-Pacific footprint. Fabrinet’s pristine balance sheet and superior operational efficiency provide a better risk-adjusted profile. Recent data reveals Fabrinet’s zero debt and high asset turnover sharply contrast with Corning’s leverage and valuation concerns, underscoring Fabrinet’s stronger financial resilience amid 2026 uncertainties.
Final Verdict: Which stock to choose?
Corning Incorporated’s superpower lies in its resilient operational efficiency and strong income growth momentum. Despite a slightly unfavorable valuation and a cautionary moat signal, its improving profitability offers a compelling angle. It suits portfolios targeting steady growth with moderate risk tolerance.
Fabrinet commands a durable competitive moat driven by exceptional capital efficiency and near-debt-free balance sheet. Its robust return metrics and financial stability present a safer profile than Corning. Fabrinet fits well in portfolios focused on quality growth with an emphasis on capital preservation.
If you prioritize operational resilience and aggressive growth potential, Corning Incorporated appears compelling due to its accelerating profitability and income strength. However, if you seek financial stability combined with a durable competitive advantage, Fabrinet offers better stability and a stronger moat. Both present analytical scenarios worth consideration based on your risk appetite and investment horizon.
Disclaimer: Investment carries a risk of loss of initial capital. The past performance is not a reliable indicator of future results. Be sure to understand risks before making an investment decision.
Go Further
I encourage you to read the complete analyses of Corning Incorporated and Fabrinet to enhance your investment decisions: