Home > Comparison > Technology > CRWV vs VRSN
The strategic rivalry between CoreWeave, Inc. and VeriSign, Inc. defines the competitive landscape of the technology infrastructure sector. CoreWeave operates as a cutting-edge cloud platform specializing in GPU compute for AI workloads, while VeriSign commands a legacy role securing internet navigation through domain registry services. This analysis contrasts rapid innovation against established stability to identify which trajectory offers superior risk-adjusted returns for diversified portfolios.
Table of contents
Companies Overview
CoreWeave and VeriSign both hold pivotal roles in the technology infrastructure sector, shaping the backbone of digital services.
CoreWeave, Inc. Class A Common Stock: Cloud Infrastructure for GenAI Workloads
CoreWeave dominates the cloud infrastructure space, specializing in scaling and acceleration for GenAI workloads. Its core revenue comes from GPU and CPU compute, storage, and managed services tailored for AI model training and rendering. In 2026, CoreWeave focuses strategically on expanding its computing platform to meet surging demand for AI and VFX workloads.
VeriSign, Inc.: Internet Infrastructure and Domain Registry Leader
VeriSign leads as a domain name registry and internet infrastructure provider, securing global internet navigation. It generates revenue through managing authoritative domain services for .com, .net, and other key domains, while also maintaining internet root servers. VeriSign’s 2026 strategy centers on enhancing internet security and infrastructure resiliency to support global e-commerce stability.
Strategic Collision: Similarities & Divergences
Both companies power critical digital infrastructure but diverge sharply in focus. CoreWeave pursues a compute-heavy, AI-driven cloud platform, whereas VeriSign secures internet navigation through domain registry and root server operations. Their battleground lies in infrastructure dominance, yet CoreWeave targets compute scale, and VeriSign prioritizes internet security. This contrast defines CoreWeave’s growth-driven risk profile versus VeriSign’s stable, defensive stance.
Income Statement Comparison
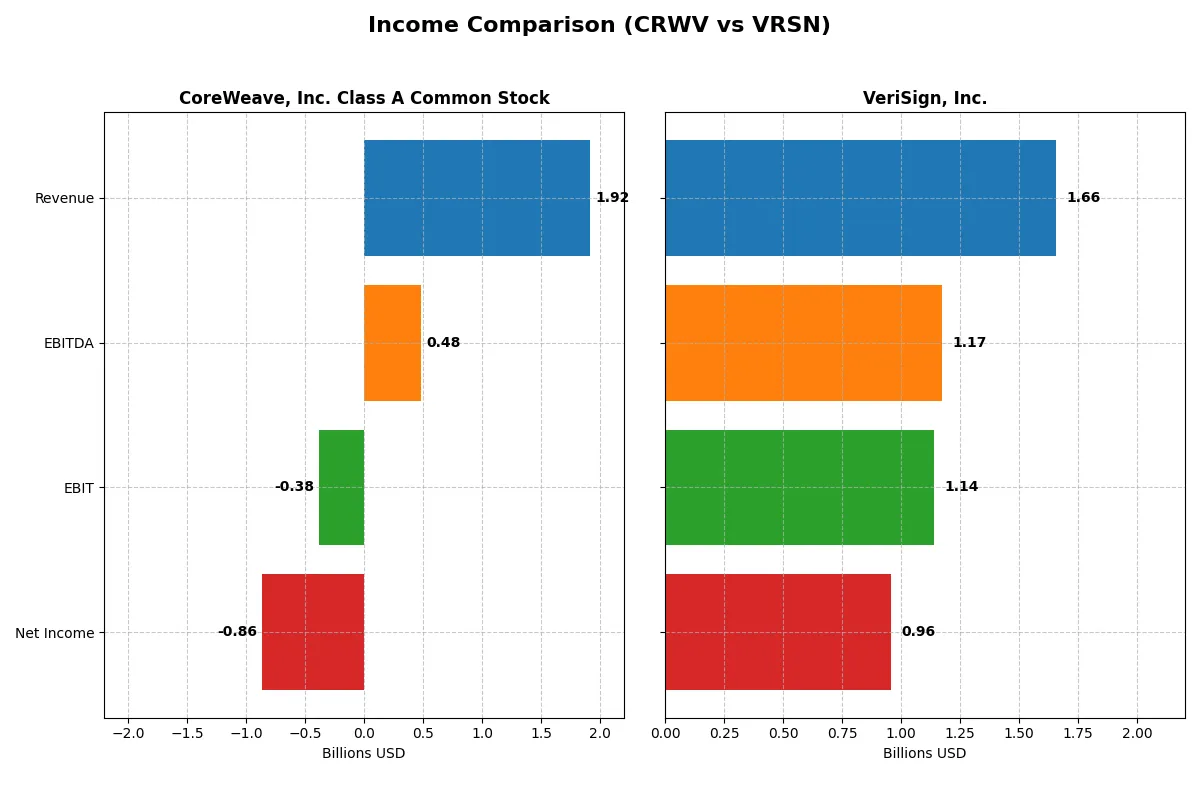
This table dissects the core profitability and scalability of both corporate engines to reveal who dominates the bottom line:
| Metric | CoreWeave (CRWV) | VeriSign (VRSN) |
|---|---|---|
| Revenue | 1.92B | 1.66B |
| Cost of Revenue | 493M | 196M |
| Operating Expenses | 1.10B | 339M |
| Gross Profit | 1.42B | 1.46B |
| EBITDA | 480M | 1.17B |
| EBIT | -383M | 1.14B |
| Interest Expense | 361M | 77M |
| Net Income | -863M | 956M |
| EPS | -2.33 | 8.83 |
| Fiscal Year | 2024 | 2025 |
Income Statement Analysis: The Bottom-Line Duel
The income statement comparison reveals the core efficiency and profitability drivers behind each company’s performance.
CoreWeave, Inc. Class A Common Stock Analysis
CoreWeave’s revenue surged impressively to 1.92B in 2024 from just 23M in 2023, showing rapid top-line expansion. Gross margin remains strong at 74%, but the net margin suffers a heavy loss of -45%, reflecting high interest expenses and operating inefficiencies. Despite growth momentum, the net loss widened to -937M, signaling ongoing profitability challenges.
VeriSign, Inc. Analysis
VeriSign delivers steady revenue growth, reaching 1.66B in 2025, up from 1.56B in 2024. It sustains a robust gross margin of 88% and an impressive net margin near 58%, demonstrating strong operational control. EBIT and net income expanded moderately, with net income hitting 956M in 2025, evidencing consistent profitability and efficient capital allocation.
Margin Strength vs. Growth Struggles
VeriSign clearly leads with superior margin quality and consistent profit growth, boasting industry-leading net margins above 50%. CoreWeave’s explosive revenue growth contrasts sharply with persistent net losses driven by high interest costs and negative EBIT margins. For investors, VeriSign’s stable profit profile offers a more attractive risk-return balance compared to CoreWeave’s high-growth but unprofitable trajectory.
Financial Ratios Comparison
These vital ratios act as a diagnostic tool to expose the underlying fiscal health, valuation premiums, and capital efficiency of the companies compared below:
| Ratios | CoreWeave (CRWV) | VeriSign (VRSN) |
|---|---|---|
| ROE | 2.09% | -0.65% |
| ROIC | 2.08% | -1.52% |
| P/E | -18.73 | 23.49 |
| P/B | -39.11 | -15.23 |
| Current Ratio | 0.39 | 0.49 |
| Quick Ratio | 0.39 | 0.49 |
| D/E | -25.68 | -1.21 |
| Debt-to-Assets | 59.56% | 2.66% |
| Interest Coverage | 0.90 | 14.56 |
| Asset Turnover | 0.11 | 2.46 |
| Fixed Asset Turnover | 0.13 | 7.75 |
| Payout Ratio | -6.69% | 22.52% |
| Dividend Yield | 0.36% | 0.96% |
| Fiscal Year | 2024 | 2025 |
Efficiency & Valuation Duel: The Vital Signs
Ratios serve as a company’s financial DNA, uncovering hidden risks and revealing operational strengths behind headline figures.
CoreWeave, Inc. Class A Common Stock
CoreWeave shows a modest 2.1% ROE but suffers a severe -45.1% net margin, signaling profitability challenges. Despite favorable P/E and P/B ratios, its valuation appears stretched given poor returns and a weak current ratio of 0.39. Shareholder returns are limited, with a low 0.36% dividend yield reflecting cautious capital allocation.
VeriSign, Inc.
VeriSign delivers a strong 57.7% net margin but negative ROE at -64.8%, suggesting uneven profitability dynamics. Its P/E stands at a neutral 23.5, while asset turnover of 2.46 and interest coverage of 14.8 indicate operational efficiency. The 0.96% dividend yield offers modest shareholder income despite some balance sheet concerns.
Operational Efficiency vs. Profitability Strength
VeriSign balances operational efficiency with moderate valuation risks, outperforming CoreWeave’s stretched valuation and weak liquidity. Investors seeking a blend of margin resilience and income may prefer VeriSign. CoreWeave fits those focused on turnaround potential amid financial strain.
Which one offers the Superior Shareholder Reward?
CoreWeave (CRWV) pays a minimal dividend yield of 0.36% but struggles with negative free cash flow (-$14.7/share) and no meaningful buybacks, reflecting weak distribution sustainability. VeriSign (VRSN) yields 0.96%, covers dividends comfortably with 98% free cash flow conversion, and sustains aggressive buybacks, supporting durable shareholder returns. I conclude VeriSign offers the superior total return profile in 2026.
Comparative Score Analysis: The Strategic Profile
The radar chart reveals the fundamental DNA and trade-offs of CoreWeave and VeriSign, highlighting their distinct financial strengths and weaknesses:
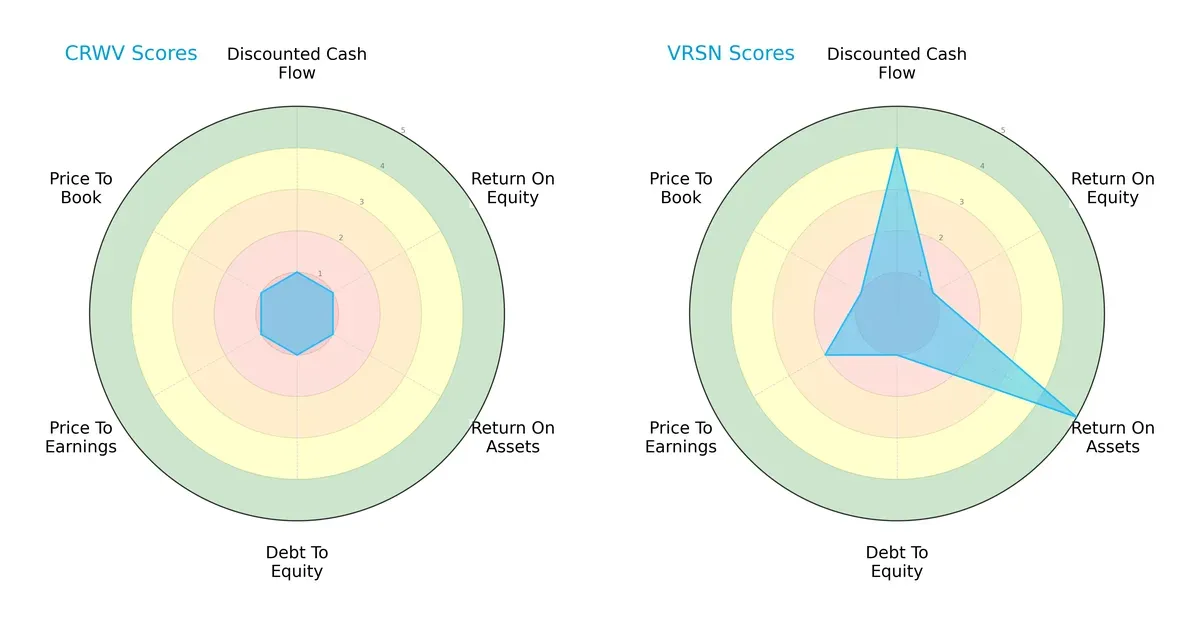
VeriSign shows a more balanced profile with a strong Discounted Cash Flow (4) and Return on Assets (5), indicating efficient asset use and future cash flow potential. CoreWeave scores uniformly low (1s) across all metrics, signaling systemic weaknesses. VeriSign’s strength leans on asset efficiency and valuation, while CoreWeave lacks a competitive edge.
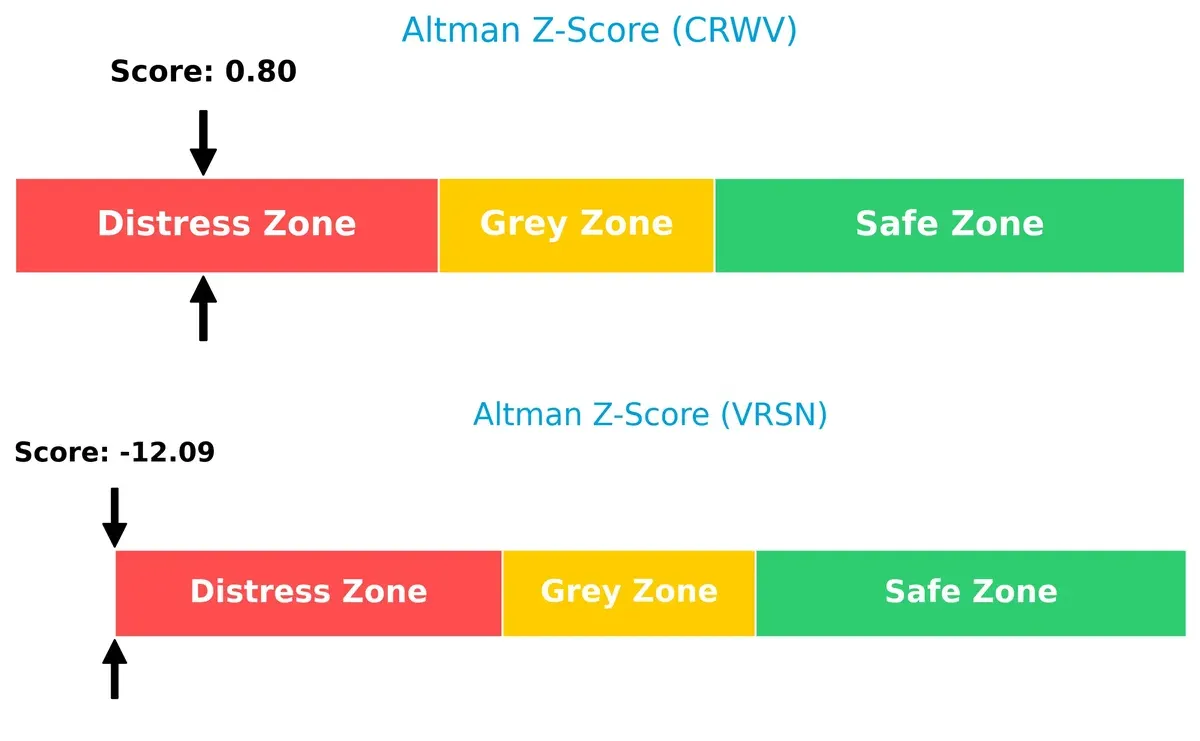
Bankruptcy Risk: Solvency Showdown
The Altman Z-Scores reveal CoreWeave (0.8) and VeriSign (-12.1) both reside in the distress zone, implying elevated bankruptcy risk in this cycle:
Financial Health: Quality of Operations
VeriSign’s Piotroski F-Score (8) signals robust financial health and operational quality. CoreWeave’s score (3) flags potential red flags in profitability or liquidity:
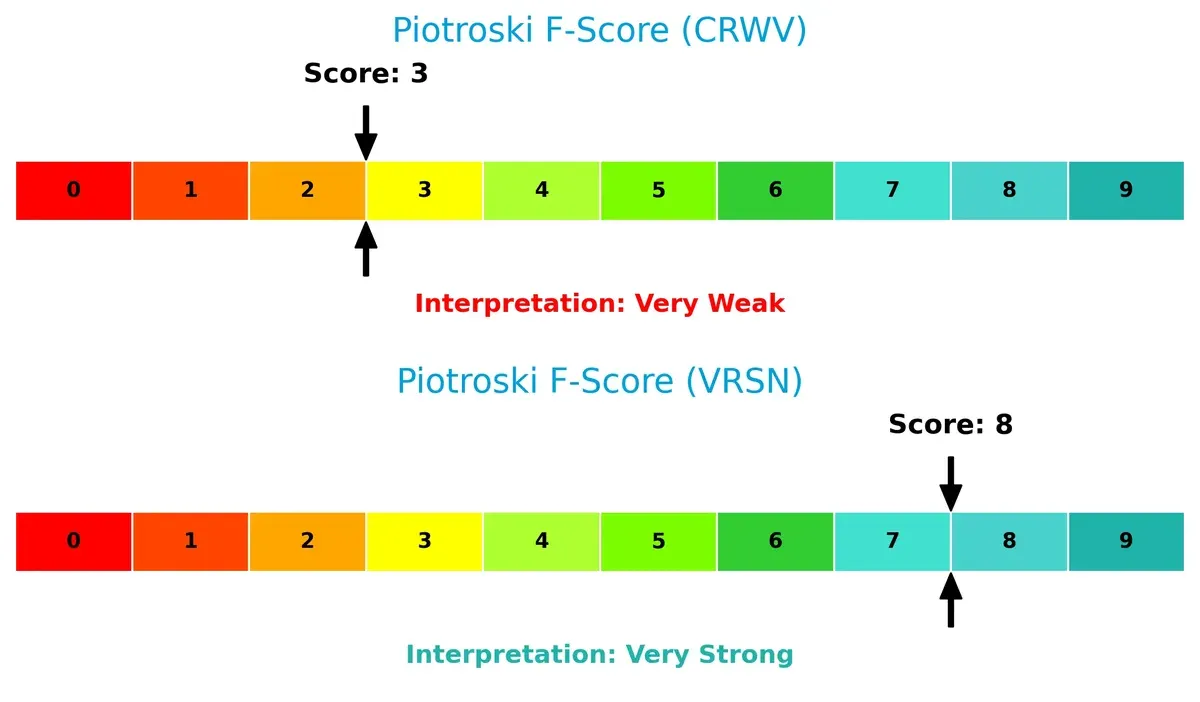
VeriSign stands out as the safer, more fundamentally sound choice despite solvency concerns, while CoreWeave’s financial fragility demands caution.
How are the two companies positioned?
This section dissects CoreWeave and VeriSign’s operational DNA by comparing revenue distribution and internal dynamics. The goal is to confront their economic moats and reveal which model delivers the most resilient competitive advantage today.
Strengths and Weaknesses Comparison
This table compares the strengths and weaknesses of CoreWeave (CRWV) and VeriSign (VRSN):
CRWV Strengths
- High ROE at 208.77% indicating strong equity returns
- Favorable P/E and P/B ratios
- Low debt-to-equity ratio suggests conservative leverage
VRSN Strengths
- Strong net margin at 57.68% reflecting high profitability
- Favorable WACC supports efficient capital cost
- High asset turnover ratios demonstrate operational efficiency
- Strong interest coverage ratio indicating healthy debt servicing
CRWV Weaknesses
- Negative net margin (-45.08%) signals unprofitability
- Low ROIC vs. very high WACC (82.83%) suggests poor capital returns
- Low current and quick ratios (0.39) indicate liquidity concerns
- High debt-to-assets ratio (59.56%) and negative interest coverage show financial risk
- Low asset turnover ratios point to inefficient asset use
VRSN Weaknesses
- Negative ROE (-64.84%) and ROIC (-151.96%) indicate weak returns on invested capital
- Very high debt-to-assets ratio (265.55%) signals over-leverage
- Below-par liquidity ratios (0.49 current and quick) pose short-term risk
- Dividend yield low at 0.96% despite high profitability
Both companies display contrasting profiles. CRWV’s strength lies in equity returns but suffers from poor profitability and liquidity. VRSN shows robust profitability and asset utilization but carries significant leverage and return on equity challenges. These factors highlight distinct strategic priorities for managing growth and risk.
The Moat Duel: Analyzing Competitive Defensibility
A structural moat is the only thing protecting long-term profits from the erosion of competition. Let’s dissect the competitive moats of CoreWeave and VeriSign:
CoreWeave, Inc.: Emerging Infrastructure with Scale Potential
CoreWeave’s moat centers on its cost advantage in GPU cloud infrastructure. Its high gross margin (74%) reflects operational leverage, but negative EBIT margin signals early-stage investment. Expansion in GenAI workloads could deepen its moat if profitability improves.
VeriSign, Inc.: Established Network Effects in Domain Services
VeriSign benefits from intense network effects controlling .com and .net domains. Its superior margins (EBIT 69%) and stable revenue highlight strong pricing power. However, declining ROIC warns of emerging challenges in sustaining this entrenched position.
Moat Resilience Showdown: Cost Advantage vs. Network Effects
Neither company currently generates economic profits above cost of capital; both shed value. CoreWeave’s growth potential contrasts with VeriSign’s eroding moat. Yet VeriSign’s entrenched market share offers a deeper moat to defend against disruption.
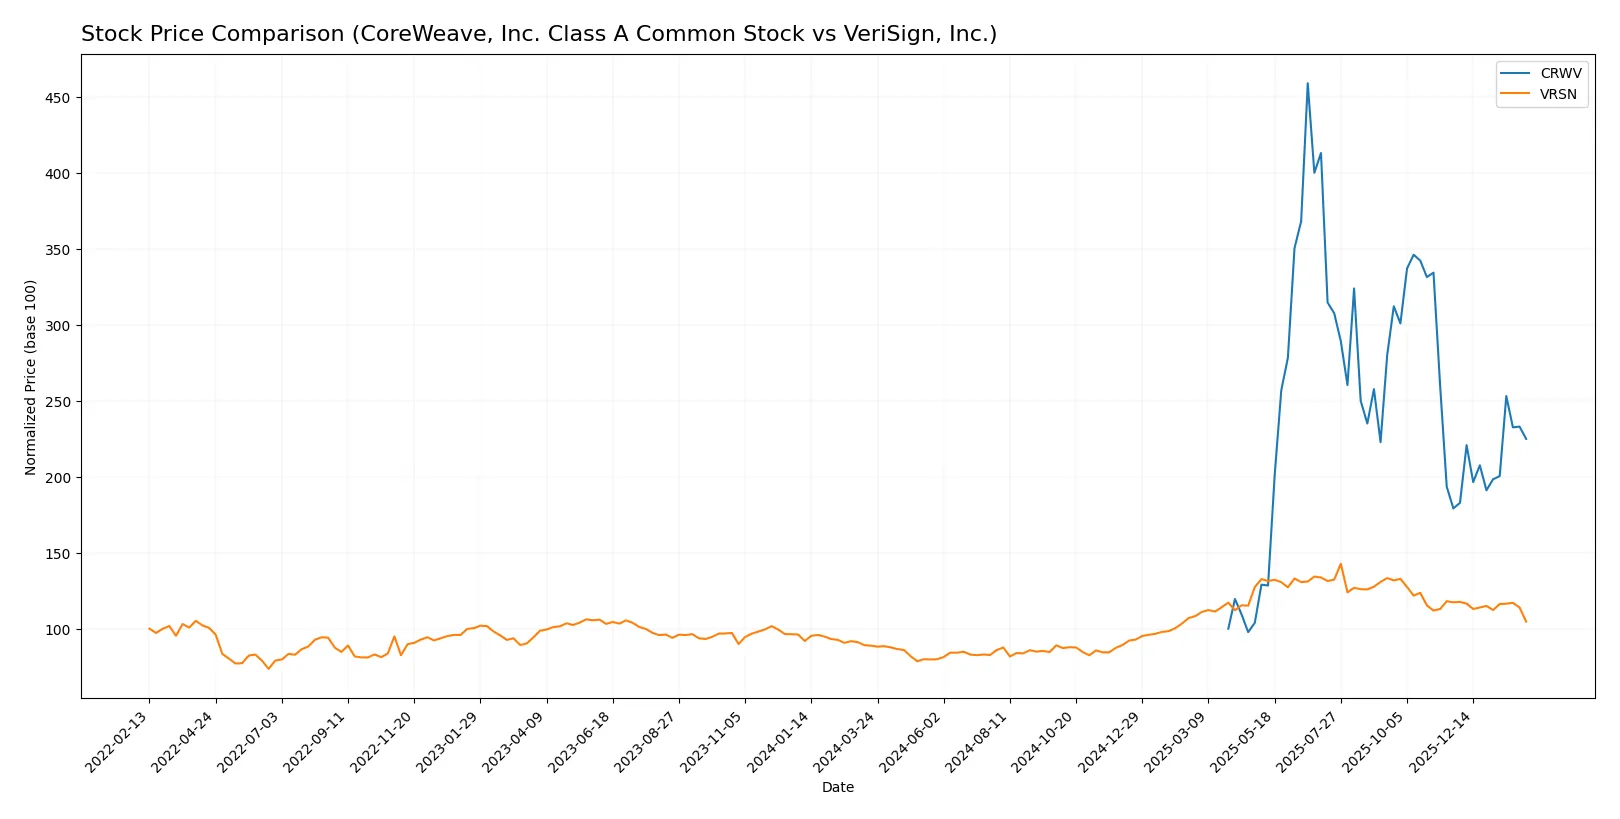
Which stock offers better returns?
The past year shows CoreWeave’s stock soaring with strong acceleration, while VeriSign’s price gains slow and recently reversed into a decline.
Trend Comparison
CoreWeave’s stock rose 124.88% over 12 months, indicating a bullish trend with accelerating momentum. Its price ranged from 39.09 to 183.58, showing high volatility (34.56 std deviation).
VeriSign’s stock gained 17.83% over the same period, a bullish but decelerating trend. Recently, it fell 10.84%, signaling a bearish short-term move amid higher volatility (40.67 std deviation).
CoreWeave outperformed VeriSign, delivering the highest market return with sustained acceleration and stronger buyer dominance.
Target Prices
Analysts present a clear consensus on target prices for CoreWeave, Inc. and VeriSign, Inc.
| Company | Target Low | Target High | Consensus |
|---|---|---|---|
| CoreWeave, Inc. Class A Common Stock | 84 | 175 | 120.73 |
| VeriSign, Inc. | 325 | 325 | 325 |
CoreWeave’s target consensus at 120.73 suggests upside from the current 89.95 price, reflecting growth potential in cloud infrastructure. VeriSign’s consensus stands well above the current 224.17, indicating strong confidence despite recent weakness.
How do institutions grade them?
CoreWeave, Inc. Class A Common Stock Grades
The following table summarizes recent grades from major financial institutions for CoreWeave, Inc.:
| Grading Company | Action | New Grade | Date |
|---|---|---|---|
| Macquarie | Maintain | Neutral | 2026-01-27 |
| Deutsche Bank | Upgrade | Buy | 2026-01-27 |
| Mizuho | Maintain | Neutral | 2026-01-27 |
| DA Davidson | Upgrade | Buy | 2026-01-26 |
| Needham | Maintain | Hold | 2026-01-26 |
| Barclays | Maintain | Equal Weight | 2026-01-12 |
| Wells Fargo | Maintain | Overweight | 2026-01-08 |
| DA Davidson | Upgrade | Neutral | 2026-01-05 |
| Jefferies | Maintain | Buy | 2026-01-05 |
| Goldman Sachs | Maintain | Neutral | 2025-11-17 |
VeriSign, Inc. Grades
The following table summarizes recent grades from major financial institutions for VeriSign, Inc.:
| Grading Company | Action | New Grade | Date |
|---|---|---|---|
| JP Morgan | Maintain | Neutral | 2026-01-06 |
| Baird | Maintain | Outperform | 2025-07-01 |
| Baird | Maintain | Outperform | 2025-04-25 |
| Baird | Maintain | Outperform | 2025-04-01 |
| Citigroup | Maintain | Buy | 2025-02-04 |
| Citigroup | Maintain | Buy | 2025-01-03 |
| Baird | Upgrade | Outperform | 2024-12-09 |
| Baird | Maintain | Neutral | 2024-06-27 |
| Baird | Maintain | Neutral | 2024-04-26 |
| Citigroup | Maintain | Buy | 2024-04-02 |
Which company has the best grades?
VeriSign consistently receives Outperform and Buy ratings, indicating stronger institutional confidence. CoreWeave’s grades range from Hold to Buy, with more Neutral and Equal Weight ratings. VeriSign’s higher grades may attract investors seeking stability and growth potential.

Don’t Let Luck Decide Your Entry Point
Optimize your entry points with our advanced ProRealTime indicators. You’ll get efficient buy signals with precise price targets for maximum performance. Start outperforming now!
Risks specific to each company
The following categories identify the critical pressure points and systemic threats facing both firms in the 2026 market environment:
1. Market & Competition
CoreWeave, Inc. Class A Common Stock
- Faces intense competition in cloud infrastructure, especially in GPU compute for GenAI, with rapid technological shifts.
VeriSign, Inc.
- Holds dominant domain registry market share but faces risks from alternative internet navigation technologies and domain decentralization.
2. Capital Structure & Debt
CoreWeave, Inc. Class A Common Stock
- High debt-to-assets ratio at 59.56% and weak interest coverage (-1.06) signal financial strain and refinancing risk.
VeriSign, Inc.
- Extremely high debt-to-assets ratio at 265.55% but strong interest coverage (14.81) mitigates immediate solvency concerns.
3. Stock Volatility
CoreWeave, Inc. Class A Common Stock
- Exceedingly high beta of 21.65 indicates extreme price volatility and speculative trading risk.
VeriSign, Inc.
- Low beta of 0.75 reflects stable stock price with comparatively low systematic risk.
4. Regulatory & Legal
CoreWeave, Inc. Class A Common Stock
- Subject to evolving data privacy and AI regulations that could increase compliance costs.
VeriSign, Inc.
- Faces regulatory scrutiny over domain registration and internet infrastructure control, with potential antitrust risks.
5. Supply Chain & Operations
CoreWeave, Inc. Class A Common Stock
- Relies on specialized hardware supply chains for GPUs, vulnerable to semiconductor shortages.
VeriSign, Inc.
- Operationally stable with robust internet infrastructure but dependent on maintaining root server security and uptime.
6. ESG & Climate Transition
CoreWeave, Inc. Class A Common Stock
- Energy-intensive GPU operations pose challenges in reducing carbon footprint amid tightening climate regulations.
VeriSign, Inc.
- Emphasizes internet stability but faces pressure to improve energy efficiency of data centers and network operations.
7. Geopolitical Exposure
CoreWeave, Inc. Class A Common Stock
- Primarily US-based with moderate exposure to international trade tensions affecting hardware imports.
VeriSign, Inc.
- Global domain registry footprint exposes it to geopolitical risks, including censorship and regulatory divergence.
Which company shows a better risk-adjusted profile?
CoreWeave’s most impactful risk is its extreme stock volatility combined with weak financial health, signaling high speculative risk. VeriSign’s largest concern lies in its ballooning debt-to-assets ratio, though its strong interest coverage and stable stock price provide some cushion. VeriSign presents a better risk-adjusted profile, supported by a solid Piotroski score of 8, contrasting with CoreWeave’s distress Z-score and weak financials. This stability aligns with VeriSign’s established internet infrastructure role despite debt concerns.
Final Verdict: Which stock to choose?
CoreWeave’s superpower lies in its explosive revenue growth and efficiency in scaling its operations, positioning it as a high-velocity innovator. However, its persistent negative free cash flow and stretched liquidity ratios remain points of vigilance. It fits portfolios targeting aggressive growth and tolerating operational volatility.
VeriSign commands a strategic moat through its entrenched domain name infrastructure and recurring revenue streams, delivering strong gross margins and cash flow quality. Compared to CoreWeave, it offers better operational stability, albeit with decelerating momentum. It suits portfolios focused on GARP—growth at a reasonable price—with a safety tilt.
If you prioritize rapid expansion and are comfortable with elevated risk, CoreWeave’s growth engine outshines its peers despite financial headwinds. However, if you seek steadier cash flow and a proven moat, VeriSign offers better stability and income predictability, though it commands a premium and faces margin pressures. Each scenario demands careful risk calibration aligned with your investment horizon.
Disclaimer: Investment carries a risk of loss of initial capital. The past performance is not a reliable indicator of future results. Be sure to understand risks before making an investment decision.
Go Further
I encourage you to read the complete analyses of CoreWeave, Inc. Class A Common Stock and VeriSign, Inc. to enhance your investment decisions: