In today’s dynamic tech landscape, CoreWeave, Inc. (CRWV) and UiPath Inc. (PATH) stand out as innovators in the software infrastructure space. CoreWeave specializes in cloud platforms accelerating AI workloads, while UiPath leads in robotic process automation with AI-driven solutions. Both companies target efficiency through cutting-edge technology, making them compelling contenders. This article will help you decide which stock could be the smarter addition to your investment portfolio.
Table of contents
Companies Overview
I will begin the comparison between CoreWeave and UiPath by providing an overview of these two companies and their main differences.
CoreWeave Overview
CoreWeave, Inc. operates a cloud platform focused on scaling, support, and acceleration for GenAI, providing infrastructure for compute workloads. Its product suite includes GPU and CPU compute, storage, networking, virtual and bare metal servers, alongside specialized services such as VFX rendering and AI model training. Founded in 2017 and based in Livingston, NJ, CoreWeave targets enterprises needing robust compute solutions.
UiPath Overview
UiPath Inc. offers an end-to-end automation platform specializing in robotic process automation (RPA) with a focus on sectors like banking, healthcare, and government. Its platform integrates AI with tools for building, managing, and deploying automations, emphasizing low-code development for users without coding expertise. Founded in 2005 and headquartered in New York City, UiPath serves a broad enterprise customer base.
Key similarities and differences
Both CoreWeave and UiPath operate in the software infrastructure industry, leveraging AI technologies. CoreWeave focuses on cloud compute infrastructure supporting AI workloads, while UiPath centers on automation software for business processes. CoreWeave’s operations emphasize hardware-backed services, contrasting with UiPath’s software-driven platform for process automation and enterprise workflow management.
Income Statement Comparison
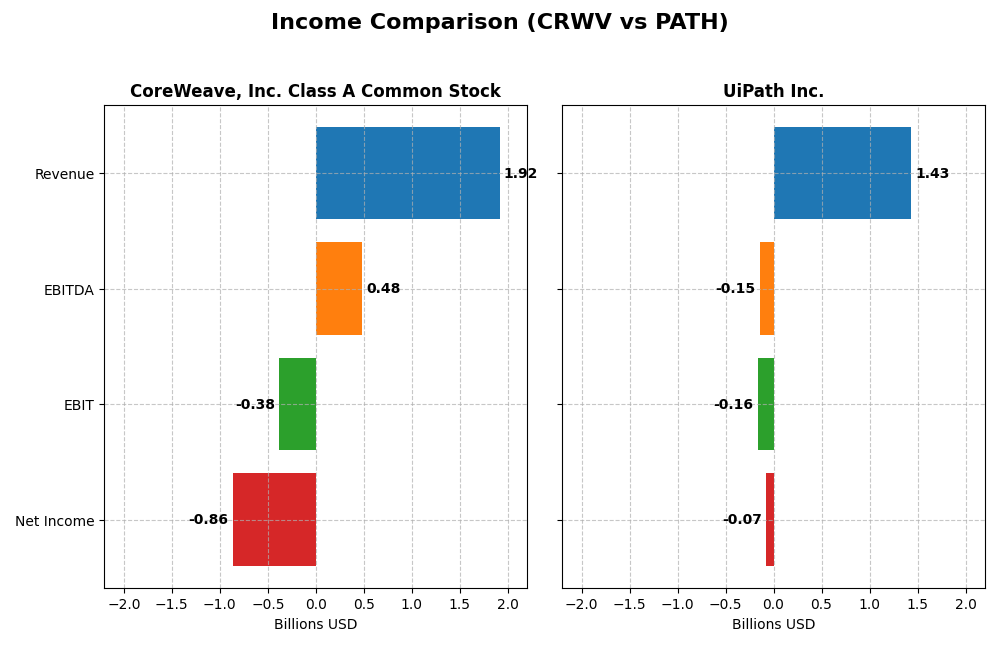
The table below presents a side-by-side comparison of the most recent fiscal year income statement metrics for CoreWeave, Inc. Class A Common Stock and UiPath Inc.
| Metric | CoreWeave, Inc. Class A Common Stock | UiPath Inc. |
|---|---|---|
| Market Cap | 50.4B | 7.7B |
| Revenue | 1.92B | 1.43B |
| EBITDA | 480M | -145M |
| EBIT | -383M | -163M |
| Net Income | -937.8M | -73.7M |
| EPS | -2.33 | -0.13 |
| Fiscal Year | 2024 | 2025 |
Income Statement Interpretations
CoreWeave, Inc. Class A Common Stock
CoreWeave’s revenue surged dramatically from $16M in 2022 to $1.9B in 2024, reflecting rapid growth, while net income remained negative, widening to -$863M in 2024. Gross margins were strong and favorable at 74.24%, but EBIT and net margins were unfavorable, indicating profitability challenges. The latest year showed continued revenue acceleration and improving operating income, though net losses persisted.
UiPath Inc.
UiPath’s revenue increased steadily from $608M in 2021 to $1.43B in 2025, with net losses narrowing to -$74M in 2025. Gross margins were favorable at 82.73%, and net margin improved significantly though still negative at -5.15%. Operating losses decreased slightly, and the company demonstrated consistent revenue and earnings improvement in the most recent year, signaling operational progress.
Which one has the stronger fundamentals?
UiPath exhibits stronger fundamentals with a consistent revenue increase, improving net margin, and a less negative bottom line. CoreWeave shows explosive revenue growth but remains highly unprofitable with large net losses and unfavorable EBIT and net margins. UiPath’s better margin stability and profitability trends suggest a more balanced financial position within the period analyzed.
Financial Ratios Comparison
The table below presents a side-by-side comparison of key financial ratios for CoreWeave, Inc. Class A Common Stock (CRWV) and UiPath Inc. (PATH) based on their most recent fiscal year data.
| Ratios | CoreWeave, Inc. (CRWV) FY 2024 | UiPath Inc. (PATH) FY 2025 |
|---|---|---|
| ROE | 2.09% | -3.99% |
| ROIC | 2.08% | -7.41% |
| P/E | -18.73 | -108.04 |
| P/B | -39.11 | 4.31 |
| Current Ratio | 0.39 | 2.93 |
| Quick Ratio | 0.39 | 2.93 |
| D/E | -25.68 (negative, atypical) | 0.04 |
| Debt-to-Assets | 59.56% | 2.72% |
| Interest Coverage | 0.90 | 0 (not meaningful) |
| Asset Turnover | 0.11 | 0.50 |
| Fixed Asset Turnover | 0.13 | 14.41 |
| Payout ratio | -6.69% (negative, atypical) | 0% |
| Dividend yield | 0.36% | 0% |
Interpretation of the Ratios
CoreWeave, Inc. Class A Common Stock
CoreWeave shows mixed ratios with a strong ROE at 208.77% but weak profitability and liquidity, highlighted by a negative net margin of -45.08% and a low current ratio of 0.39, signaling potential short-term financial stress. The company does not pay dividends, likely reflecting its growth and reinvestment focus rather than shareholder returns through payouts.
UiPath Inc.
UiPath’s ratios reveal moderate strengths such as a solid current ratio of 2.93 and low debt to assets of 2.72%, but profitability remains challenging with a negative net margin of -5.15% and ROE at -3.99%. Like CoreWeave, UiPath does not pay dividends, probably due to reinvestment priorities and ongoing growth initiatives rather than distributing earnings to shareholders.
Which one has the best ratios?
Comparatively, UiPath exhibits a healthier liquidity position and lower leverage, while CoreWeave’s high ROE contrasts with significant liquidity and profitability weaknesses. Both companies face profitability challenges and do not pay dividends. Overall, UiPath’s ratios are slightly more favorable, but each presents distinct financial risks and strengths.
Strategic Positioning
This section compares the strategic positioning of CoreWeave (CRWV) and UiPath (PATH) regarding market position, key segments, and exposure to technological disruption:
CoreWeave
- Newer player with $50B market cap, high beta, operating in cloud infrastructure, facing strong competition.
- Focuses on GPU and CPU compute, AI model training, rendering, and cloud infrastructure services.
- Operates in fast-evolving cloud infrastructure with potential disruption from AI and cloud tech advances.
UiPath
- Established with $7.7B market cap, moderate beta, focused on RPA software, competing in automation market.
- Provides end-to-end robotic process automation platform serving banking, healthcare, finance, and government.
- Faces disruption risk but leverages AI and automation integration to innovate within enterprise software.
CoreWeave vs UiPath Positioning
CoreWeave concentrates on cloud infrastructure and AI compute workloads, capitalizing on emerging AI demands, while UiPath diversifies across RPA software, professional services, and subscriptions, addressing multiple industries. CoreWeave’s approach targets specialized infrastructure; UiPath offers a broader automation platform.
Which has the best competitive advantage?
Both companies are currently value destroyers with ROIC below WACC; however, UiPath shows improving profitability trends, indicating a slightly stronger potential competitive advantage than CoreWeave’s stable but unfavorable value creation.
Stock Comparison
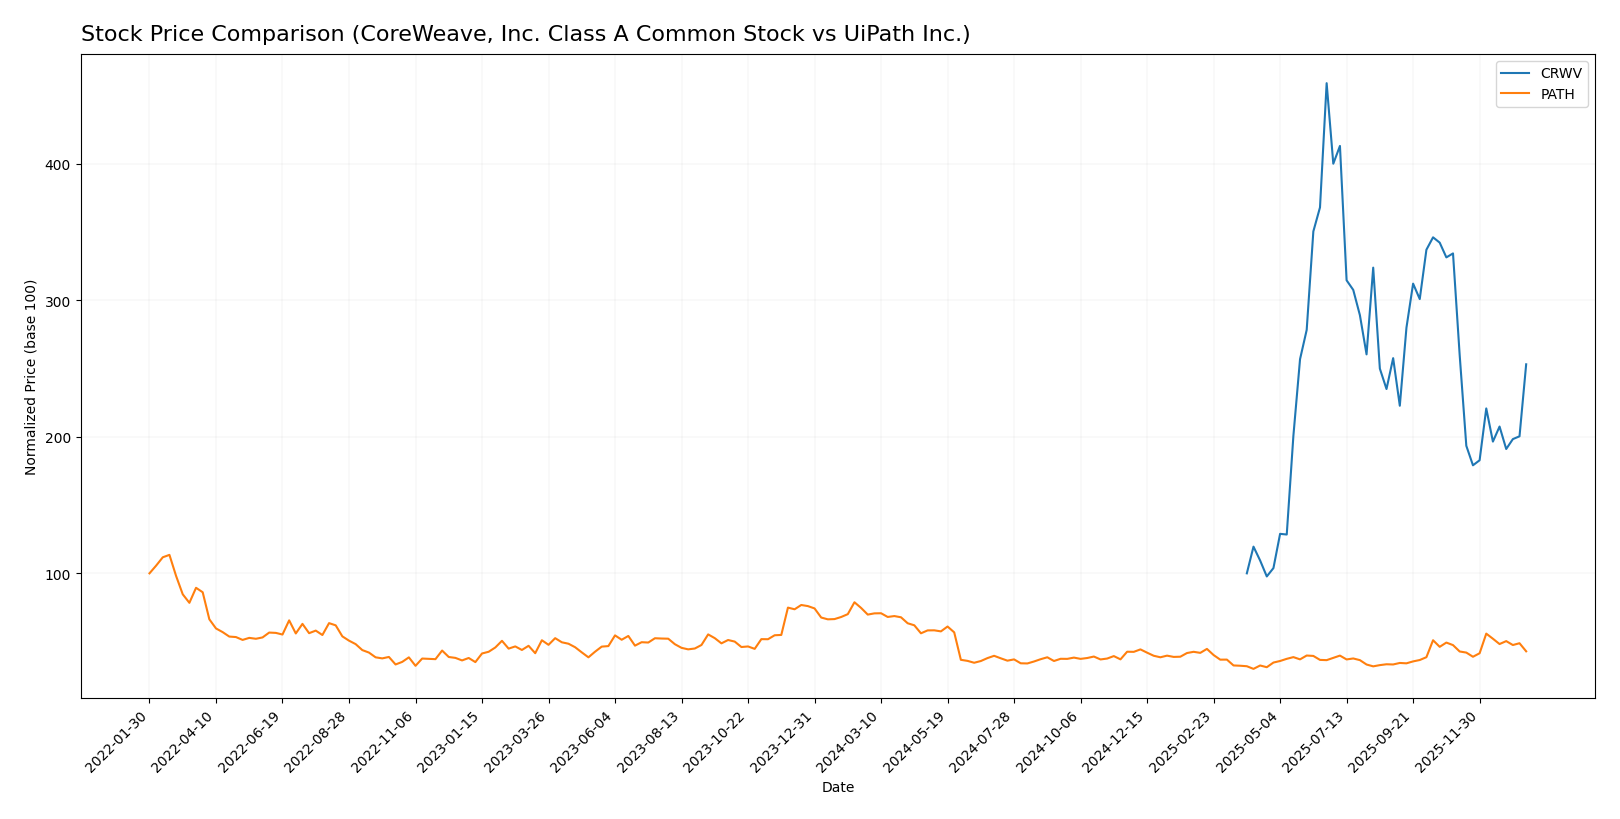
The stock price movements of CoreWeave, Inc. Class A Common Stock (CRWV) and UiPath Inc. (PATH) over the past 12 months highlight significant divergence, with CoreWeave showing strong gains despite recent pullbacks, while UiPath has experienced sustained declines amid accelerating bearish momentum.
Trend Analysis
CoreWeave’s stock exhibited a bullish trend over the past year with a 153.08% price increase, although the trend showed deceleration. The stock’s price ranged from a low of 39.09 to a high of 183.58, with elevated volatility (std deviation 35.67).
UiPath’s stock demonstrated a bearish trend over the same period, falling 38.53% with accelerating downward momentum. The price fluctuated between 10.04 and 23.66, and volatility remained low (std deviation 3.33).
Comparing the two, CoreWeave delivered the highest market performance with a strong positive return, whereas UiPath’s stock declined significantly, reflecting opposite trend directions.
Target Prices
The current analyst consensus presents a clear outlook on the target prices for CoreWeave, Inc. and UiPath Inc.
| Company | Target High | Target Low | Consensus |
|---|---|---|---|
| CoreWeave, Inc. Class A Common Stock | 175 | 68 | 115.79 |
| UiPath Inc. | 19 | 14 | 16.6 |
Analysts expect CoreWeave’s stock to appreciate from its current price of $101.23 toward the consensus target of $115.79, indicating moderate upside potential. UiPath’s consensus target of $16.6 suggests a modest increase from its current $14.34 price, reflecting cautious optimism.
Analyst Opinions Comparison
This section compares analysts’ ratings and financial scores for CoreWeave, Inc. Class A Common Stock (CRWV) and UiPath Inc. (PATH):
Rating Comparison
CRWV Rating
- Rating: D+ indicating a very unfavorable overall status.
- Discounted Cash Flow Score: 1, very unfavorable, suggesting poor valuation.
- ROE Score: 1, very unfavorable, showing low efficiency in generating equity returns.
- ROA Score: 1, very unfavorable, indicating inefficient asset utilization.
- Debt To Equity Score: 1, very unfavorable, pointing to higher financial risk.
- Overall Score: 1, very unfavorable, summarizing weak financial standing.
PATH Rating
- Rating: B+ indicating a very favorable overall status.
- Discounted Cash Flow Score: 3, moderate, indicating balanced valuation.
- ROE Score: 4, favorable, reflecting strong profitability from shareholders’ equity.
- ROA Score: 4, favorable, showing effective use of assets to generate earnings.
- Debt To Equity Score: 4, favorable, suggesting lower financial leverage risk.
- Overall Score: 3, moderate, indicating a relatively stable financial position.
Which one is the best rated?
Based strictly on the provided data, PATH is better rated than CRWV across all key financial scores and overall rating. PATH demonstrates stronger profitability, asset utilization, and lower financial risk, while CRWV scores very low in all categories.
Scores Comparison
Here is a comparison of the financial health scores for CoreWeave and UiPath Inc.:
CRWV Scores
- Altman Z-Score: 0.80, indicating distress zone with high bankruptcy risk.
- Piotroski Score: 3, categorized as very weak financial strength.
PATH Scores
- Altman Z-Score: 5.27, indicating safe zone with low bankruptcy risk.
- Piotroski Score: 7, categorized as strong financial strength.
Which company has the best scores?
Based on the provided data, PATH has the best financial scores with a safe zone Altman Z-Score and a strong Piotroski Score, while CRWV is in distress with very weak Piotroski results.
Grades Comparison
The following presents the latest grades and consensus ratings from reputable financial institutions for both companies:
CoreWeave, Inc. Class A Common Stock Grades
This table summarizes recent grades and rating actions from leading financial firms for CoreWeave, Inc. Class A Common Stock:
| Grading Company | Action | New Grade | Date |
|---|---|---|---|
| Barclays | Maintain | Equal Weight | 2026-01-12 |
| Wells Fargo | Maintain | Overweight | 2026-01-08 |
| Jefferies | Maintain | Buy | 2026-01-05 |
| DA Davidson | Upgrade | Neutral | 2026-01-05 |
| Goldman Sachs | Maintain | Neutral | 2025-11-17 |
| HC Wainwright & Co. | Maintain | Buy | 2025-11-12 |
| Wells Fargo | Maintain | Overweight | 2025-11-12 |
| Barclays | Maintain | Equal Weight | 2025-11-12 |
| Loop Capital | Maintain | Buy | 2025-11-12 |
| B of A Securities | Maintain | Neutral | 2025-11-11 |
CoreWeave’s grades display a generally positive trend with multiple Buy and Overweight ratings, and only Neutral or Equal Weight grades elsewhere, indicating moderate optimism among analysts.
UiPath Inc. Grades
Below is a summary of recent grades and rating actions from recognized financial firms for UiPath Inc.:
| Grading Company | Action | New Grade | Date |
|---|---|---|---|
| Barclays | Maintain | Equal Weight | 2026-01-12 |
| RBC Capital | Maintain | Sector Perform | 2026-01-05 |
| RBC Capital | Maintain | Sector Perform | 2025-12-10 |
| Morgan Stanley | Maintain | Equal Weight | 2025-12-09 |
| DA Davidson | Maintain | Neutral | 2025-12-05 |
| Canaccord Genuity | Maintain | Buy | 2025-12-04 |
| Mizuho | Maintain | Neutral | 2025-12-04 |
| RBC Capital | Maintain | Sector Perform | 2025-12-04 |
| Wells Fargo | Maintain | Equal Weight | 2025-12-04 |
| Evercore ISI Group | Maintain | In Line | 2025-12-04 |
UiPath’s ratings mostly reflect neutral to moderate positive views, with a majority of Sector Perform, Equal Weight, and Neutral grades, accompanied by a single Buy rating.
Which company has the best grades?
CoreWeave has received a stronger consensus rating of Buy compared to UiPath’s Hold consensus, supported by more Buy and Overweight grades. This suggests that analysts have relatively greater confidence in CoreWeave’s near-term prospects, which may influence investor sentiment and portfolio decisions accordingly.
Strengths and Weaknesses
Below is a comparative overview of the key strengths and weaknesses of CoreWeave, Inc. Class A Common Stock (CRWV) and UiPath Inc. (PATH) based on their latest financial and strategic data.
| Criterion | CoreWeave, Inc. Class A (CRWV) | UiPath Inc. (PATH) |
|---|---|---|
| Diversification | Limited product/service diversification; primarily focused on cloud GPU infrastructure | Well diversified with License, Subscription, and Professional Services revenue streams |
| Profitability | Negative net margin (-45.08%) and ROIC slightly positive but below WACC, indicating value destruction | Negative net margin (-5.15%) and ROIC below WACC, but profitability improving with growing ROIC trend |
| Innovation | Moderate innovation with technology focus but high WACC (84.93%) indicating costly capital | Strong innovation evidenced by growing ROIC and high fixed asset turnover (14.41), signaling efficient asset use |
| Global presence | Smaller scale with less global footprint, reflected in low asset turnover ratios | Larger global presence with growing subscription services revenue reaching $801M in 2025 |
| Market Share | Niche market player in GPU cloud infrastructure, limited market penetration | Significant market share in automation software with expanding revenues across segments |
Key takeaways: CoreWeave shows challenges in profitability and diversification with value destruction, while UiPath demonstrates improving profitability and stronger diversification, suggesting a healthier growth trajectory despite current value shedding. Investors should weigh UiPath’s innovation and global reach against CoreWeave’s higher risk profile.
Risk Analysis
Below is a comparative table of key risks facing CoreWeave, Inc. (CRWV) and UiPath Inc. (PATH) based on the most recent data from 2025-2026:
| Metric | CoreWeave, Inc. (CRWV) | UiPath Inc. (PATH) |
|---|---|---|
| Market Risk | Very high beta (21.65), volatile price range (33.5-187) | Moderate beta (1.08), stable price range (9.38-19.84) |
| Debt level | High debt-to-assets (59.56%), negative interest coverage (-1.06) | Low debt-to-assets (2.72%), neutral interest coverage (0) |
| Regulatory Risk | Moderate; operates cloud infrastructure, subject to tech regulations | Moderate; automation software serving regulated sectors (banking, healthcare) |
| Operational Risk | Unfavorable liquidity ratios (current 0.39), weak asset turnover (0.11) | Favorable liquidity (current 2.93), better asset turnover (0.5) |
| Environmental Risk | Moderate; data centers consume significant energy | Moderate; software business with lower direct environmental impact |
| Geopolitical Risk | US-based, some exposure to supply chain disruptions | Global presence including Romania and Japan, moderate geopolitical exposure |
In synthesis, CoreWeave faces the highest market risk due to extreme stock price volatility and elevated leverage, raising potential financial distress concerns. Its Altman Z-Score of 0.80 signals distress zone risk. UiPath presents lower financial risk with stronger liquidity and solvency metrics, reflected in its safe zone Altman Z-Score of 5.27 and a solid Piotroski score of 7. Investors should weigh CoreWeave’s growth potential against its high financial risk, while UiPath offers comparatively stable risk profiles with moderate growth prospects.
Which Stock to Choose?
CoreWeave, Inc. Class A Common Stock (CRWV) shows a strong revenue growth of 736.64% in 2024 but suffers from unfavorable net margin (-45.08%) and high debt levels. Its financial ratios are mostly unfavorable, and it has a very unfavorable overall rating.
UiPath Inc. (PATH) experienced moderate revenue growth of 9.3% in 2025 with a smaller net margin loss (-5.15%). Its financial ratios are more balanced, featuring several favorable metrics, and the company holds a moderate overall rating with strong financial scores.
For investors prioritizing growth potential and tolerating higher risk, CRWV’s rapid revenue expansion might appear attractive despite its financial weaknesses. Conversely, more risk-averse investors seeking financial stability may find PATH’s improving profitability and stronger ratios more reassuring.
Disclaimer: Investment carries a risk of loss of initial capital. The past performance is not a reliable indicator of future results. Be sure to understand risks before making an investment decision.
Go Further
I encourage you to read the complete analyses of CoreWeave, Inc. Class A Common Stock and UiPath Inc. to enhance your investment decisions: