CoreWeave, Inc. (CRWV) and StoneCo Ltd. (STNE) both operate within the software infrastructure sector but serve distinct yet overlapping markets. CoreWeave specializes in cloud computing solutions for AI and high-performance workloads, while StoneCo focuses on fintech services enabling digital commerce in Brazil. This comparison explores their innovation strategies and market potential to help you decide which company offers the most promising investment opportunity. Let’s uncover which stock could best enhance your portfolio.

Table of contents
Companies Overview
I will begin the comparison between CoreWeave, Inc. and StoneCo Ltd. by providing an overview of these two companies and their main differences.
CoreWeave Overview
CoreWeave, Inc. operates a cloud platform focused on scaling, support, and acceleration for GenAI workloads. The company builds infrastructure supporting compute tasks for enterprises, offering GPU and CPU compute, storage, networking, and managed services. Founded in 2017 and based in New Jersey, CoreWeave targets AI model training, VFX rendering, and mission control within the software infrastructure industry.
StoneCo Overview
StoneCo Ltd. delivers financial technology solutions to merchants and partners enabling electronic commerce across in-store, online, and mobile channels in Brazil. It operates through proprietary Stone Hubs and direct sales teams, serving over 1.7M primarily small and medium-sized businesses. Founded in 2000 and headquartered in the Cayman Islands, StoneCo focuses on fintech software infrastructure supporting digital and brick-and-mortar merchants.
Key similarities and differences
Both CoreWeave and StoneCo operate in the software infrastructure sector but serve distinct markets. CoreWeave provides cloud computing resources for AI and rendering workloads, while StoneCo offers fintech solutions to merchants for electronic commerce. CoreWeave’s business centers on enterprise cloud and AI infrastructure, whereas StoneCo focuses on financial technology services for commerce in Brazil. Their geographic focus and customer bases also differ significantly.
Income Statement Comparison
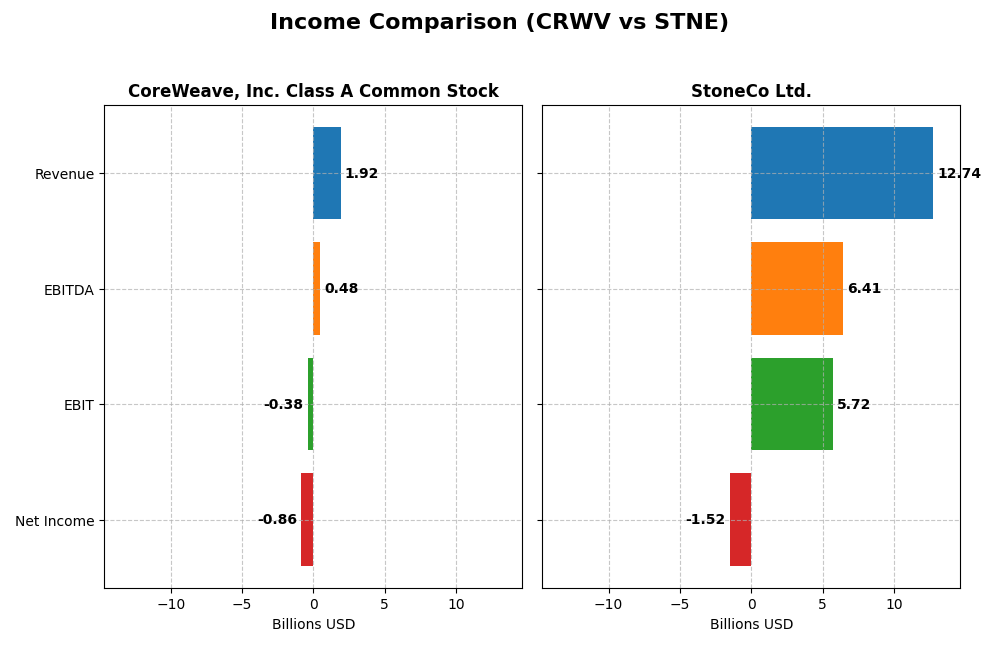
This table compares the key income statement metrics for CoreWeave, Inc. Class A Common Stock (CRWV) and StoneCo Ltd. (STNE) for the most recent fiscal year 2024, highlighting their market capitalization, revenues, profitability, and earnings per share.
| Metric | CoreWeave, Inc. Class A Common Stock (CRWV) | StoneCo Ltd. (STNE) |
|---|---|---|
| Market Cap | 50.4B USD | 3.9B USD |
| Revenue | 1.92B USD | 12.74B BRL |
| EBITDA | 480M USD | 6.41B BRL |
| EBIT | -383M USD | 5.72B BRL |
| Net Income | -863M USD | -1.52B BRL |
| EPS | -2.33 USD | -5.02 BRL |
| Fiscal Year | 2024 | 2024 |
Income Statement Interpretations
CoreWeave, Inc. Class A Common Stock
CoreWeave’s revenue surged dramatically from $15.8M in 2022 to $1.92B in 2024, reflecting strong growth momentum. Gross margin remained favorable at 74.24%, indicating efficient cost control, but EBIT and net margins stayed negative, partly due to high interest expenses. The 2024 year showed revenue growth slowing relative to prior years, while net losses widened to $863M.
StoneCo Ltd.
StoneCo’s revenue steadily increased from BRL 3.17B in 2020 to BRL 12.74B in 2024, maintaining a solid gross margin near 73.4%. EBIT margin improved to a favorable 44.86%, yet net margin remained negative at -11.89%, signaling ongoing profitability challenges. The 2024 performance showed moderate revenue and EBIT growth, but net income deteriorated sharply, reflecting significant non-operating expenses.
Which one has the stronger fundamentals?
Both companies exhibit favorable gross margins and revenue growth, but CoreWeave faces more severe net losses and high interest expenses, despite rapid expansion. StoneCo shows a stronger EBIT margin and steadier operational growth, yet struggles with net profitability due to other costs. Overall, both have favorable income statements, but each carries notable risks impacting net income stability.
Financial Ratios Comparison
The table below presents a side-by-side comparison of key financial ratios for CoreWeave, Inc. Class A Common Stock (CRWV) and StoneCo Ltd. (STNE) based on their latest fiscal year 2024 data.
| Ratios | CoreWeave, Inc. (CRWV) | StoneCo Ltd. (STNE) |
|---|---|---|
| ROE | 2.09% | -12.87% |
| ROIC | 2.08% | 22.41% |
| P/E | -18.73 | -9.84 |
| P/B | -39.11 | 1.27 |
| Current Ratio | 0.39 | 1.37 |
| Quick Ratio | 0.39 | 1.37 |
| D/E (Debt-to-Equity) | -25.68 | 1.10 |
| Debt-to-Assets | 59.56% | 23.53% |
| Interest Coverage | 0.90 | 5.57 |
| Asset Turnover | 0.11 | 0.23 |
| Fixed Asset Turnover | 0.13 | 6.95 |
| Payout ratio | -6.69% | 0% |
| Dividend yield | 0.36% | 0% |
Interpretation of the Ratios
CoreWeave, Inc. Class A Common Stock
CoreWeave’s ratios show several weaknesses, including a low current ratio of 0.39 and unfavorable debt-to-assets at 59.56%, along with negative interest coverage and poor asset turnover. However, it has a strong return on equity at 208.77%. The company does not pay dividends, likely reflecting its negative profitability and reinvestment focus typical of a high-growth phase.
StoneCo Ltd.
StoneCo presents a mixed ratio profile with a neutral current ratio of 1.37 and favorable quick ratio and interest coverage. Its return on invested capital is strong at 22.41%, despite negative net margin and return on equity. StoneCo also does not pay dividends, consistent with its reinvestment strategy and focus on growth within the financial technology sector.
Which one has the best ratios?
StoneCo holds a more balanced ratio profile with 50% favorable ratios and fewer unfavorable metrics compared to CoreWeave’s predominantly unfavorable ratios at 71%. StoneCo’s stronger liquidity, interest coverage, and return on invested capital suggest a slightly more favorable financial position relative to CoreWeave’s high leverage and liquidity challenges.
Strategic Positioning
This section compares the strategic positioning of CoreWeave and StoneCo, including their market position, key segments, and exposure to technological disruption:
CoreWeave, Inc. Class A Common Stock
- Positioned in software infrastructure with high volatility and significant competitive pressure.
- Focuses on cloud infrastructure for GenAI workloads, including GPU/CPU compute and AI services.
- Exposure to rapid AI and cloud infrastructure innovation, requiring continuous technology adaptation.
StoneCo Ltd.
- Operates in fintech for Brazilian merchants, facing moderate competitive pressure.
- Provides financial technology solutions across in-store, online, and mobile commerce in Brazil.
- Subject to fintech innovation but benefits from proprietary hubs and localized sales expertise.
CoreWeave vs StoneCo Positioning
CoreWeave concentrates on advanced cloud infrastructure for AI, emphasizing technological specialization, while StoneCo adopts a diversified fintech approach targeting multiple commerce channels. CoreWeave’s niche focus entails higher volatility, whereas StoneCo benefits from broad client base and localized market presence.
Which has the best competitive advantage?
StoneCo exhibits a strong, durable competitive advantage with growing ROIC above WACC, indicating efficient capital use and value creation. CoreWeave shows unfavorable moat status with ROIC below WACC, signifying value erosion despite stable profitability.
Stock Comparison
The stock price chart illustrates significant divergence in price movements over the past 12 months, with CoreWeave, Inc. showing strong gains amid decelerating momentum, while StoneCo Ltd. has experienced a declining trend with consistent bearish signals.

Trend Analysis
CoreWeave, Inc. (CRWV) exhibited a bullish trend over the past year with a 153.08% price increase, though recent months show a 24.29% decline and decelerating momentum. The stock’s volatility remains elevated with a 35.67 standard deviation.
StoneCo Ltd. (STNE) followed a bearish trend, having lost 13.9% over the past year, with continued deceleration and a moderate 2.92 standard deviation. Recent decline of 23.78% underscores ongoing downward pressure.
Comparing both, CoreWeave’s stock delivered the highest market performance over the past 12 months despite recent retracement, whereas StoneCo’s trend remains negative with lower volatility.
Target Prices
Analysts present a clear consensus on target prices for CoreWeave, Inc. and StoneCo Ltd.
| Company | Target High | Target Low | Consensus |
|---|---|---|---|
| CoreWeave, Inc. Class A Common Stock | 175 | 68 | 115.79 |
| StoneCo Ltd. | 20 | 20 | 20 |
CoreWeave’s consensus target price of 115.79 USD suggests upside potential from its current 101.23 USD, while StoneCo’s consensus of 20 USD indicates a moderate increase from its 14.49 USD price. Overall, analyst expectations show growth prospects for both stocks.
Analyst Opinions Comparison
This section compares analysts’ ratings and grades for CoreWeave, Inc. Class A Common Stock (CRWV) and StoneCo Ltd. (STNE):
Rating Comparison
CRWV Rating
- Rating: D+, considered very favorable by analysts.
- Discounted Cash Flow Score: 1, rated very unfavorable.
- ROE Score: 1, rated very unfavorable.
- ROA Score: 1, rated very unfavorable.
- Debt To Equity Score: 1, rated very unfavorable.
- Overall Score: 1, rated very unfavorable.
STNE Rating
- Rating: C, also considered very favorable by analysts.
- Discounted Cash Flow Score: 3, rated moderate.
- ROE Score: 1, rated very unfavorable.
- ROA Score: 1, rated very unfavorable.
- Debt To Equity Score: 1, rated very unfavorable.
- Overall Score: 2, rated moderate.
Which one is the best rated?
Based strictly on the provided data, STNE holds a higher overall score and a better discounted cash flow score than CRWV. Both companies share similarly low scores in ROE, ROA, and debt to equity, but STNE’s ratings suggest a relatively stronger financial position.
Scores Comparison
The comparison of scores between CoreWeave, Inc. Class A Common Stock (CRWV) and StoneCo Ltd. (STNE) is as follows:
CRWV Scores
- Altman Z-Score: 0.80, indicating financial distress.
- Piotroski Score: 3, classified as very weak financial health.
STNE Scores
- Altman Z-Score: 1.02, also indicating financial distress.
- Piotroski Score: 5, classified as average financial health.
Which company has the best scores?
Based strictly on the provided data, STNE shows marginally better scores with a higher Piotroski Score of 5 versus CRWV’s 3, although both are in the Altman Z-Score distress zone. The difference in Piotroski Scores suggests stronger financial health for STNE.
Grades Comparison
Here is a detailed comparison of recent grades assigned to CoreWeave, Inc. Class A Common Stock and StoneCo Ltd.:
CoreWeave, Inc. Class A Common Stock Grades
The following table summarizes CoreWeave’s latest analyst grades from recognized financial institutions:
| Grading Company | Action | New Grade | Date |
|---|---|---|---|
| Barclays | Maintain | Equal Weight | 2026-01-12 |
| Wells Fargo | Maintain | Overweight | 2026-01-08 |
| Jefferies | Maintain | Buy | 2026-01-05 |
| DA Davidson | Upgrade | Neutral | 2026-01-05 |
| Goldman Sachs | Maintain | Neutral | 2025-11-17 |
| HC Wainwright & Co. | Maintain | Buy | 2025-11-12 |
| Wells Fargo | Maintain | Overweight | 2025-11-12 |
| Barclays | Maintain | Equal Weight | 2025-11-12 |
| Loop Capital | Maintain | Buy | 2025-11-12 |
| B of A Securities | Maintain | Neutral | 2025-11-11 |
CoreWeave’s ratings consistently range from Neutral to Buy, showing stable analyst confidence with several upgrades and maintained positive outlooks.
StoneCo Ltd. Grades
The table below details StoneCo’s recent analyst grades from verified grading companies:
| Grading Company | Action | New Grade | Date |
|---|---|---|---|
| Goldman Sachs | Maintain | Buy | 2025-10-14 |
| B of A Securities | Maintain | Buy | 2025-09-09 |
| UBS | Maintain | Buy | 2025-08-29 |
| JP Morgan | Maintain | Overweight | 2025-07-16 |
| Barclays | Maintain | Equal Weight | 2025-05-12 |
| Barclays | Maintain | Equal Weight | 2025-04-23 |
| Citigroup | Upgrade | Buy | 2025-04-22 |
| Barclays | Maintain | Equal Weight | 2025-03-21 |
| Morgan Stanley | Maintain | Underweight | 2025-03-21 |
| Goldman Sachs | Maintain | Buy | 2025-02-06 |
StoneCo’s ratings mostly range from Equal Weight to Buy, with a few underweight ratings, indicating mixed but generally positive sentiment.
Which company has the best grades?
Both CoreWeave and StoneCo have a consensus “Buy” rating, but CoreWeave exhibits a higher concentration of Buy and Overweight grades with fewer neutral or equal weight ratings. Investors might interpret CoreWeave’s more consistently positive grades as a signal of stronger analyst confidence compared to StoneCo’s more varied ratings.
Strengths and Weaknesses
Below is a comparative overview of the key strengths and weaknesses for CoreWeave, Inc. Class A Common Stock (CRWV) and StoneCo Ltd. (STNE) based on the most recent data from 2024-2026.
| Criterion | CoreWeave, Inc. (CRWV) | StoneCo Ltd. (STNE) |
|---|---|---|
| Diversification | Limited product segmentation; narrow focus | Broader presence in financial services ecosystem |
| Profitability | Negative net margin (-45.08%); value destroying | Negative net margin (-11.89%); but creating value overall (ROIC 22.41%) |
| Innovation | High ROE (208.77%) indicates strong innovation potential | Growing ROIC trend (371%) shows innovation driving profitability |
| Global presence | Smaller, less diversified global reach | Stronger market presence, especially in Brazil and Latin America |
| Market Share | Modest, still developing position | More established with durable competitive advantage |
Key takeaways: StoneCo demonstrates a durable competitive advantage with growing profitability and better financial health. CoreWeave shows innovation potential but currently suffers from value destruction and weak profitability, warranting cautious investment consideration.
Risk Analysis
Below is a comparative risk assessment table for CoreWeave, Inc. (CRWV) and StoneCo Ltd. (STNE) based on the most recent 2024 data:
| Metric | CoreWeave, Inc. (CRWV) | StoneCo Ltd. (STNE) |
|---|---|---|
| Market Risk | Very high beta of 21.65, indicating extreme volatility and sensitivity to market swings | Beta of 1.84, moderate market volatility |
| Debt Level | High debt-to-assets ratio at 59.56%, poor interest coverage (-1.06), signaling financial strain | Lower debt-to-assets at 23.53%, interest coverage strong at 5.41 |
| Regulatory Risk | Moderate: operates in US tech cloud sector, subject to data and cloud regulations | High: operates in Brazil fintech, exposed to complex financial regulations and currency risk |
| Operational Risk | Low employee count (881) but rapid scaling needs may stress operations | Larger workforce (7,239), operational complexity in payments and merchant services |
| Environmental Risk | Low direct impact; tech infrastructure with limited environmental footprint | Low direct environmental impact, though fintech operations depend on data centers |
| Geopolitical Risk | Moderate, US-based but exposed to global cloud demand fluctuations | High due to Brazil’s economic and political volatility and currency fluctuations |
Synthesis: CoreWeave faces the most impactful risks from extreme market volatility and high financial leverage, with distress signals in liquidity and debt servicing. StoneCo has lower financial risk but is more exposed to regulatory and geopolitical uncertainties in Brazil, which could affect operational stability and currency valuation. Investors should weigh CoreWeave’s high beta and debt concerns against StoneCo’s regional risks.
Which Stock to Choose?
CoreWeave, Inc. Class A Common Stock (CRWV) shows a strong revenue growth of 737% in 2024 with a favorable gross margin of 74.24%, yet it suffers from negative net margin (-45.08%) and weak liquidity (current ratio 0.39). Its financial ratios are mostly unfavorable, with a high debt-to-assets ratio (59.56%) and negative interest coverage, though return on equity is favorable at 208.77%. The company is rated very favorably overall but demonstrates value destruction as ROIC is well below WACC.
StoneCo Ltd. (STNE) reports moderate revenue growth of 12.1% in 2024 and a high EBIT margin of 44.86%, but it posts a negative net margin (-11.89%) and mixed profitability metrics. Its financial ratios are slightly favorable with a solid current ratio of 1.37, favorable interest coverage, and a reasonable debt-to-assets ratio (23.53%). The company has a moderate rating and shows value creation with ROIC exceeding WACC and improving profitability.
For investors prioritizing rapid growth potential, CoreWeave’s strong revenue expansion and high ROE might appear attractive despite its unfavorable liquidity and value destruction signals. Conversely, StoneCo’s stable profitability, value creation, and stronger financial ratios could be more suitable for those seeking a durable competitive advantage with moderate growth. The choice might depend on an investor’s risk tolerance and preference for growth versus stability.
Disclaimer: Investment carries a risk of loss of initial capital. The past performance is not a reliable indicator of future results. Be sure to understand risks before making an investment decision.
Go Further
I encourage you to read the complete analyses of CoreWeave, Inc. Class A Common Stock and StoneCo Ltd. to enhance your investment decisions: