Home > Comparison > Technology > PLTR vs CRWV
The strategic rivalry between Palantir Technologies Inc. and CoreWeave, Inc. defines the evolving landscape of the software infrastructure sector. Palantir operates as a data analytics powerhouse with deep government ties, while CoreWeave focuses on high-performance cloud computing for AI workloads. This analysis pits Palantir’s platform dominance against CoreWeave’s scalable infrastructure, aiming to identify which trajectory offers superior risk-adjusted returns for a diversified portfolio.

Table of contents
Companies Overview
Palantir Technologies and CoreWeave stand as key players in the software infrastructure market, each shaping data-driven innovation uniquely.
Palantir Technologies Inc.: Data Integration Powerhouse
Palantir dominates the software infrastructure sector by providing advanced platforms like Gotham and Foundry. It generates revenue by enabling intelligence and enterprise clients to analyze complex datasets and operationalize insights. In 2026, Palantir strategically focuses on integrating artificial intelligence through its Palantir AIP, enhancing data transformation and decision-making capabilities.
CoreWeave, Inc.: Cloud Compute Specialist
CoreWeave excels in delivering specialized cloud infrastructure services tailored for AI workloads. Its revenue stems from GPU and CPU compute, storage, and managed services supporting AI model training and rendering. In 2026, the company prioritizes scaling GenAI support and expanding its virtual and bare metal server offerings to meet growing enterprise demand.
Strategic Collision: Similarities & Divergences
Both companies invest heavily in infrastructure software, but Palantir emphasizes data integration and AI-driven analytics, while CoreWeave targets high-performance cloud compute for AI workloads. Their primary battleground is the AI ecosystem, with Palantir focusing on software platforms and CoreWeave on underlying compute resources. This distinction defines their investment profiles: Palantir as a software innovator versus CoreWeave as a cloud infrastructure enabler.
Income Statement Comparison
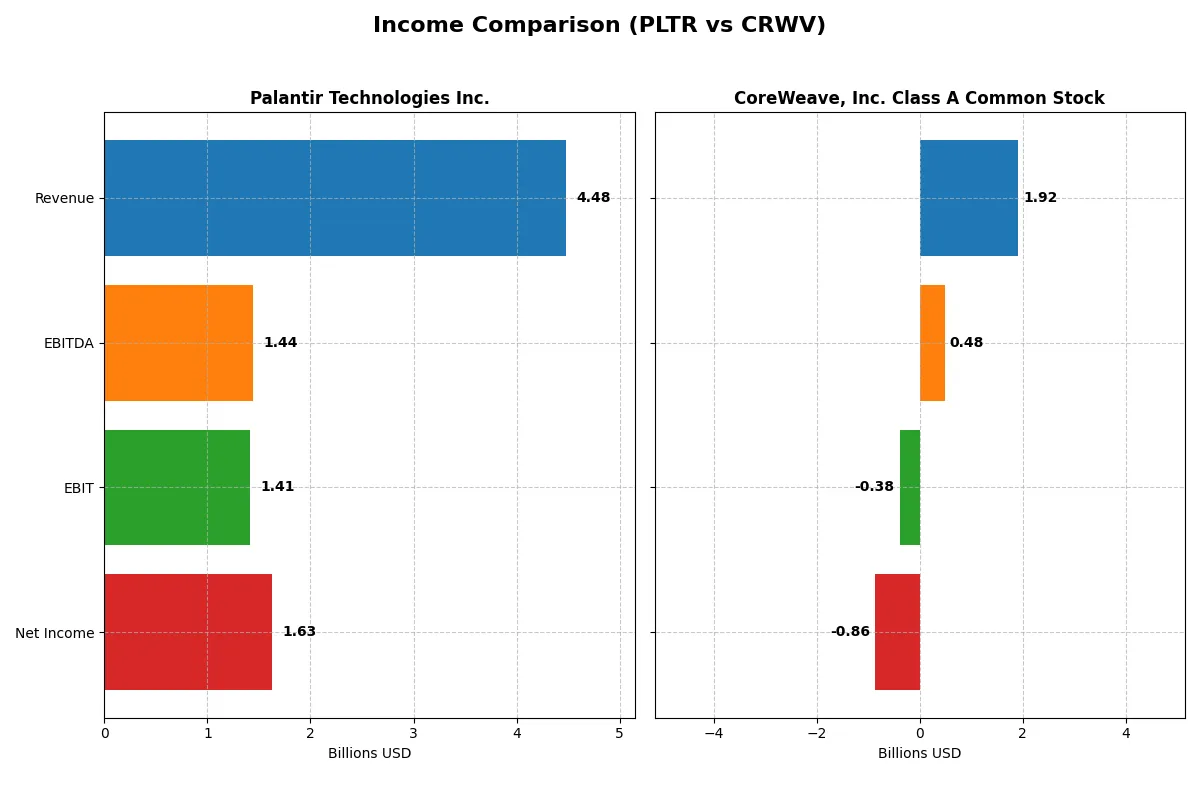
This table dissects the core profitability and scalability of both corporate engines to reveal who dominates the bottom line:
| Metric | Palantir Technologies Inc. (PLTR) | CoreWeave, Inc. Class A Common Stock (CRWV) |
|---|---|---|
| Revenue | 4.48B | 1.92B |
| Cost of Revenue | 789M | 493M |
| Operating Expenses | 2.27B | 1.10B |
| Gross Profit | 3.69B | 1.42B |
| EBITDA | 1.44B | 480M |
| EBIT | 1.41B | -383M |
| Interest Expense | 0 | 361M |
| Net Income | 1.63B | -937M |
| EPS | 0.69 | -2.33 |
| Fiscal Year | 2025 | 2024 |
Income Statement Analysis: The Bottom-Line Duel
This income statement comparison reveals how efficiently each company converts revenue into profit, exposing the strength of their business models.
Palantir Technologies Inc. Analysis
Palantir displays robust revenue growth, surging from 1.54B in 2021 to 4.48B in 2025. Net income mirrors this momentum, rising sharply to 1.63B in 2025. Its gross margin stands impressively at 82%, and the net margin reaches a healthy 36%, signaling excellent cost control and operational efficiency. The 2025 year marks a peak in profitability and margin expansion, reflecting strong execution.
CoreWeave, Inc. Class A Common Stock Analysis
CoreWeave’s revenue jumps explosively from 15.8M in 2022 to 1.92B in 2024, showcasing rapid scale-up. However, it still posts a net loss of 937M in 2024, dragging net margin to -45%. Gross margin is solid at 74%, but high interest expense at nearly 19% and negative EBIT margin underline ongoing profitability challenges. Despite strong top-line growth, CoreWeave’s income statement reflects heavy investment and operating inefficiencies.
Margin Power vs. Revenue Scale
Palantir delivers consistent profitability growth with superior margins and positive net income, while CoreWeave focuses on rapid revenue expansion but struggles to generate profits. Palantir’s profile appeals to investors seeking operational efficiency and margin strength. CoreWeave remains a high-growth speculative play, with significant risks from sustained losses.
Financial Ratios Comparison
These vital ratios act as a diagnostic tool to expose the underlying fiscal health, valuation premiums, and capital efficiency of each company:
| Ratios | Palantir Technologies Inc. (PLTR) | CoreWeave, Inc. Class A Common Stock (CRWV) |
|---|---|---|
| ROE | 22.0% | 208.8% |
| ROIC | 17.9% | 2.1% |
| P/E | 259.2 | -18.7 |
| P/B | 57.0 | -39.1 |
| Current Ratio | 7.11 | 0.39 |
| Quick Ratio | 7.11 | 0.39 |
| D/E | 0.031 | -25.68 (negative equity) |
| Debt-to-Assets | 2.58% | 59.56% |
| Interest Coverage | 0 (no coverage) | 0.90 |
| Asset Turnover | 0.50 | 0.11 |
| Fixed Asset Turnover | 17.76 | 0.13 |
| Payout ratio | 0 | -6.7% (negative payout) |
| Dividend yield | 0% | 0.36% |
| Fiscal Year | 2025 | 2024 |
Efficiency & Valuation Duel: The Vital Signs
Ratios serve as a company’s financial DNA, exposing hidden risks and operational strengths crucial for investor insight.
Palantir Technologies Inc.
Palantir demonstrates robust profitability with a 22% ROE and a strong 36.31% net margin. However, its valuation metrics are stretched, featuring a high P/E of 259 and P/B of 57. The company retains earnings for growth rather than dividends, fueling R&D and operational expansion. Its balance sheet shows solid capital efficiency despite valuation concerns.
CoreWeave, Inc. Class A Common Stock
CoreWeave posts an exceptionally high ROE of 209%, yet suffers from a negative net margin of -45.08%, signaling operational losses. Its valuation ratios reflect this with a negative P/E and P/B, suggesting pronounced volatility. The low current ratio of 0.39 flags liquidity risks. CoreWeave’s reinvestment focuses less on R&D and more on navigating debt and cash flow challenges.
Premium Valuation vs. Operational Safety
Palantir offers a balanced risk-reward profile with strong profitability but stretched valuation. CoreWeave’s impressive ROE masks deeper operational losses and liquidity concerns. For risk-averse investors, Palantir’s stability fits better, while CoreWeave suits those seeking high-risk, high-reward opportunities.
Which one offers the Superior Shareholder Reward?
Palantir Technologies Inc. (PLTR) pays no dividends but generates strong free cash flow (0.89/share in 2025) and maintains robust buybacks, signaling capital return via buybacks. CoreWeave, Inc. (CRWV) offers a modest dividend yield (~0.36%) but suffers negative free cash flow (-14.7/share) and weak buyback capacity. PLTR’s distribution through buybacks is more sustainable and efficient, backed by a pristine balance sheet and high operating margins. In contrast, CRWV’s dividend appears risky given its leverage (debt/assets 60%) and cash burn. I conclude PLTR offers a superior total shareholder return profile in 2026.
Comparative Score Analysis: The Strategic Profile
The radar chart reveals the fundamental DNA and trade-offs of Palantir Technologies Inc. and CoreWeave, Inc. Class A Common Stock:
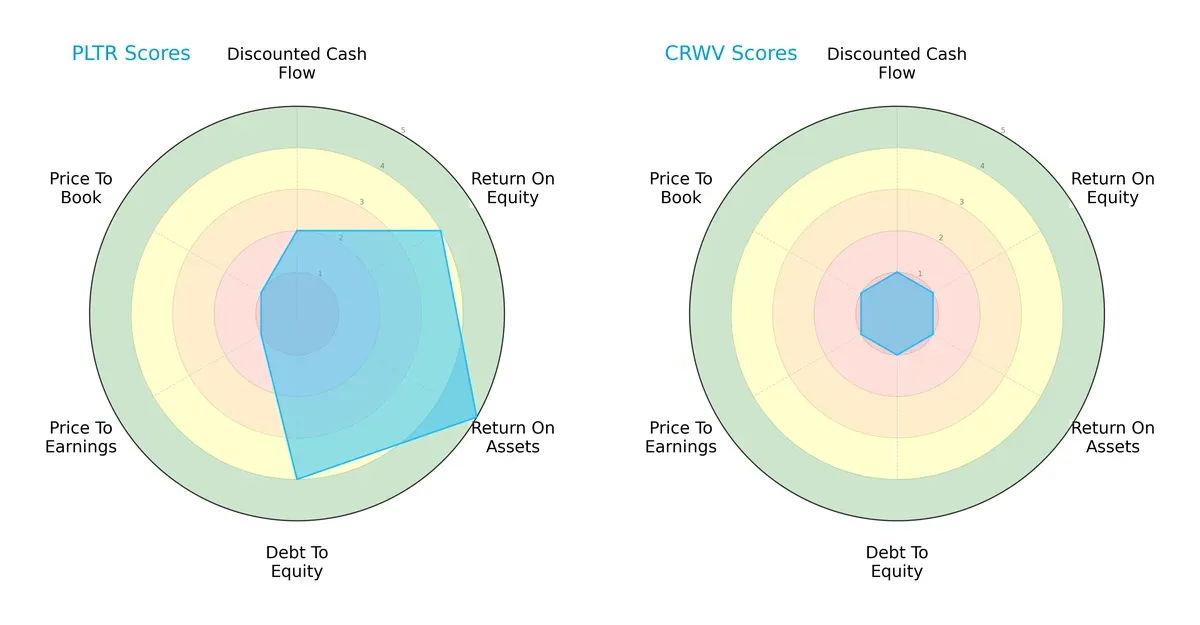
Palantir dominates on ROA (5) and ROE (4), signaling efficient asset and equity use. It maintains a strong debt-to-equity score (4), unlike CoreWeave, which scores a weak 1 across all metrics. Palantir’s valuation scores (PE/PB) are very unfavorable, indicating potential overvaluation. CoreWeave lacks balance, relying on none of these strengths, which flags significant financial risk.
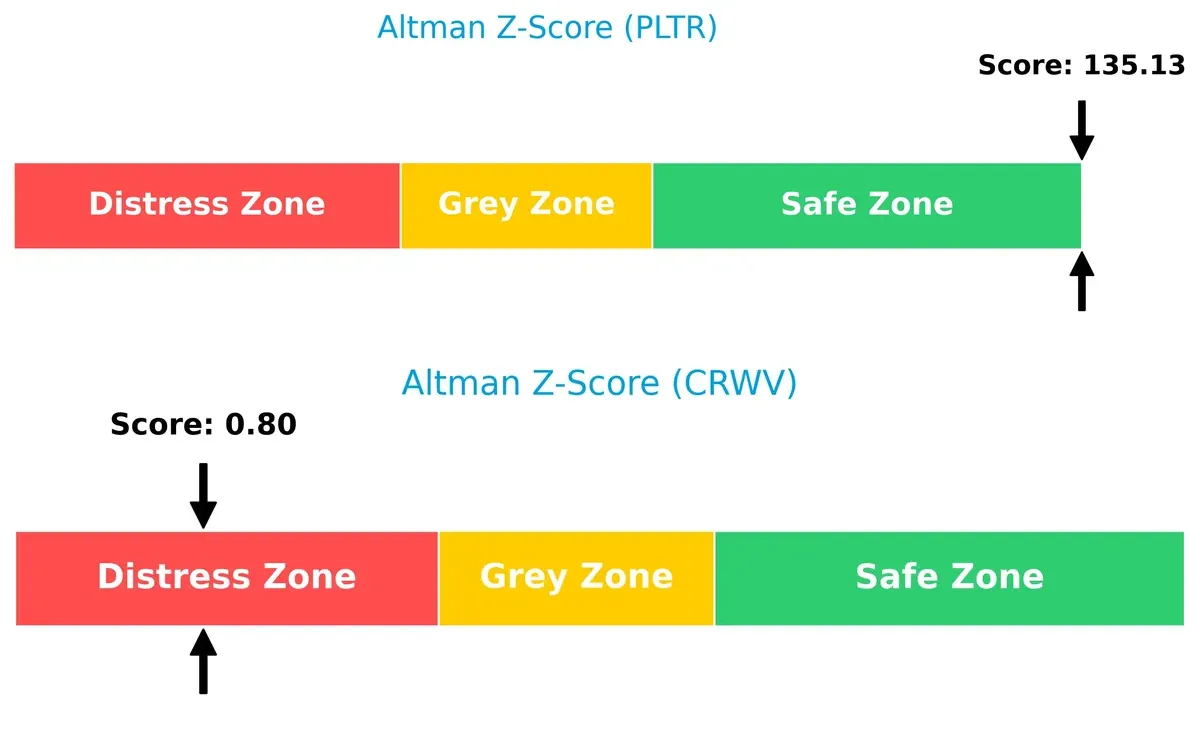
Bankruptcy Risk: Solvency Showdown
Palantir’s Altman Z-Score of 135 firmly places it in the safe zone, while CoreWeave’s 0.8 signals distress, implying a high bankruptcy risk in this cycle:
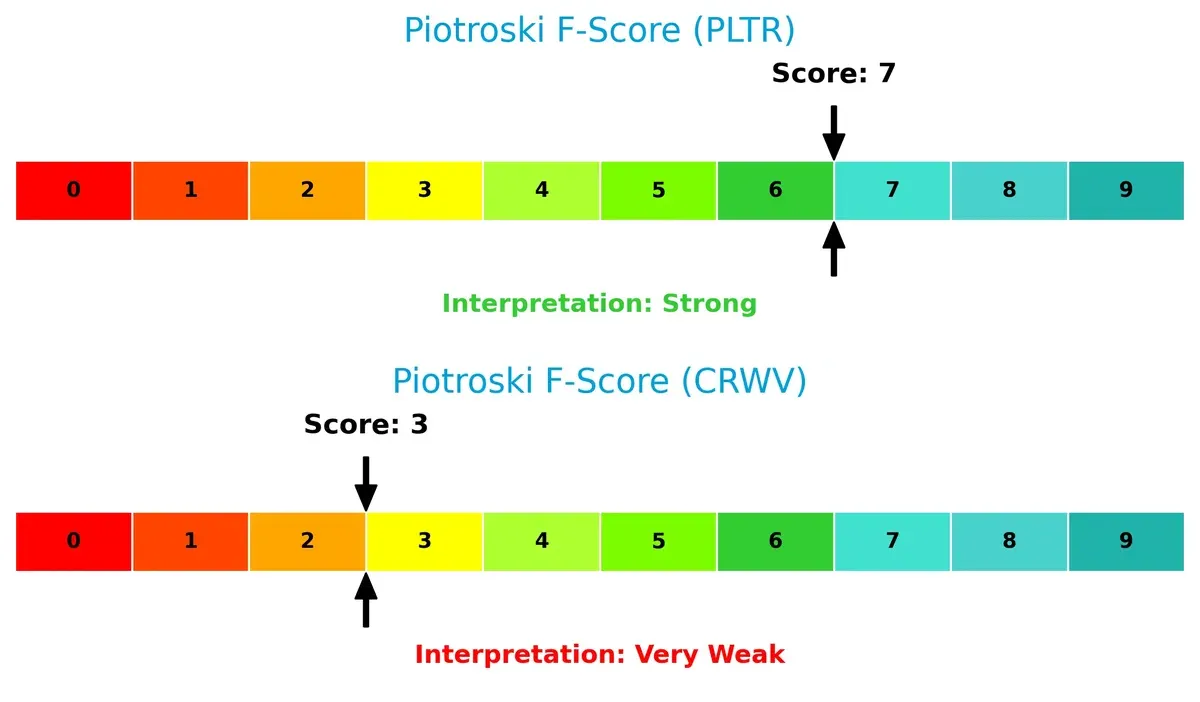
Financial Health: Quality of Operations
Palantir’s Piotroski F-Score of 7 indicates strong financial health. CoreWeave’s 3 reveals weak internal metrics, raising red flags for investors:
How are the two companies positioned?
This section dissects the operational DNA of Palantir and CoreWeave by comparing their revenue distribution and internal strengths and weaknesses. The goal is to confront their economic moats to identify which model offers the most resilient competitive advantage today.
Revenue Segmentation: The Strategic Mix
This visual comparison dissects how Palantir Technologies Inc. and CoreWeave, Inc. Class A diversify their income streams and highlights their primary sector bets:
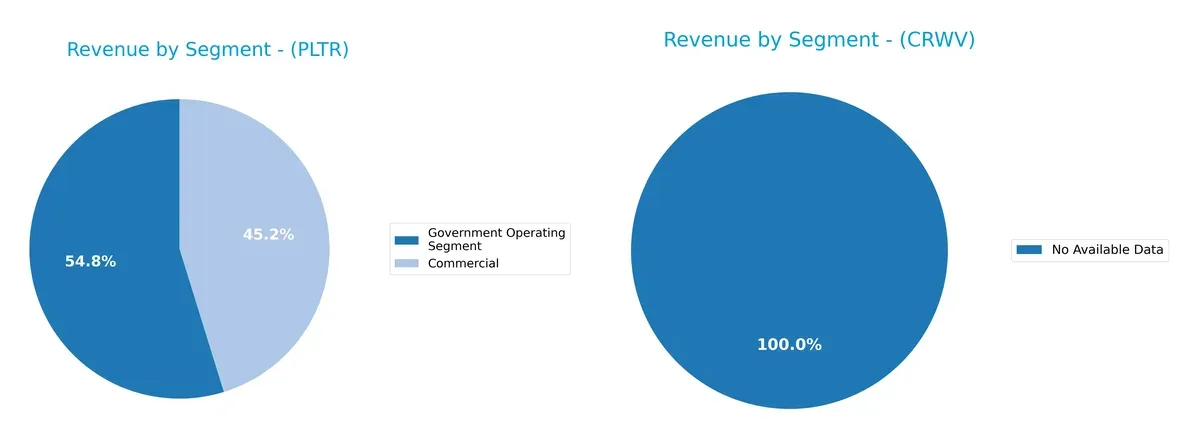
Palantir leans heavily on its Government Operating Segment, which dwarfs Commercial revenue at $1.57B vs. $1.30B in 2024. This concentration anchors Palantir in public-sector infrastructure, creating ecosystem lock-in but also exposing it to government budget cycles. CoreWeave lacks available data, preventing segmentation analysis. Palantir’s mix reflects strategic focus rather than broad diversification, signaling potential concentration risk amid geopolitical spending shifts.
Strengths and Weaknesses Comparison
This table compares the strengths and weaknesses of Palantir Technologies Inc. and CoreWeave, Inc. Class A Common Stock:
Palantir Strengths
- High net margin at 36.31%
- ROE of 22.0% indicates strong profitability
- ROIC of 17.95% surpasses WACC
- Very low debt-to-equity of 0.03
- Strong global presence with diversified US, UK, and Rest of World revenues
- Fixed asset turnover at 17.76 signals efficient use of assets
CoreWeave Strengths
- Exceptionally high ROE at 208.77%
- Favorable P/E and P/B ratios
- Low debt-to-equity ratio despite negative numbers
- Presence of dividend yield, albeit low
- Some positive profitability indicators despite losses
Palantir Weaknesses
- Unfavorable high P/E of 259.19 and P/B of 57.02 suggest overvaluation
- Unfavorable WACC of 11.72%
- Unusually high current ratio at 7.11, potentially inefficient capital use
- Zero dividend yield
- Neutral asset turnover at 0.5
CoreWeave Weaknesses
- Negative net margin at -45.08% signals losses
- ROIC at 2.08% below WACC of 82.83%
- Poor current and quick ratios at 0.39 indicate liquidity risks
- High debt-to-assets at 59.56% creates leverage concerns
- Negative interest coverage ratio
- Low asset turnover and fixed asset turnover
Palantir’s strengths lie in solid profitability and efficient capital use with geographic diversification. CoreWeave faces significant profitability and leverage challenges despite strong ROE and valuation metrics. These factors critically shape each company’s strategic priorities and risk profiles.
The Moat Duel: Analyzing Competitive Defensibility
A structural moat shields long-term profits from relentless competitive pressure and market disruption. Here’s how Palantir and CoreWeave measure up:
Palantir Technologies Inc.: Data Integration & AI Ecosystem Moat
Palantir’s moat stems from its proprietary data platforms and AI integration, driving a 36% net margin and 6.2% ROIC above WACC. Expansion in AI-powered analytics deepens this advantage in 2026.
CoreWeave, Inc. Class A Common Stock: Specialized Compute Infrastructure Moat
CoreWeave leverages GPU-centric cloud infrastructure, differentiating from Palantir’s software moat. Despite massive revenue growth, negative margins and value destruction signal a fragile competitive edge.
Moat Strength: Proprietary AI Platform vs. Infrastructure Scalability
Palantir holds a wider, deeper moat with sustainable value creation and growing ROIC. CoreWeave’s infrastructure niche faces profitability challenges, leaving Palantir better positioned to defend market share.
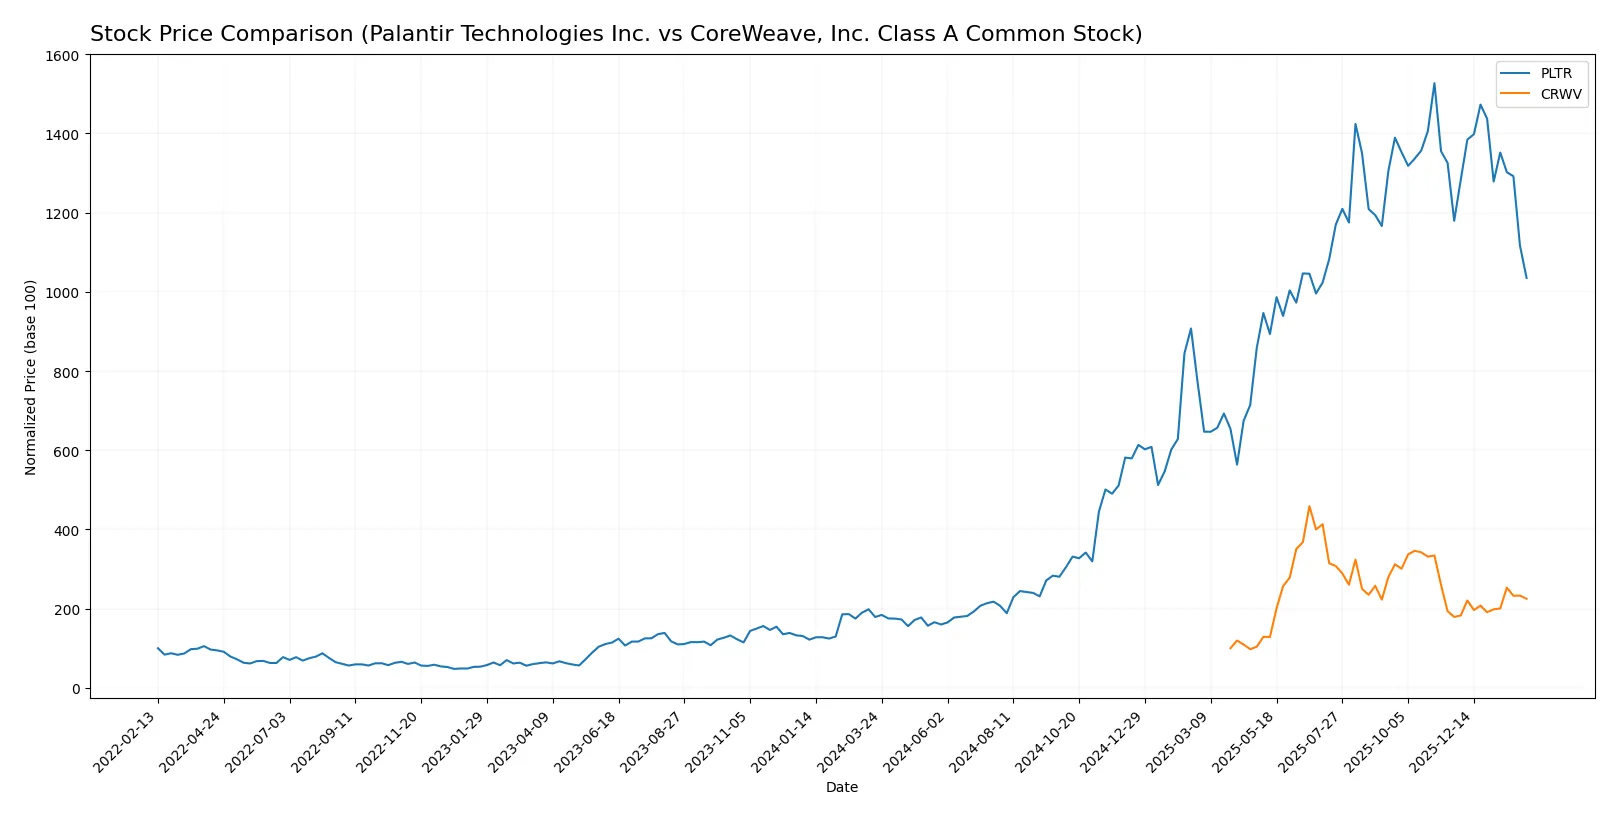
Which stock offers better returns?
Over the past year, Palantir Technologies and CoreWeave exhibited strong price rallies with distinct recent trading dynamics and contrasting momentum shifts.
Trend Comparison
Palantir Technologies gained 479% over the past year, signaling a bullish trend but with decelerating momentum and a recent 12.2% decline from November 2025 to February 2026.
CoreWeave rose 125% in the past year with accelerating momentum and a recent 25.5% gain in the same period, reinforcing a bullish trend with increasing strength.
CoreWeave outperformed Palantir in recent months, delivering the highest market performance despite Palantir’s stronger full-year gain but recent weakness.
Target Prices
Analysts present a moderately bullish consensus on Palantir Technologies Inc. and CoreWeave, Inc.
| Company | Target Low | Target High | Consensus |
|---|---|---|---|
| Palantir Technologies Inc. | 180 | 230 | 200.15 |
| CoreWeave, Inc. Class A Common Stock | 84 | 175 | 120.73 |
Palantir’s target consensus at 200.15 suggests a 47% upside from current price 135.9. CoreWeave’s consensus of 120.73 implies a 34% potential gain from 89.95.

Don’t Let Luck Decide Your Entry Point
Optimize your entry points with our advanced ProRealTime indicators. You’ll get efficient buy signals with precise price targets for maximum performance. Start outperforming now!
How do institutions grade them?
The following tables summarize recent institutional grades for Palantir Technologies Inc. and CoreWeave, Inc. Class A Common Stock:
Palantir Technologies Inc. Grades
This table shows the latest grades and actions from major financial institutions for Palantir Technologies Inc.
| Grading Company | Action | New Grade | Date |
|---|---|---|---|
| UBS | maintain | Neutral | 2026-02-03 |
| Citigroup | maintain | Buy | 2026-02-03 |
| DA Davidson | maintain | Neutral | 2026-02-03 |
| Citigroup | upgrade | Buy | 2026-01-12 |
| DA Davidson | maintain | Neutral | 2025-11-04 |
| RBC Capital | maintain | Underperform | 2025-11-04 |
| Baird | maintain | Neutral | 2025-11-04 |
| Goldman Sachs | maintain | Neutral | 2025-11-04 |
| Mizuho | maintain | Neutral | 2025-11-04 |
| Morgan Stanley | maintain | Equal Weight | 2025-11-04 |
CoreWeave, Inc. Class A Common Stock Grades
This table lists recent grades and rating changes from key institutions for CoreWeave, Inc.
| Grading Company | Action | New Grade | Date |
|---|---|---|---|
| Macquarie | maintain | Neutral | 2026-01-27 |
| Deutsche Bank | upgrade | Buy | 2026-01-27 |
| Mizuho | maintain | Neutral | 2026-01-27 |
| DA Davidson | upgrade | Buy | 2026-01-26 |
| Needham | maintain | Hold | 2026-01-26 |
| Barclays | maintain | Equal Weight | 2026-01-12 |
| Wells Fargo | maintain | Overweight | 2026-01-08 |
| DA Davidson | upgrade | Neutral | 2026-01-05 |
| Jefferies | maintain | Buy | 2026-01-05 |
| Goldman Sachs | maintain | Neutral | 2025-11-17 |
Which company has the best grades?
CoreWeave shows multiple upgrades to Buy ratings and maintains Overweight from Wells Fargo, suggesting stronger institutional confidence. Palantir holds mostly Neutral and some Underperform grades, indicating a more cautious stance. Investors may view CoreWeave’s more positive consensus as a signal of better near-term prospects.
Risks specific to each company
The following categories identify the critical pressure points and systemic threats facing both firms in the 2026 market environment:
1. Market & Competition
Palantir Technologies Inc.
- Established software infrastructure leader with strong government and commercial contracts, facing intense tech sector rivalry.
CoreWeave, Inc. Class A Common Stock
- Emerging cloud platform in GenAI with rapid growth but highly competitive in GPU compute and AI services.
2. Capital Structure & Debt
Palantir Technologies Inc.
- Very low debt-to-equity ratio (0.03) and strong interest coverage minimize financial risk.
CoreWeave, Inc. Class A Common Stock
- High debt-to-assets (59.56%) and negative interest coverage signal significant leverage stress and refinancing risks.
3. Stock Volatility
Palantir Technologies Inc.
- Beta of 1.69 indicates moderate volatility, typical for tech infrastructure stocks.
CoreWeave, Inc. Class A Common Stock
- Extremely high beta of 21.65 reflects extreme price swings and speculative trading risk.
4. Regulatory & Legal
Palantir Technologies Inc.
- Operates globally with exposure to data privacy and government contract regulations.
CoreWeave, Inc. Class A Common Stock
- Faces evolving regulations in cloud infrastructure and AI deployment, with potential compliance costs.
5. Supply Chain & Operations
Palantir Technologies Inc.
- Software delivery model reduces supply chain risks but relies on continuous tech innovation.
CoreWeave, Inc. Class A Common Stock
- Hardware-dependent operations expose it to semiconductor shortages and supply chain disruptions.
6. ESG & Climate Transition
Palantir Technologies Inc.
- Limited public ESG footprint; energy efficiency of software platforms is a focus but faces scrutiny.
CoreWeave, Inc. Class A Common Stock
- Heavy GPU use implies high energy consumption; sustainability initiatives critical for future compliance.
7. Geopolitical Exposure
Palantir Technologies Inc.
- Significant exposure to US and allied government contracts; geopolitical tensions could impact sales.
CoreWeave, Inc. Class A Common Stock
- Primarily US-based but global cloud demand subjects it to international trade and regulatory uncertainties.
Which company shows a better risk-adjusted profile?
Palantir’s low leverage and stable operational model outweigh CoreWeave’s high financial risk and extreme stock volatility. Palantir’s most impactful risk is regulatory sensitivity due to government contracts. CoreWeave faces critical financial distress from excessive debt and poor liquidity. Palantir’s Altman Z-score in the safe zone versus CoreWeave’s distress zone confirms a superior risk-adjusted profile. Recent CoreWeave stock surges belie underlying solvency concerns, heightening caution.
Final Verdict: Which stock to choose?
Palantir Technologies excels as a cash-generating powerhouse with a rare ability to convert invested capital into robust returns well above its cost of capital. Its main point of vigilance remains a sky-high valuation that could pressure patient investors. It fits best within an Aggressive Growth portfolio seeking sustained technological leadership.
CoreWeave’s strategic moat lies in its niche cloud computing infrastructure, showing explosive revenue growth but struggling with profitability and financial stability. Compared to Palantir, it presents a riskier profile but offers a high-reward scenario for portfolios focused on speculative GARP (Growth at a Reasonable Price) strategies.
If you prioritize durable profitability and a proven economic moat, Palantir outshines as the compelling choice due to its consistent value creation and financial strength. However, if you seek rapid top-line growth with tolerance for volatility, CoreWeave offers superior upside potential despite its structural risks and weaker financial footing.
Disclaimer: Investment carries a risk of loss of initial capital. The past performance is not a reliable indicator of future results. Be sure to understand risks before making an investment decision.
Go Further
I encourage you to read the complete analyses of Palantir Technologies Inc. and CoreWeave, Inc. Class A Common Stock to enhance your investment decisions: