In the dynamic realm of software infrastructure, CoreWeave, Inc. (CRWV) and Okta, Inc. (OKTA) stand out as innovative leaders shaping the future of cloud computing and identity solutions. Both companies operate within overlapping markets, focusing on scalable, secure technology platforms that empower enterprises. This comparison explores their strategic approaches and growth potentials to help you decide which stock might best enhance your investment portfolio in 2026.

Table of contents
Companies Overview
I will begin the comparison between CoreWeave and Okta by providing an overview of these two companies and their main differences.
CoreWeave Overview
CoreWeave, Inc. operates a cloud platform specializing in scaling, support, and acceleration for GenAI workloads. The company builds infrastructure for enterprise compute tasks, offering GPU and CPU compute, storage, networking, and managed services. Founded in 2017 and based in New Jersey, CoreWeave focuses on advanced cloud infrastructure solutions, including AI model training and VFX rendering, positioning itself in the software infrastructure market with a $50.4B market cap.
Okta Overview
Okta, Inc. provides identity management solutions to enterprises, SMBs, universities, and government agencies globally. Its Okta Identity Cloud offers services such as Single Sign-On, Multi-Factor Authentication, and Lifecycle Management, aimed at securing user and application profiles. Founded in 2009 and headquartered in San Francisco, Okta operates in the software infrastructure sector with a market cap of $15.2B, emphasizing security and identity for cloud and on-premise environments.
Key similarities and differences
Both CoreWeave and Okta operate in the technology sector within software infrastructure, serving enterprise customers with cloud-based platforms. CoreWeave focuses on compute infrastructure and AI workload acceleration, while Okta specializes in identity and access management solutions. CoreWeave’s business centers on hardware-accelerated compute services, whereas Okta offers security and authentication software, reflecting distinct but complementary roles in cloud infrastructure.
Income Statement Comparison
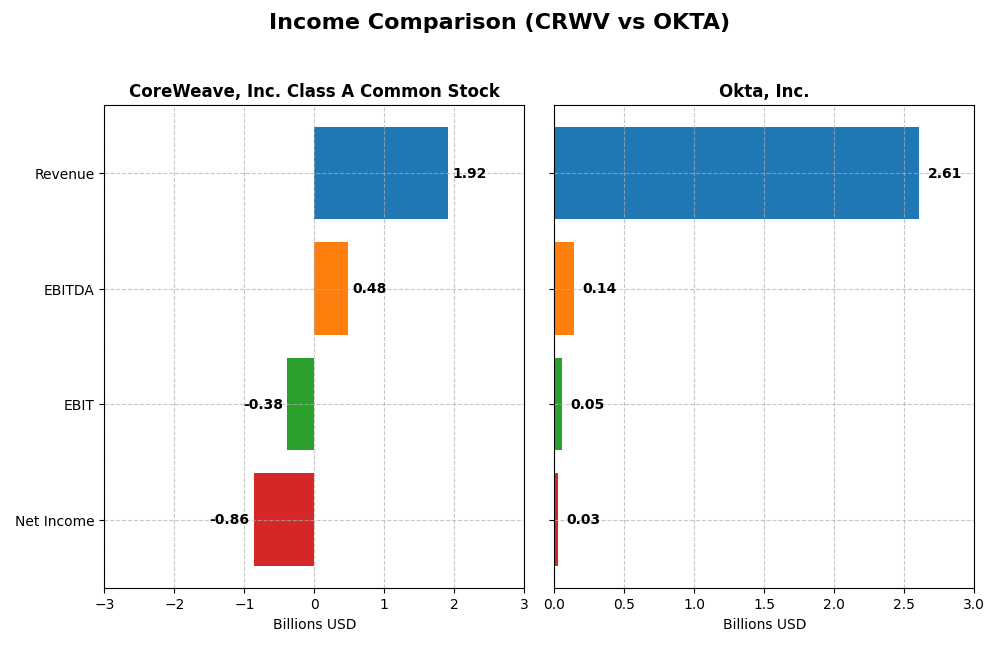
The table below compares the key income statement metrics for CoreWeave, Inc. Class A Common Stock and Okta, Inc. based on their most recent fiscal year data.
| Metric | CoreWeave, Inc. Class A Common Stock | Okta, Inc. |
|---|---|---|
| Market Cap | 50.4B | 15.2B |
| Revenue | 1.92B | 2.61B |
| EBITDA | 480M | 139M |
| EBIT | -383M | 51M |
| Net Income | -937.8M | 28M |
| EPS | -2.33 | 0.06 |
| Fiscal Year | 2024 | 2025 |
Income Statement Interpretations
CoreWeave, Inc. Class A Common Stock
CoreWeave’s revenue surged dramatically from $15.8M in 2022 to $1.92B in 2024, showing exceptional growth. Despite this, net income remained negative, reaching -$863M in 2024, reflecting ongoing losses. Gross margin is strong at 74.24%, but EBIT margin and net margin remain unfavorable. The latest year shows solid revenue and gross profit growth, though losses persist.
Okta, Inc.
Okta experienced steady revenue growth from $835M in 2021 to $2.61B in 2025, with net income turning positive in 2025 at $28M. Gross margin remained stable and favorable around 76.32%, while EBIT and net margins improved to neutral and slightly positive levels respectively. The 2025 results highlight improved profitability and consistent margin enhancement alongside revenue growth.
Which one has the stronger fundamentals?
Okta demonstrates stronger fundamentals with consistent revenue growth, positive net income in the latest year, and favorable margins across the board. CoreWeave shows explosive revenue growth but sustained net losses and unfavorable margins persist, indicating higher risk. Overall, Okta’s improving profitability and margin stability position it as the company with more solid income statement fundamentals.
Financial Ratios Comparison
The table below presents a side-by-side comparison of key financial ratios for CoreWeave, Inc. Class A Common Stock (CRWV) and Okta, Inc. (OKTA) for their most recent fiscal years, offering insights into profitability, liquidity, leverage, efficiency, and shareholder returns.
| Ratios | CoreWeave, Inc. (CRWV) 2024 | Okta, Inc. (OKTA) 2025 |
|---|---|---|
| ROE | 2.09% | 0.44% |
| ROIC | 2.08% | -0.61% |
| P/E | -18.7 | 570.6 |
| P/B | -39.1 | 2.49 |
| Current Ratio | 0.39 | 1.35 |
| Quick Ratio | 0.39 | 1.35 |
| D/E (Debt-to-Equity) | -25.68 | 0.15 |
| Debt-to-Assets | 59.6% | 10.1% |
| Interest Coverage | 0.90 | -14.8 |
| Asset Turnover | 0.11 | 0.28 |
| Fixed Asset Turnover | 0.13 | 22.31 |
| Payout Ratio | -6.7% | 0% |
| Dividend Yield | 0.36% | 0% |
Interpretation of the Ratios
CoreWeave, Inc. Class A Common Stock
CoreWeave shows weak financial health with unfavorable net margin (-45.08%), low current and quick ratios (0.39), and high debt-to-assets (59.56%), despite a strong return on equity (208.77%). The company does not pay dividends, which likely reflects reinvestment needs and negative free cash flow, hinting at a growth or development phase without shareholder payouts.
Okta, Inc.
Okta presents a mixed picture: several favorable ratios such as low debt-to-assets (10.09%), strong interest coverage (10.2), and quick ratio (1.35), but weak profitability metrics including a low net margin (1.07%) and return on equity (0.44%). Okta also does not pay dividends, consistent with a reinvestment strategy and prioritizing growth and R&D over shareholder distributions.
Which one has the best ratios?
Okta has a more balanced ratio profile with a neutral overall rating, showing better liquidity and solvency metrics compared to CoreWeave’s predominantly unfavorable ratios. CoreWeave’s financials appear weaker, marked by liquidity issues and high leverage. Thus, Okta demonstrates a relatively stronger financial position based on the available ratio evaluations.
Strategic Positioning
This section compares the strategic positioning of CoreWeave and Okta, including their market position, key segments, and exposure to technological disruption:
CoreWeave, Inc. Class A Common Stock
- Leading cloud infrastructure provider with high beta, facing intense competitive pressure.
- Focused on GPU/CPU compute, storage, networking, AI workloads, and VFX rendering infrastructure.
- Positioned in cloud infrastructure supporting GenAI, exposed to rapid AI and cloud computing advances.
Okta, Inc.
- Identity solutions leader with moderate beta, competing in a dynamic security software market.
- Concentrated on identity cloud services, including subscription-based identity and security solutions.
- Exposed to evolving identity security technologies, including multi-factor and passwordless authentication.
CoreWeave, Inc. Class A Common Stock vs Okta, Inc. Positioning
CoreWeave adopts a diversified infrastructure approach supporting diverse compute workloads, while Okta concentrates on identity management software. CoreWeave’s broad product portfolio contrasts with Okta’s focused subscription and service model, reflecting different strategic scopes and market exposure.
Which has the best competitive advantage?
Both companies currently shed value with ROIC below WACC, but Okta shows improving profitability with a growing ROIC trend, indicating a slightly more favorable competitive advantage compared to CoreWeave’s unfavorable moat status.
Stock Comparison
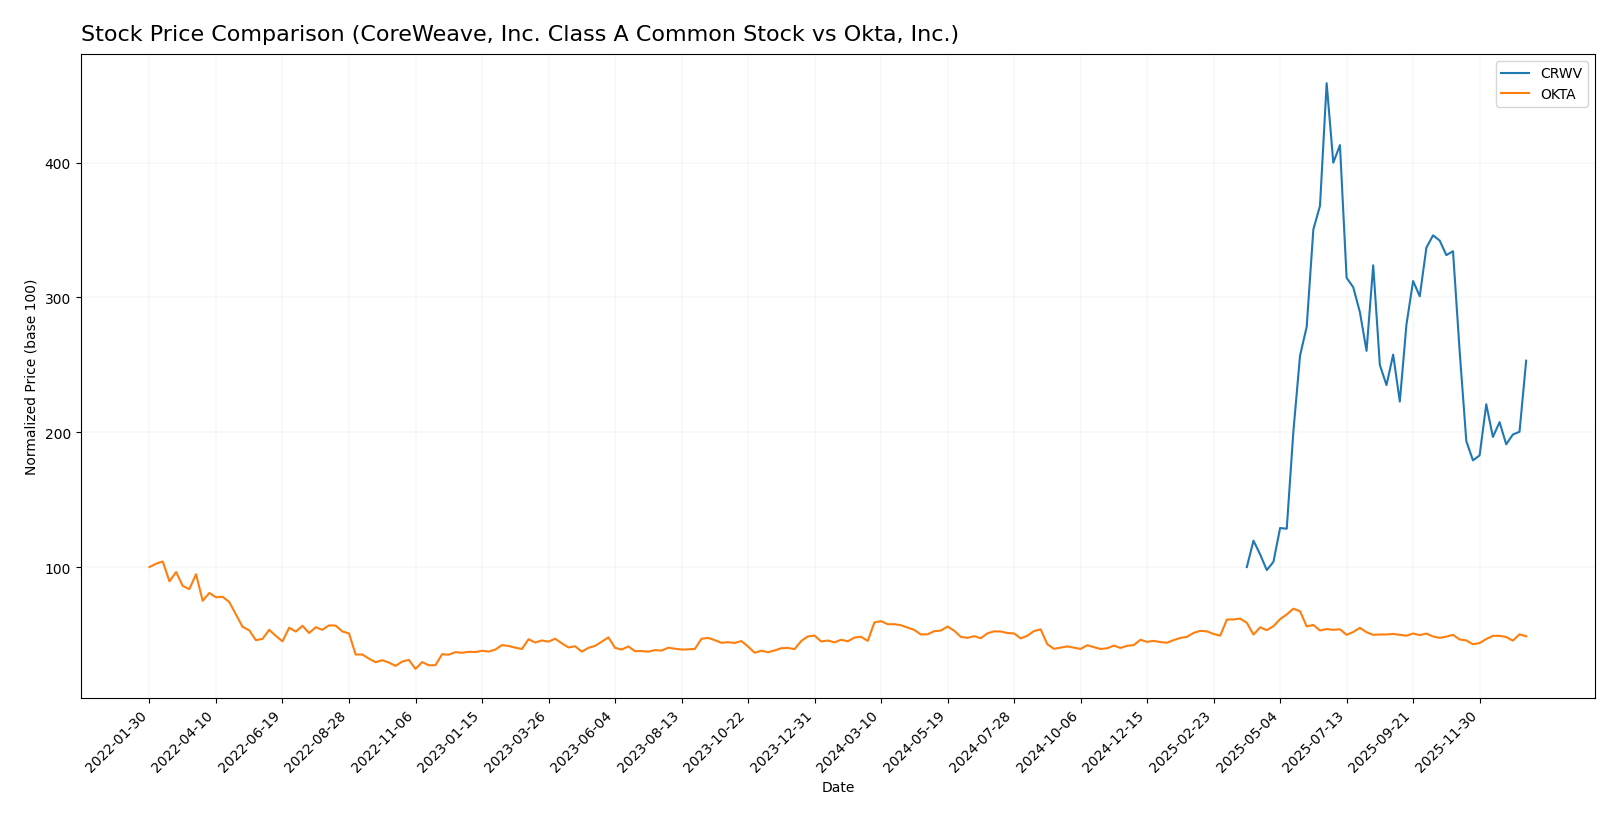
The stock price dynamics over the past 12 months reveal significant growth for CoreWeave, Inc. Class A Common Stock alongside moderate gains for Okta, Inc., with contrasting recent downward trends.
Trend Analysis
CoreWeave, Inc. Class A Common Stock (CRWV) experienced a strong bullish trend over the past year, rising by 153.08%, though this growth showed deceleration. Recently, it faced a notable decline of 24.29% from November 2025 to January 2026.
Okta, Inc. (OKTA) posted a bullish overall performance with a 7.58% increase and accelerating momentum. Its recent trend was slightly negative at -2.16%, but with a mild upward slope indicating stabilization.
Comparing both, CoreWeave delivered the highest market performance with a substantial 153.08% gain versus Okta’s moderate 7.58% increase over the last 12 months.
Target Prices
The current analyst consensus suggests promising upside potential for both CoreWeave, Inc. and Okta, Inc.
| Company | Target High | Target Low | Consensus |
|---|---|---|---|
| CoreWeave, Inc. Class A Common Stock | 175 | 68 | 115.79 |
| Okta, Inc. | 140 | 60 | 110.67 |
Analysts expect CoreWeave to trade above its current price of 101.23 USD, with a consensus target of 115.79 USD. Okta’s consensus target of 110.67 USD also suggests upside from its current 89.55 USD price, reflecting favorable market outlooks.
Analyst Opinions Comparison
This section compares analysts’ ratings and financial scores for CoreWeave, Inc. Class A Common Stock and Okta, Inc.:
Rating Comparison
CRWV Rating
- Rating: D+ indicating a very unfavorable outlook
- Discounted Cash Flow Score: 1, very unfavorable
- ROE Score: 1, very unfavorable
- ROA Score: 1, very unfavorable
- Debt To Equity Score: 1, very unfavorable
- Overall Score: 1, very unfavorable
OKTA Rating
- Rating: B reflecting a very favorable outlook
- Discounted Cash Flow Score: 4, favorable
- ROE Score: 2, moderate
- ROA Score: 3, moderate
- Debt To Equity Score: 4, favorable
- Overall Score: 3, moderate
Which one is the best rated?
Based strictly on the provided data, Okta holds a significantly better rating and higher financial scores across all measured criteria compared to CoreWeave, which scores very low on all metrics. Okta is clearly the better-rated company.
Scores Comparison
Here is a comparison of the Altman Z-Score and Piotroski Score for CoreWeave and Okta:
CoreWeave Scores
- Altman Z-Score: 0.80, in distress zone indicating high bankruptcy risk.
- Piotroski Score: 3, classified as very weak financial strength.
Okta Scores
- Altman Z-Score: 4.15, in safe zone indicating low bankruptcy risk.
- Piotroski Score: 8, classified as very strong financial strength.
Which company has the best scores?
Based on the provided data, Okta shows significantly better financial health with a safe zone Altman Z-Score and a very strong Piotroski Score. CoreWeave’s scores indicate financial distress and very weak strength.
Grades Comparison
The following presents the latest grades for CoreWeave, Inc. Class A Common Stock and Okta, Inc.:
CoreWeave, Inc. Class A Common Stock Grades
This table summarizes recent grades assigned by reputable financial institutions for CoreWeave, Inc.:
| Grading Company | Action | New Grade | Date |
|---|---|---|---|
| Barclays | Maintain | Equal Weight | 2026-01-12 |
| Wells Fargo | Maintain | Overweight | 2026-01-08 |
| Jefferies | Maintain | Buy | 2026-01-05 |
| DA Davidson | Upgrade | Neutral | 2026-01-05 |
| Goldman Sachs | Maintain | Neutral | 2025-11-17 |
| HC Wainwright & Co. | Maintain | Buy | 2025-11-12 |
| Wells Fargo | Maintain | Overweight | 2025-11-12 |
| Barclays | Maintain | Equal Weight | 2025-11-12 |
| Loop Capital | Maintain | Buy | 2025-11-12 |
| B of A Securities | Maintain | Neutral | 2025-11-11 |
CoreWeave’s grades show a generally positive trend with multiple “Buy” and “Overweight” ratings, alongside several “Neutral” and “Equal Weight” assessments.
Okta, Inc. Grades
This table details recent grades issued by recognized analysts for Okta, Inc.:
| Grading Company | Action | New Grade | Date |
|---|---|---|---|
| Stephens & Co. | Upgrade | Overweight | 2026-01-14 |
| Piper Sandler | Maintain | Neutral | 2026-01-05 |
| RBC Capital | Maintain | Outperform | 2026-01-05 |
| Jefferies | Upgrade | Buy | 2025-12-16 |
| Needham | Maintain | Buy | 2025-12-12 |
| BTIG | Maintain | Buy | 2025-12-04 |
| Susquehanna | Maintain | Neutral | 2025-12-03 |
| Cantor Fitzgerald | Maintain | Overweight | 2025-12-03 |
| Canaccord Genuity | Maintain | Buy | 2025-12-03 |
| Scotiabank | Maintain | Sector Perform | 2025-12-03 |
Okta’s ratings display a solid positive outlook with numerous “Buy,” “Overweight,” and “Outperform” grades, complemented by some “Neutral” assessments.
Which company has the best grades?
Okta, Inc. has received generally stronger grades, including multiple “Buy,” “Overweight,” and “Outperform” ratings, compared to CoreWeave’s combination of “Buy,” “Overweight,” and more frequent “Neutral” grades. This suggests investors may perceive Okta as having a more favorable growth or risk profile.
Strengths and Weaknesses
The table below summarizes the key strengths and weaknesses of CoreWeave, Inc. Class A Common Stock (CRWV) and Okta, Inc. (OKTA) based on recent financial and operational data.
| Criterion | CoreWeave, Inc. (CRWV) | Okta, Inc. (OKTA) |
|---|---|---|
| Diversification | Limited product range, focused on niche markets | Strong product segmentation with Subscription & Circulation dominant (2.56B USD in 2025) and Technology Service (54M USD) |
| Profitability | Negative net margin (-45.08%), ROIC 2.08%, shedding value | Slightly positive net margin (1.07%), ROIC negative (-0.61%), but improving profitability trend |
| Innovation | Moderate innovation, with stable but unfavorable ROIC trend | High innovation with growing ROIC (+92%), strong asset turnover (22.31) |
| Global presence | Smaller scale, limited global footprint | Established global presence supporting subscription growth |
| Market Share | Small market share in a specialized sector | Growing market share supported by strong subscription revenue growth |
Key takeaways: CoreWeave struggles with profitability and diversification but has a solid ROE. Okta shows improving profitability and innovation with a robust subscription revenue base, though profitability remains slightly unfavorable. Investors should weigh Okta’s growth potential against CoreWeave’s current value erosion.
Risk Analysis
Below is a comparative table summarizing key risk metrics for CoreWeave, Inc. Class A Common Stock (CRWV) and Okta, Inc. (OKTA) based on the most recent fiscal years.
| Metric | CoreWeave, Inc. (CRWV) | Okta, Inc. (OKTA) |
|---|---|---|
| Market Risk | Very high beta of 21.65, indicating extreme volatility | Low beta of 0.76, indicating lower volatility |
| Debt Level | High debt to assets ratio at 59.56%, unfavorable interest coverage (-1.06) | Low debt to assets at 10.09%, strong interest coverage (10.2) |
| Regulatory Risk | Moderate, operating in cloud infrastructure with evolving AI regulations | Moderate, identity and security sector subject to data privacy laws |
| Operational Risk | Low asset turnover (0.11), weak liquidity ratios (current 0.39) | Moderate asset turnover (0.28), better liquidity (current 1.35) |
| Environmental Risk | Low direct exposure, but energy-intensive GPU infrastructure | Low direct exposure; software-based business |
| Geopolitical Risk | Moderate, US-based with global customers; supply chain sensitivity for hardware | Moderate, US-based with international presence |
CoreWeave faces the most impactful risks from extreme market volatility and high leverage, combined with weak liquidity and profitability metrics, raising bankruptcy concerns. Okta demonstrates better financial stability and lower market risk, though valuation remains a caution with a high P/E ratio. Investors should weigh CoreWeave’s growth potential against its financial distress signals and Okta’s stability against its premium valuation.
Which Stock to Choose?
CoreWeave, Inc. Class A Common Stock (CRWV) shows strong revenue growth with a 736.64% increase in one year, but suffers from negative net margin (-45.08%) and weak debt coverage. Its financial ratios are mostly unfavorable, and the company is currently destroying value, reflected in a very unfavorable rating and distress zone scores.
Okta, Inc. (OKTA) presents moderate revenue growth of 15.33% in one year with positive but low net margin (1.07%) and better debt management. Its financial ratios are balanced between favorable and unfavorable, with a slightly unfavorable moat status but improving profitability and a solid overall rating, supported by safe zone bankruptcy scores and strong financial health indicators.
Investors seeking growth exposure might find CoreWeave’s rapid revenue expansion appealing despite its financial challenges, while those prioritizing financial stability and improving profitability could see Okta as more aligned with moderate risk tolerance and quality investing profiles.
Disclaimer: Investment carries a risk of loss of initial capital. The past performance is not a reliable indicator of future results. Be sure to understand risks before making an investment decision.
Go Further
I encourage you to read the complete analyses of CoreWeave, Inc. Class A Common Stock and Okta, Inc. to enhance your investment decisions: