In today’s fast-evolving technology landscape, CoreWeave, Inc. (CRWV) and Nutanix, Inc. (NTNX) stand out as innovators in the software infrastructure sector. Both companies provide cloud platforms that support enterprise computing, yet they approach market demands with distinct strategies—CoreWeave focuses on cutting-edge GPU acceleration for AI workloads, while Nutanix emphasizes hybrid cloud orchestration and virtualization. This article will help you decide which company presents the most compelling investment opportunity.
Table of contents
Companies Overview
I will begin the comparison between CoreWeave and Nutanix by providing an overview of these two companies and their main differences.
CoreWeave Overview
CoreWeave, Inc. operates a cloud platform focused on scaling, support, and acceleration for GenAI workloads. The company builds infrastructure that supports compute workloads including GPU and CPU compute, storage, networking, and managed services. CoreWeave also provides specialized services like VFX rendering and AI model training. Founded in 2017 and based in Livingston, NJ, CoreWeave has a market cap of approximately 50.4B USD.
Nutanix Overview
Nutanix, Inc. offers an enterprise cloud platform with a broad suite of products including virtualization, storage, cloud governance, and automation services. Its solutions cover hybrid cloud orchestration, Kubernetes management, and desktop-as-a-service offerings. Founded in 2009 and headquartered in San Jose, CA, Nutanix serves multiple industries worldwide and has a market cap near 12.4B USD.
Key similarities and differences
Both CoreWeave and Nutanix operate in the software infrastructure industry, providing cloud-related platforms and services. CoreWeave emphasizes GPU-accelerated compute and AI workloads, while Nutanix focuses on enterprise cloud virtualization, hybrid cloud management, and automation. CoreWeave is a younger, smaller company with higher market cap and volatility, whereas Nutanix is more established with a broader product portfolio and global customer base.
Income Statement Comparison
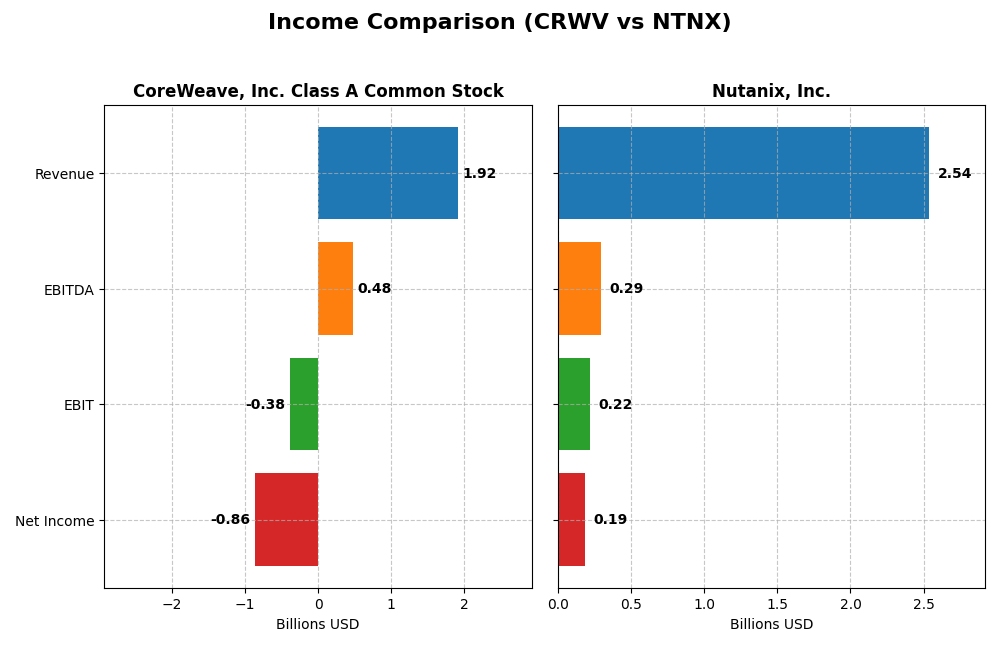
This table presents the most recent full fiscal year income statement figures for CoreWeave, Inc. Class A Common Stock (CRWV) and Nutanix, Inc. (NTNX), allowing a direct financial performance comparison.
| Metric | CoreWeave, Inc. Class A Common Stock (CRWV) | Nutanix, Inc. (NTNX) |
|---|---|---|
| Market Cap | 50.4B | 12.4B |
| Revenue | 1.92B | 2.54B |
| EBITDA | 480M | 293M |
| EBIT | -383M | 220M |
| Net Income | -937M | 188M |
| EPS | -2.33 | 0.70 |
| Fiscal Year | 2024 | 2025 |
Income Statement Interpretations
CoreWeave, Inc. Class A Common Stock
CoreWeave’s revenue surged dramatically from $15.8M in 2022 to $1.92B in 2024, reflecting rapid growth. Despite this, the company posted net losses each year, with a net margin of -45.08% in 2024, signaling ongoing profitability challenges. Gross margin remained strong at 74.24%, but high interest expenses and operating costs compressed earnings.
Nutanix, Inc.
Nutanix showed steady revenue growth from $1.39B in 2021 to $2.54B in 2025, with improving profitability. The 2025 net margin was positive at 7.42%, and gross margin was robust at 86.81%. Earnings before interest and taxes (EBIT) turned positive in recent years, reflecting operational improvements and controlled expenses, supporting solid bottom-line growth.
Which one has the stronger fundamentals?
Nutanix exhibits stronger fundamentals with consistent revenue growth, positive net margins, and improved operating profitability. CoreWeave, while showing explosive revenue expansion, continues to face significant losses and high interest expenses impacting net income negatively. Nutanix’s stable margins and positive earnings suggest a more sustainable financial position.
Financial Ratios Comparison
The table below presents the most recent financial ratios for CoreWeave, Inc. Class A Common Stock (CRWV) and Nutanix, Inc. (NTNX), based on fiscal year 2024 and mid-2025 data where available.
| Ratios | CoreWeave, Inc. (CRWV) 2024 | Nutanix, Inc. (NTNX) 2025 |
|---|---|---|
| ROE | 2.09% | -27.12% |
| ROIC | 2.08% | 8.11% |
| P/E | -18.73 | 106.74 |
| P/B | -39.11 | -28.95 |
| Current Ratio | 0.39 | 1.72 |
| Quick Ratio | 0.39 | 1.72 |
| D/E (Debt-to-Equity) | -25.68 | -2.14 |
| Debt-to-Assets | 59.56% | 45.16% |
| Interest Coverage | 0.90 | 8.75 |
| Asset Turnover | 0.11 | 0.77 |
| Fixed Asset Turnover | 0.13 | 9.15 |
| Payout ratio | -6.69% | 0% |
| Dividend yield | 0.36% | 0% |
Interpretation of the Ratios
CoreWeave, Inc. Class A Common Stock
CoreWeave’s ratios show significant weaknesses, including a low current ratio of 0.39 and high debt-to-assets at nearly 60%, signaling liquidity and leverage concerns. Despite a strong return on equity of 208.77%, negative net margin and poor interest coverage highlight profitability and solvency risks. The company does not pay dividends, reflecting its early stage and reinvestment focus.
Nutanix, Inc.
Nutanix presents a mixed picture with favorable liquidity ratios—current and quick ratios at 1.72—and solid interest coverage of 11.15. However, a negative return on equity of -27.12% and high price-to-earnings ratio near 107 raise concerns. The firm does not pay dividends, likely prioritizing growth and R&D expenditure over shareholder payouts.
Which one has the best ratios?
Nutanix holds a more balanced financial profile with half its ratios rated favorable and strong liquidity compared to CoreWeave’s predominantly unfavorable metrics. CoreWeave’s high leverage and weak profitability ratios contrast with Nutanix’s moderate debt levels and positive operational efficiency, indicating Nutanix has the relatively stronger ratios overall.
Strategic Positioning
This section compares the strategic positioning of CoreWeave and Nutanix, including market position, key segments, and exposure to technological disruption:
CoreWeave
- Market position and competitive pressure
- Key segments and business drivers
- Exposure to technological disruption
Nutanix
- Emerging cloud infrastructure provider with high volatility and intense competitive pressure.
- Focused on GPU/CPU compute, AI model training, VFX rendering, and managed cloud services.
- Operates in cutting-edge GenAI infrastructure, reliant on rapid tech advancements.
CoreWeave vs Nutanix Positioning
CoreWeave pursues a concentrated approach in specialized AI and GPU compute infrastructure, while Nutanix maintains a diversified portfolio across enterprise cloud and hybrid services. CoreWeave faces higher volatility, Nutanix benefits from scale and broader industry reach.
Which has the best competitive advantage?
Nutanix exhibits a very favorable moat with growing ROIC and durable profitability, indicating a stronger competitive advantage. CoreWeave shows an unfavorable moat, shedding value despite stable profitability.
Stock Comparison
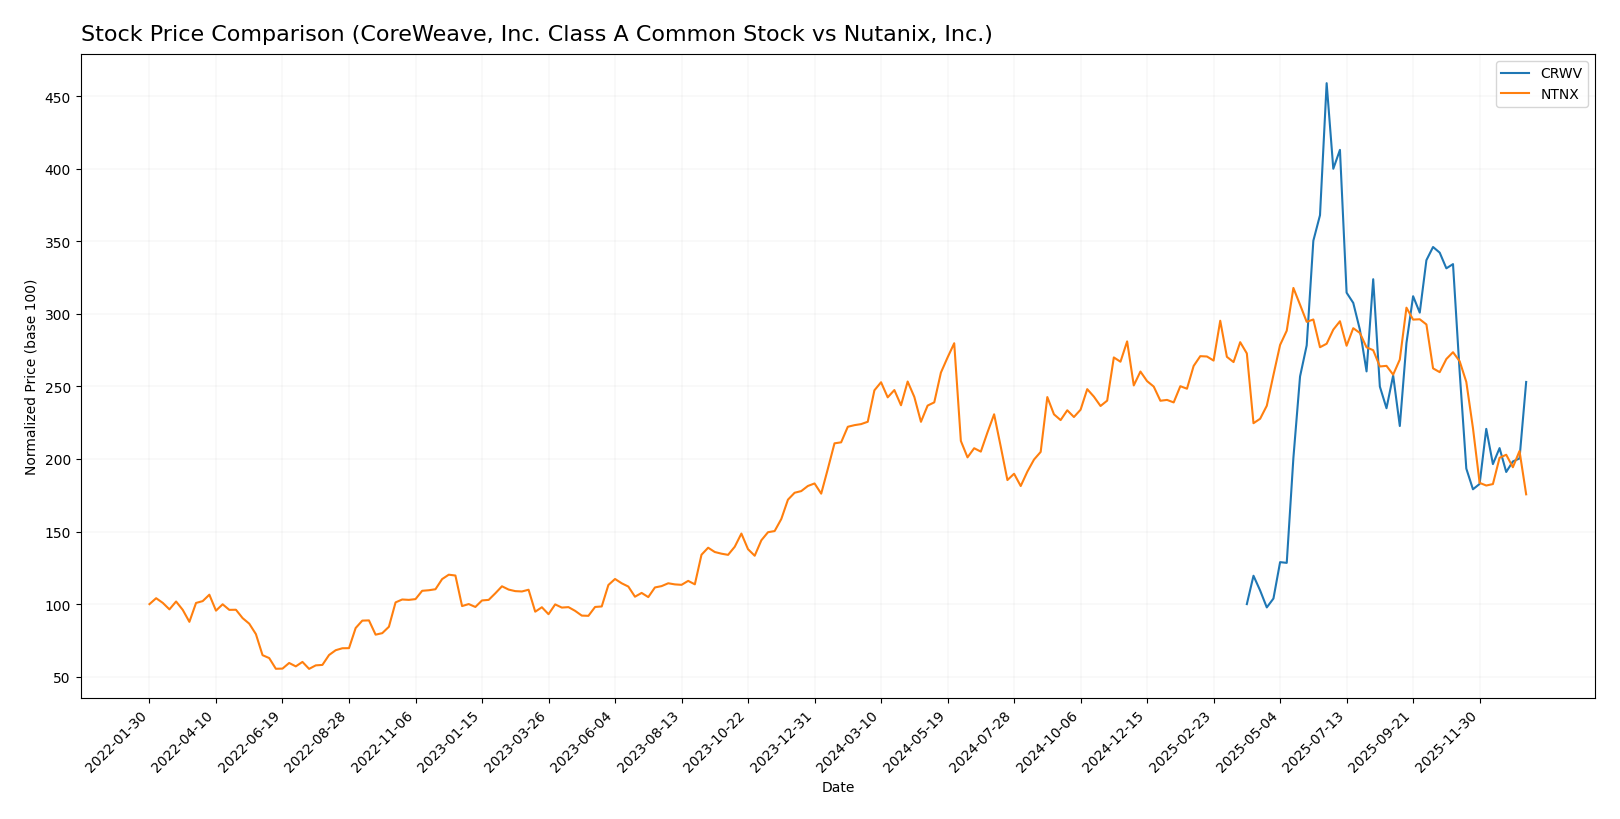
The stock price movements of CoreWeave, Inc. Class A Common Stock (CRWV) and Nutanix, Inc. (NTNX) over the past year reveal contrasting trends, with CRWV showing a strong overall rise despite recent pullbacks, while NTNX experiences a steady decline with increasing seller pressure.
Trend Analysis
CoreWeave, Inc. Class A Common Stock (CRWV) exhibited a bullish trend over the past 12 months with a price increase of 153.08%, although the trend showed deceleration. The stock reached a high of 183.58 and a low of 39.09, with notable volatility (std deviation 35.67). Recent months show a -24.29% decline amid slightly buyer-dominant volume.
Nutanix, Inc. (NTNX) experienced a bearish trend over the same period, with a price decrease of -22.16% and deceleration in the downward movement. The stock fluctuated between 82.77 and 45.74, displaying moderate volatility (std deviation 8.67). Recently, the trend worsened with a -35.79% drop and seller dominance in trading volume.
Comparing the two, CoreWeave delivered the highest market performance with a significant positive price change, contrasting with Nutanix’s sustained negative trend and stronger selling pressure.
Target Prices
Analysts present a clear consensus on target prices for CoreWeave, Inc. and Nutanix, Inc., reflecting their growth potential and market positioning.
| Company | Target High | Target Low | Consensus |
|---|---|---|---|
| CoreWeave, Inc. Class A Common Stock | 175 | 68 | 115.79 |
| Nutanix, Inc. | 90 | 53 | 64.67 |
The consensus target for CoreWeave stands significantly above its current price of $101.23, signaling analyst optimism. Nutanix’s consensus target price at $64.67 also suggests upside potential compared to its current price of $45.74.
Analyst Opinions Comparison
This section compares analysts’ ratings and financial scores for CoreWeave, Inc. Class A Common Stock (CRWV) and Nutanix, Inc. (NTNX):
Rating Comparison
CRWV Rating
- Rating: D+ indicating a very favorable rating.
- Discounted Cash Flow Score: 1, very unfavorable.
- ROE Score: 1, very unfavorable.
- ROA Score: 1, very unfavorable.
- Debt To Equity Score: 1, very unfavorable.
- Overall Score: 1, very unfavorable.
NTNX Rating
- Rating: C+ indicating a very favorable rating.
- Discounted Cash Flow Score: 4, favorable.
- ROE Score: 1, very unfavorable.
- ROA Score: 4, favorable.
- Debt To Equity Score: 1, very unfavorable.
- Overall Score: 2, moderate.
Which one is the best rated?
Based on the data, NTNX holds a higher overall score and a better discounted cash flow and return on assets score than CRWV. Both have very unfavorable debt to equity and ROE scores, but NTNX is overall better rated.
Scores Comparison
Here is a comparison of the Altman Z-Score and Piotroski Score for the two companies:
CRWV Scores
- Altman Z-Score: 0.80, indicating financial distress and high bankruptcy risk.
- Piotroski Score: 3, classified as very weak financial strength.
NTNX Scores
- Altman Z-Score: 1.48, also in financial distress but closer to grey zone.
- Piotroski Score: 6, showing average financial strength.
Which company has the best scores?
Based on the provided data, NTNX has higher scores in both Altman Z-Score and Piotroski Score compared to CRWV. NTNX’s scores suggest relatively better financial stability and strength, although both remain in concerning zones.
Grades Comparison
Here is the comparison of recent grades and ratings for CoreWeave, Inc. Class A Common Stock and Nutanix, Inc.:
CoreWeave, Inc. Class A Common Stock Grades
The following table summarizes the recent grades assigned by leading financial institutions to CoreWeave:
| Grading Company | Action | New Grade | Date |
|---|---|---|---|
| Barclays | Maintain | Equal Weight | 2026-01-12 |
| Wells Fargo | Maintain | Overweight | 2026-01-08 |
| Jefferies | Maintain | Buy | 2026-01-05 |
| DA Davidson | Upgrade | Neutral | 2026-01-05 |
| Goldman Sachs | Maintain | Neutral | 2025-11-17 |
| HC Wainwright & Co. | Maintain | Buy | 2025-11-12 |
| Wells Fargo | Maintain | Overweight | 2025-11-12 |
| Barclays | Maintain | Equal Weight | 2025-11-12 |
| Loop Capital | Maintain | Buy | 2025-11-12 |
| B of A Securities | Maintain | Neutral | 2025-11-11 |
CoreWeave’s grades show a balanced mix of Buy, Overweight, Neutral, and Equal Weight ratings, with most actions maintaining previous grades and one recent upgrade from Underperform to Neutral.
Nutanix, Inc. Grades
The following table lists recent grades assigned by recognized grading companies for Nutanix:
| Grading Company | Action | New Grade | Date |
|---|---|---|---|
| Barclays | Downgrade | Equal Weight | 2026-01-15 |
| Morgan Stanley | Downgrade | Equal Weight | 2026-01-12 |
| RBC Capital | Maintain | Outperform | 2026-01-05 |
| Goldman Sachs | Maintain | Buy | 2025-11-28 |
| JP Morgan | Maintain | Overweight | 2025-11-26 |
| Needham | Maintain | Buy | 2025-11-26 |
| Wells Fargo | Maintain | Equal Weight | 2025-11-26 |
| Morgan Stanley | Maintain | Overweight | 2025-11-26 |
| Keybanc | Maintain | Overweight | 2025-11-26 |
| Piper Sandler | Maintain | Overweight | 2025-11-26 |
Nutanix’s grades generally favor Buy and Overweight ratings, but recent downgrades by Barclays and Morgan Stanley to Equal Weight indicate some cautious sentiment.
Which company has the best grades?
Both CoreWeave and Nutanix hold a “Buy” consensus overall, but CoreWeave’s ratings are more mixed with several Neutral and Equal Weight grades, while Nutanix has a stronger prevalence of Buy and Overweight grades despite recent downgrades. This suggests Nutanix may currently enjoy more consistent positive analyst sentiment, which could influence investor confidence and portfolio decisions.
Strengths and Weaknesses
Below is a comparison of CoreWeave, Inc. (CRWV) and Nutanix, Inc. (NTNX) across key investment criteria, focusing on their strengths and weaknesses based on the most recent data.
| Criterion | CoreWeave, Inc. (CRWV) | Nutanix, Inc. (NTNX) |
|---|---|---|
| Diversification | Limited product/service diversification; mainly focused on niche cloud infrastructure | Well-diversified revenue streams with strong subscription, professional services, and product segments |
| Profitability | Negative net margin (-45.08%), shedding value; unfavorable ROIC vs WACC | Positive net margin (7.42%), creating value; ROIC comfortably above WACC with growing trend |
| Innovation | Emerging player with potential but currently lacks strong innovation moat | Consistent innovation supported by growing ROIC and favorable financial ratios |
| Global presence | Smaller scale, limited global footprint | Established international presence with diversified market reach |
| Market Share | Niche market with limited scale | Larger market share with strong position in cloud software and services |
Key takeaways: Nutanix demonstrates a durable competitive advantage with diversified revenues and improving profitability. CoreWeave shows potential but currently struggles with profitability and scale, representing higher investment risk.
Risk Analysis
Below is a comparative table summarizing key risks for CoreWeave, Inc. (CRWV) and Nutanix, Inc. (NTNX) based on the most recent data from 2025-2026.
| Metric | CoreWeave, Inc. (CRWV) | Nutanix, Inc. (NTNX) |
|---|---|---|
| Market Risk | Extremely high beta (21.65), indicating very high volatility and sensitivity to market swings. | Low beta (0.49), indicating lower volatility relative to the market. |
| Debt level | High debt-to-assets ratio at 59.56%, unfavorable interest coverage (-1.06), signaling financial strain. | Moderate debt-to-assets at 45.16%, favorable interest coverage at 11.15, indicating manageable debt. |
| Regulatory Risk | Standard tech sector regulatory environment; no recent significant regulatory issues reported. | Similar regulatory environment; no major regulatory challenges reported recently. |
| Operational Risk | Low current and quick ratios (~0.39) suggest liquidity issues and potential operational stress. | Healthy current and quick ratios (~1.72), indicating stable operational liquidity. |
| Environmental Risk | No specific environmental risk reported; typical for software infrastructure sector. | No significant environmental risks noted; sector generally low impact. |
| Geopolitical Risk | US-based with some exposure to global supply chains; geopolitical tensions could affect supply costs. | Global presence with diversified markets, somewhat exposed but mitigated by geographic spread. |
In summary, CoreWeave faces the highest risks in market volatility and financial stability, with its extremely high beta and liquidity constraints posing significant threats. Nutanix shows moderate risk levels with better financial health and operational stability, though its high P/E ratio and moderate debt require monitoring. Investors should weigh CoreWeave’s growth potential against its elevated financial risks, while Nutanix offers a more stable but moderately priced option.
Which Stock to Choose?
CoreWeave, Inc. Class A Common Stock (CRWV) shows a favorable income statement with strong revenue growth of 12,000% over 2022-2024, yet it faces unfavorable profitability and liquidity ratios; its ROE is high at 208.8%, but overall financial ratios and MOAT are unfavorable, with value destruction indicated.
Nutanix, Inc. (NTNX) presents a favorable income evolution with consistent revenue and net income growth, positive net margin of 7.42%, and a slightly favorable global ratio profile; its MOAT is very favorable with growing ROIC exceeding WACC, though the rating remains moderate and some profitability ratios are unfavorable.
Investors focused on growth may find CRWV’s rapid revenue expansion appealing despite financial weaknesses and unfavorable MOAT, while those prioritizing durable profitability and competitive advantage might view NTNX’s stable income growth and strong MOAT as more favorable; risk tolerance and strategy will influence the interpretation.
Disclaimer: Investment carries a risk of loss of initial capital. The past performance is not a reliable indicator of future results. Be sure to understand risks before making an investment decision.
Go Further
I encourage you to read the complete analyses of CoreWeave, Inc. Class A Common Stock and Nutanix, Inc. to enhance your investment decisions: