Home > Comparison > Technology > FTNT vs CRWV
The strategic rivalry between Fortinet, Inc. and CoreWeave, Inc. defines the current trajectory of the technology sector’s software infrastructure landscape. Fortinet operates as a capital-intensive cybersecurity giant with broad, integrated solutions, while CoreWeave focuses on high-growth cloud computing for AI workloads. This head-to-head contrasts mature scale with emerging innovation. This analysis will determine which corporate path offers a superior risk-adjusted return for a diversified portfolio in 2026.
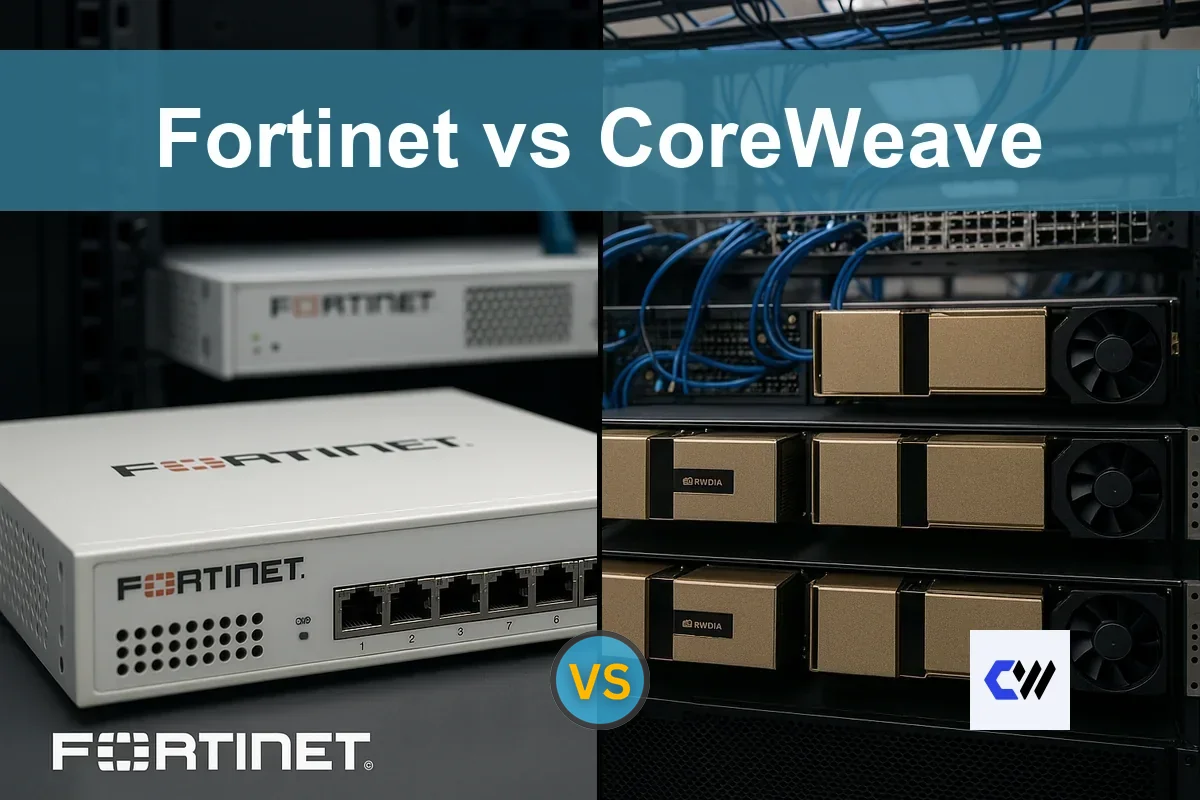
Table of contents
Companies Overview
Fortinet and CoreWeave stand as key players shaping the evolving software infrastructure landscape.
Fortinet, Inc.: Cybersecurity Powerhouse
Fortinet dominates cybersecurity with broad, integrated, and automated solutions. Its core revenue stems from FortiGate hardware and software licenses securing networks worldwide. In 2026, it emphasizes expanding security subscriptions and centralized management to fortify its competitive moat across diverse industries.
CoreWeave, Inc. Class A Common Stock: Cloud Infrastructure Innovator
CoreWeave specializes in cloud platforms that accelerate GenAI workloads. Its revenue engine revolves around GPU and CPU compute, storage, and managed services tailored for AI and rendering tasks. The company’s 2026 strategy focuses on scaling infrastructure and enhancing lifecycle management for enterprise clients.
Strategic Collision: Similarities & Divergences
Fortinet relies on a security-focused, product-integrated ecosystem, while CoreWeave bets on scalable cloud infrastructure for AI workloads. Their battleground centers on infrastructure software but targets different user needs—network security versus high-performance compute. Investors face distinct profiles: Fortinet offers stability with broad enterprise reach; CoreWeave presents growth potential amid volatile AI adoption.
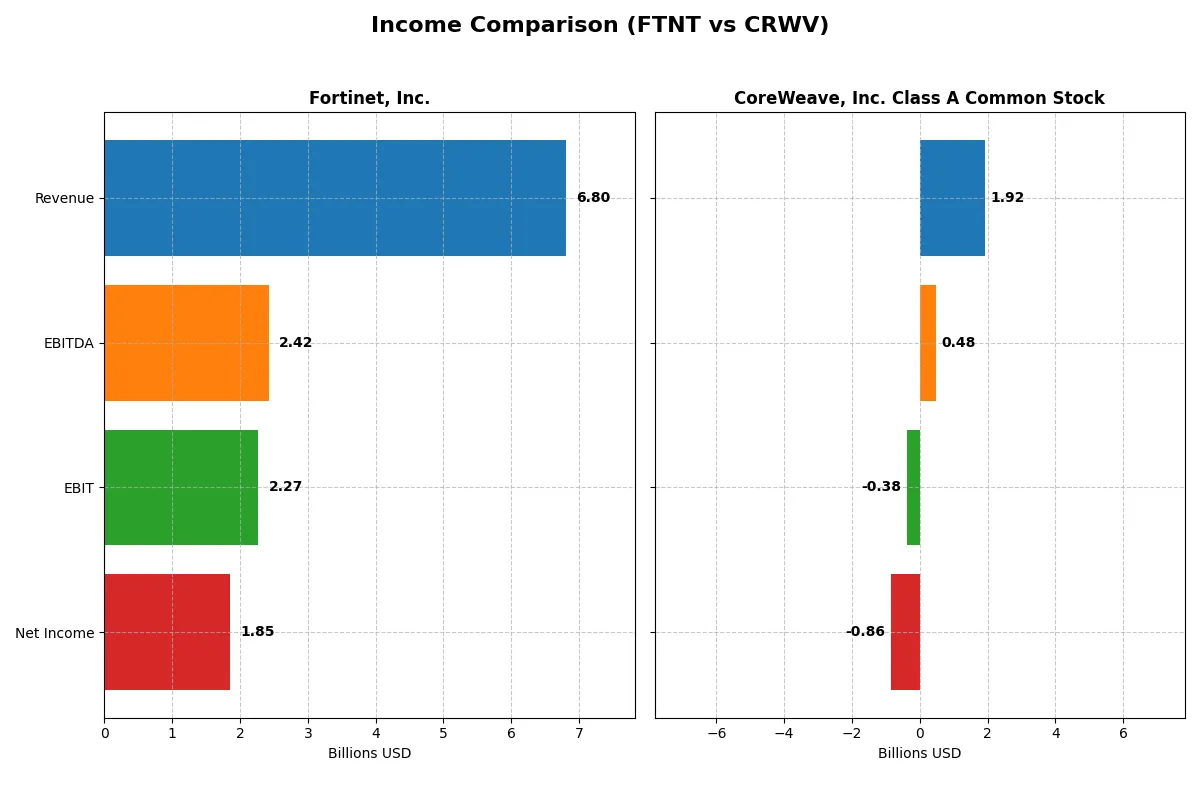
Income Statement Comparison
The following data dissects the core profitability and scalability of both corporate engines to reveal who dominates the bottom line:
| Metric | Fortinet, Inc. (FTNT) | CoreWeave, Inc. Class A Common Stock (CRWV) |
|---|---|---|
| Revenue | 6.8B | 1.9B |
| Cost of Revenue | 1.3B | 493M |
| Operating Expenses | 3.4B | 1.1B |
| Gross Profit | 5.5B | 1.4B |
| EBITDA | 2.4B | 480M |
| EBIT | 2.3B | -383M |
| Interest Expense | 20M | 361M |
| Net Income | 1.9B | -863M |
| EPS | 2.44 | -2.33 |
| Fiscal Year | 2025 | 2024 |
Income Statement Analysis: The Bottom-Line Duel
This income statement comparison reveals how efficiently Fortinet and CoreWeave convert revenue into profit and sustain operational momentum.
Fortinet, Inc. Analysis
Fortinet’s revenue climbed steadily from 3.3B in 2021 to nearly 6.8B in 2025, more than doubling overall. Net income surged from 607M to 1.85B, reflecting a strong margin profile with a 80.8% gross margin and 27.3% net margin in 2025. Operating efficiency improved, sustaining robust EBIT growth despite slight net margin compression last year.
CoreWeave, Inc. Class A Common Stock Analysis
CoreWeave’s revenue exploded from 228M in 2023 to 1.92B in 2024, marking extraordinary top-line growth. However, it reported a net loss of 863M in 2024, though gross margin remained solid at 74.2%. High interest expense (18.8% of revenue) and negative EBIT margin (-20%) highlight ongoing operational and capital structure challenges, despite improving EBIT growth.
Margin Power vs. Revenue Scale
Fortinet demonstrates consistent profitability and margin strength, with sustained net income growth and operational discipline. CoreWeave’s rapid revenue expansion comes at the cost of deep losses and high leverage, weighing on profitability. For investors prioritizing stable earnings and margin quality, Fortinet’s profile appears more attractive and fundamentally sound.
Financial Ratios Comparison
These vital ratios act as a diagnostic tool to expose the underlying fiscal health, valuation premiums, and capital efficiency of each company:
| Ratios | Fortinet, Inc. (FTNT) | CoreWeave, Inc. Class A Common Stock (CRWV) |
|---|---|---|
| ROE | 1.50 | 2.09 |
| ROIC | 0.29 | 0.02 |
| P/E | 32.5 | -18.7 |
| P/B | 48.6 | -39.1 |
| Current Ratio | 1.17 | 0.39 |
| Quick Ratio | 1.09 | 0.39 |
| D/E | 0.81 | -25.7 |
| Debt-to-Assets | 0.096 | 0.60 |
| Interest Coverage | 104 | 0.90 |
| Asset Turnover | 0.65 | 0.11 |
| Fixed Asset Turnover | 4.20 | 0.13 |
| Payout ratio | 0 | -0.067 |
| Dividend yield | 0 | 0.36% |
| Fiscal Year | 2025 | 2024 |
Efficiency & Valuation Duel: The Vital Signs
Ratios act as a company’s DNA, uncovering hidden risks and revealing operational excellence that raw numbers alone cannot show.
Fortinet, Inc.
Fortinet posts a stellar 150% ROE and strong 27% net margin, signaling robust profitability. However, its 32.5 P/E and 48.6 P/B ratios suggest the stock trades at a premium. The company reinvests heavily in R&D (12% of revenue), favoring growth over dividends, which aligns with its high ROIC of 29%.
CoreWeave, Inc. Class A Common Stock
CoreWeave shows mixed signals: an impressive 209% ROE contrasts with a deeply negative net margin of -45%, reflecting operational struggles. Its negative P/E and P/B ratios, alongside high leverage (60% debt-to-assets), paint a stretched financial profile. The company neither pays dividends nor invests in R&D, indicating a high-risk growth phase.
Premium Profitability vs. Stretched Growth Risks
Fortinet offers a balanced risk-reward profile with strong profitability and prudent reinvestment, despite a premium valuation. CoreWeave’s volatile metrics and financial stress mark it as a high-risk, speculative stock. Investors seeking stability will lean toward Fortinet’s proven operational efficiency.
Which one offers the Superior Shareholder Reward?
Fortinet, Inc. (FTNT) foregoes dividends but sustains returns through robust free cash flow (2.9B) and strategic buybacks, underpinning its 27% net margin. CoreWeave, Inc. Class A (CRWV) pays a modest 0.36% dividend but struggles with negative free cash flow (-14.7B) and high debt (60% assets). I see Fortinet’s buyback-driven model as more sustainable and superior for total shareholder return in 2026.
Comparative Score Analysis: The Strategic Profile
The radar chart reveals the fundamental DNA and trade-offs of Fortinet, Inc. and CoreWeave, Inc. Class A Common Stock:
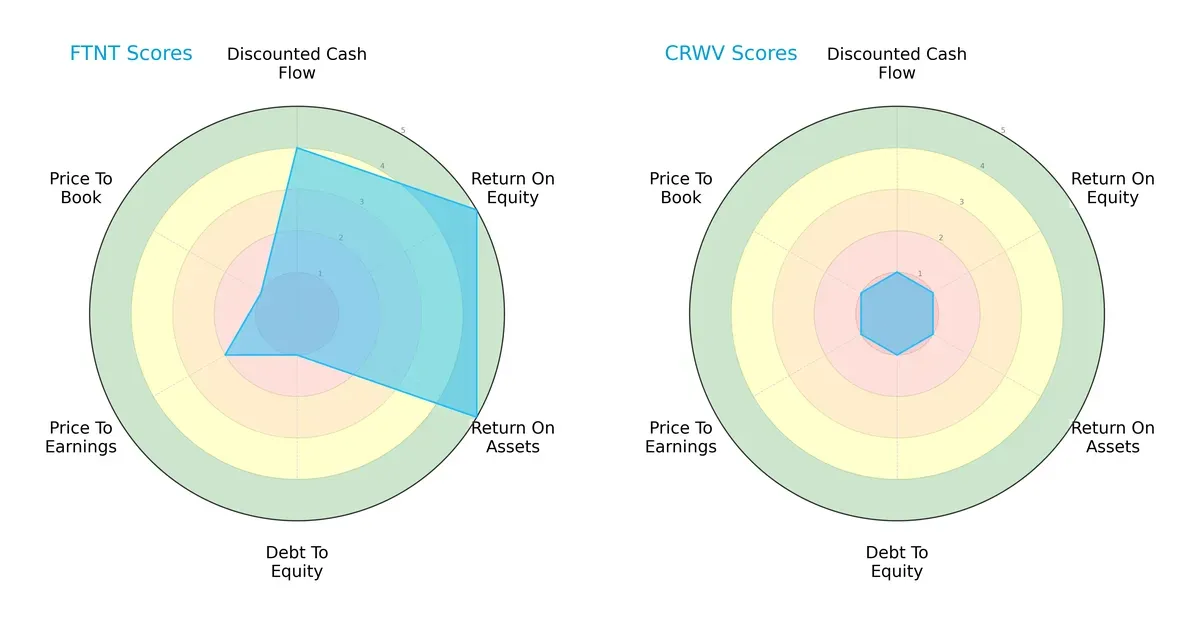
Fortinet dominates with strong ROE (5) and ROA (5) scores, showcasing efficient profitability and asset use. However, it carries a heavy debt burden (Debt/Equity score 1) and shows valuation weaknesses (P/E 2, P/B 1). CoreWeave lags across all metrics, scoring 1 in every category, reflecting a highly unbalanced and weak financial profile. Fortinet presents a more balanced, though leveraged, investment proposition, while CoreWeave depends on limited strengths.
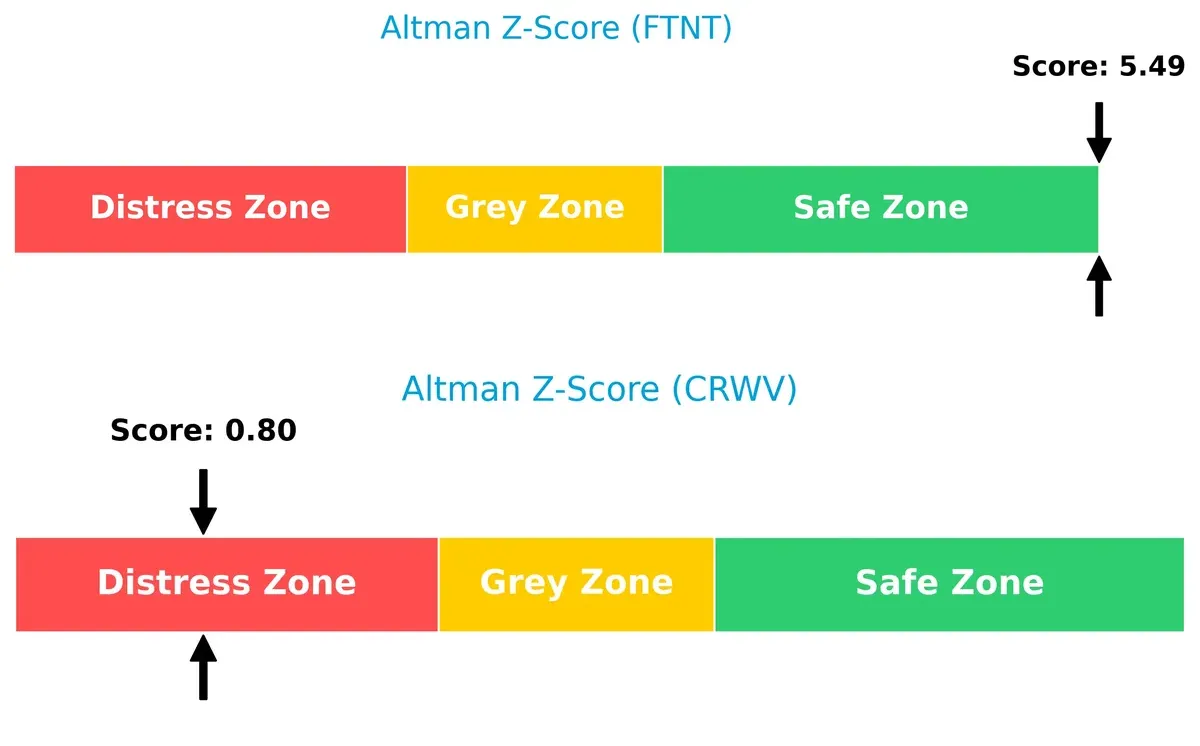
Bankruptcy Risk: Solvency Showdown
Fortinet’s Altman Z-Score of 5.49 places it well within the safe zone, signaling robust solvency and low bankruptcy risk. CoreWeave’s score of 0.80 warns of severe financial distress and high default risk in this cycle:
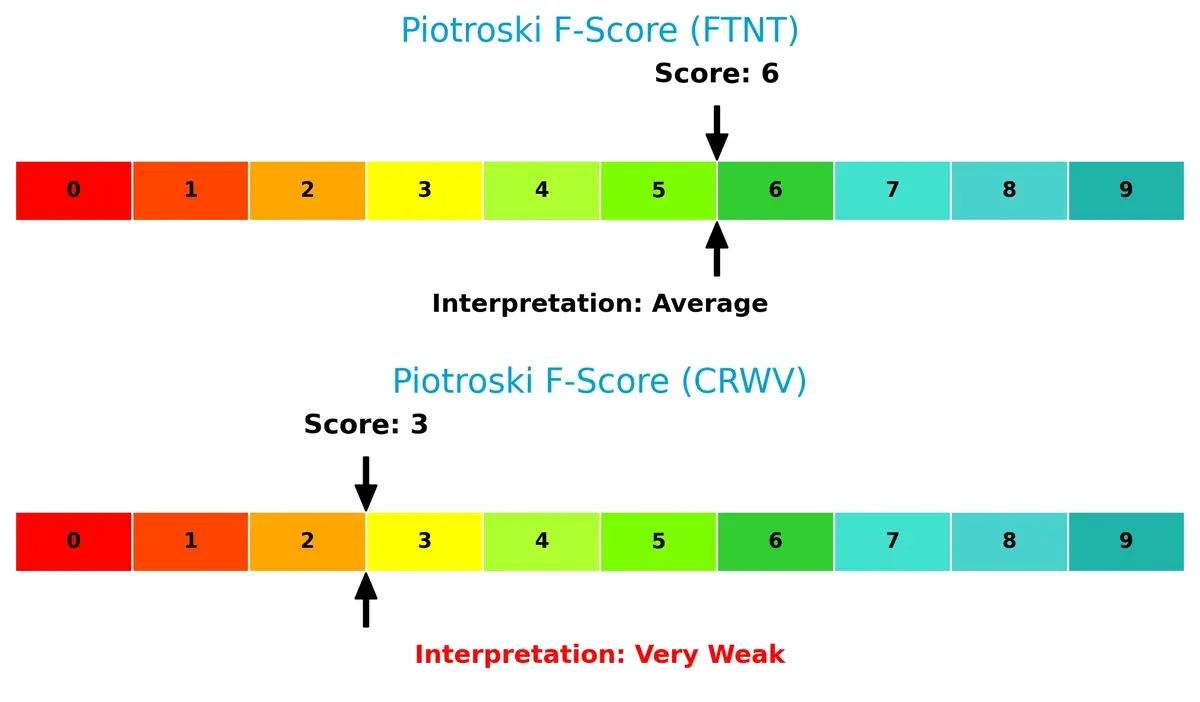
Financial Health: Quality of Operations
Fortinet’s Piotroski F-Score of 6 indicates solid, stable financial operations with manageable internal risks. CoreWeave scores a weak 3, flagging significant operational and financial red flags relative to Fortinet:
How are the two companies positioned?
This section dissects the operational DNA of Fortinet and CoreWeave by comparing their revenue distribution and internal dynamics. The goal is to confront their economic moats and identify which business model offers the most resilient competitive advantage today.
Revenue Segmentation: The Strategic Mix
This visual comparison dissects how Fortinet, Inc. and CoreWeave, Inc. diversify their income streams and where their primary sector bets lie:
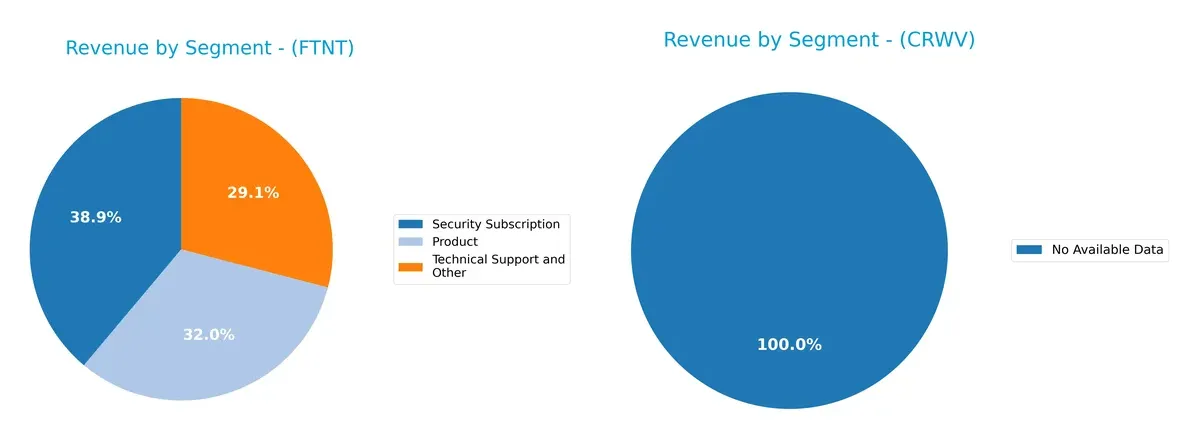
Fortinet displays a balanced revenue mix with $2.3B in Security Subscriptions anchoring growth, complemented by $1.9B in Product sales and $1.7B in Technical Support. This diversification strengthens its ecosystem lock-in and reduces concentration risk. CoreWeave lacks available segmentation data, preventing a direct comparison, but Fortinet’s multi-segment approach clearly dominates with infrastructure and subscription synergy.
Strengths and Weaknesses Comparison
This table compares the Strengths and Weaknesses of Fortinet, Inc. and CoreWeave, Inc. Class A Common Stock:
Fortinet Strengths
- Strong profitability with 27.26% net margin
- High ROE at 149.77%
- Favorable ROIC at 28.76%
- Low debt-to-assets ratio of 9.59%
- Solid quick ratio at 1.09
- Diversified product and geographic revenue streams
CoreWeave Strengths
- High ROE at 208.77%
- Favorable P/E and P/B ratios despite losses
- Low debt-to-equity ratio (negative value indicating unique capital structure)
Fortinet Weaknesses
- Unfavorable P/E at 32.48 and P/B at 48.64 indicating high valuation
- No dividend yield
- Moderate current ratio at 1.17
- Neutral WACC at 8.62%
- Asset turnover moderate at 0.65
CoreWeave Weaknesses
- Negative net margin (-45.08%) indicating losses
- Very high WACC at 82.83%
- Poor current and quick ratios at 0.39 each
- High debt-to-assets ratio at 59.56%
- Negative interest coverage (-1.06)
- Low asset turnover (0.11) and fixed asset turnover (0.13)
- Dividend yield low at 0.36%
Fortinet demonstrates strong profitability and financial stability with diversified revenue, though it trades at high valuation multiples. CoreWeave shows exceptional ROE but suffers from poor liquidity, high debt levels, and consistent losses, highlighting financial risk in its current state.
The Moat Duel: Analyzing Competitive Defensibility
A structural moat is the only reliable shield protecting long-term profits from relentless competition erosion:
Fortinet, Inc.: Switching Costs and Integrated Security Ecosystem
Fortinet’s moat stems from high switching costs and a comprehensive cybersecurity platform. It sustains an 80.8% gross margin and 33.4% EBIT margin. Growing ROIC outpaces WACC by 20%, signaling durable value creation. Expansion into AI-driven security in 2026 should deepen this advantage.
CoreWeave, Inc. Class A Common Stock: Emerging Scalability in Cloud Compute
CoreWeave relies on specialized GPU cloud infrastructure for GenAI workloads, a nascent yet volatile moat. Despite explosive 736% revenue growth, it posts negative EBIT and ROIC well below WACC, indicating value destruction. Scaling compute capacity and diversifying services remain key future tests.
Defensive Moats: Switching Costs vs. Emerging Cloud Scalability
Fortinet’s proven, widening moat built on switching costs and margin stability outclasses CoreWeave’s unproven scalability play. Fortinet is better positioned to defend market share and sustain profits amid intensifying competition in 2026.
Which stock offers better returns?
The past year reveals stark contrasts in price gains and trading dynamics between Fortinet, Inc. and CoreWeave, Inc., highlighting diverging momentum and volume trends.
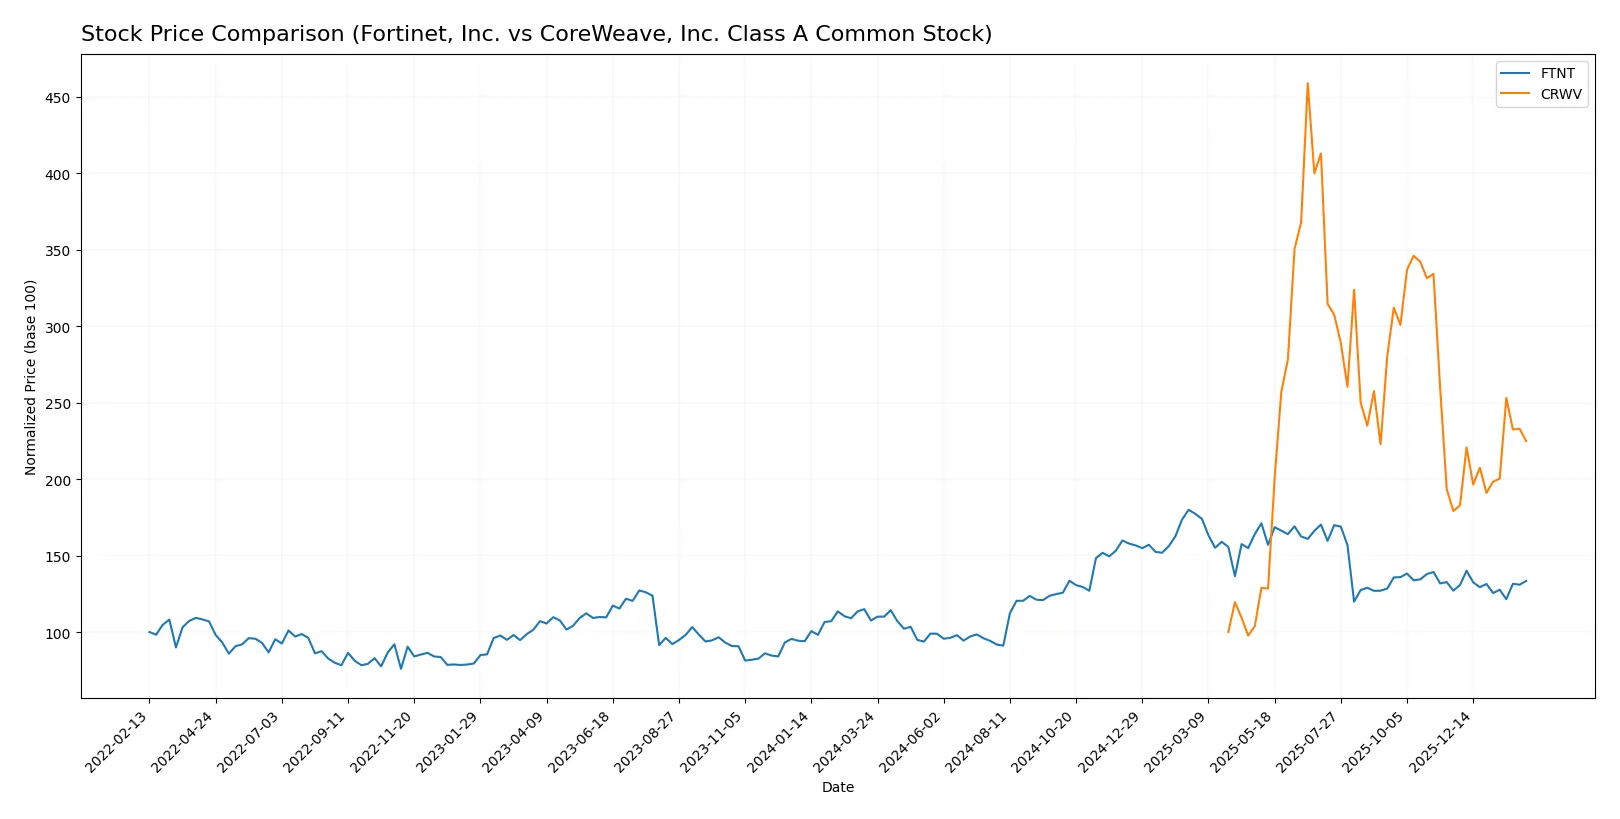
Trend Comparison
Fortinet’s stock rose 24.04% over the past 12 months, indicating a bullish but decelerating trend with a high volatility of 15.07%. The price ranged between 56.51 and 111.64.
CoreWeave’s stock surged 124.88% over the same period, reflecting a strong bullish trend with accelerating momentum and higher volatility at 34.56%. Prices fluctuated from 39.09 to 183.58.
CoreWeave outperformed Fortinet with a significantly higher return and accelerating momentum. Its bullish trend contrasts with Fortinet’s decelerating trajectory.
Target Prices
The current analyst consensus reveals a bullish outlook for both Fortinet, Inc. and CoreWeave, Inc. Class A Common Stock.
| Company | Target Low | Target High | Consensus |
|---|---|---|---|
| Fortinet, Inc. | 70 | 90 | 85 |
| CoreWeave, Inc. Class A | 84 | 175 | 121 |
Analysts expect Fortinet’s shares to appreciate modestly above the current $82.76 price, while CoreWeave shows a wider target range, signaling higher volatility and growth potential versus its $89.95 market price.

Don’t Let Luck Decide Your Entry Point
Optimize your entry points with our advanced ProRealTime indicators. You’ll get efficient buy signals with precise price targets for maximum performance. Start outperforming now!
How do institutions grade them?
This section summarizes recent institutional grades for Fortinet, Inc. and CoreWeave, Inc. Class A Common Stock:
Fortinet, Inc. Grades
The following table presents Fortinet’s grades from key financial institutions in early 2026.
| Grading Company | Action | New Grade | Date |
|---|---|---|---|
| Rosenblatt | Maintain | Buy | 2026-02-06 |
| Mizuho | Maintain | Underperform | 2026-02-06 |
| JP Morgan | Maintain | Underweight | 2026-02-06 |
| RBC Capital | Maintain | Sector Perform | 2026-02-06 |
| Wedbush | Maintain | Outperform | 2026-02-06 |
| Scotiabank | Downgrade | Sector Perform | 2026-02-02 |
| JP Morgan | Maintain | Underweight | 2026-01-30 |
| Rosenblatt | Upgrade | Buy | 2026-01-29 |
| TD Cowen | Upgrade | Buy | 2026-01-23 |
| Citigroup | Maintain | Neutral | 2026-01-13 |
CoreWeave, Inc. Class A Common Stock Grades
Below are CoreWeave’s institutional grades from late 2025 to early 2026.
| Grading Company | Action | New Grade | Date |
|---|---|---|---|
| Macquarie | Maintain | Neutral | 2026-01-27 |
| Deutsche Bank | Upgrade | Buy | 2026-01-27 |
| Mizuho | Maintain | Neutral | 2026-01-27 |
| DA Davidson | Upgrade | Buy | 2026-01-26 |
| Needham | Maintain | Hold | 2026-01-26 |
| Barclays | Maintain | Equal Weight | 2026-01-12 |
| Wells Fargo | Maintain | Overweight | 2026-01-08 |
| DA Davidson | Upgrade | Neutral | 2026-01-05 |
| Jefferies | Maintain | Buy | 2026-01-05 |
| Goldman Sachs | Maintain | Neutral | 2025-11-17 |
Which company has the best grades?
Fortinet shows a mixed profile with several Buy and Outperform grades but also multiple Underperform and Underweight ratings. CoreWeave displays a steady trend of Neutral to Buy grades, with fewer negative outlooks. This divergence may influence investor sentiment differently, reflecting varied confidence levels across analysts.
Risks specific to each company
The following categories identify critical pressure points and systemic threats facing both firms in the 2026 market environment:
1. Market & Competition
Fortinet, Inc.
- Established cybersecurity leader with broad integrated solutions; faces intense competition from large incumbents and emerging tech firms.
CoreWeave, Inc. Class A Common Stock
- New cloud infrastructure player focused on GenAI acceleration; competes in a highly volatile, rapidly evolving market with numerous startups and tech giants.
2. Capital Structure & Debt
Fortinet, Inc.
- Moderate debt-to-equity ratio (0.81) with strong interest coverage (113x) signals prudent leverage management.
CoreWeave, Inc. Class A Common Stock
- High debt-to-assets (59.56%) and negative interest coverage indicate significant financial stress and weak capital structure.
3. Stock Volatility
Fortinet, Inc.
- Beta near market average (1.05) suggests typical volatility aligned with tech sector norms.
CoreWeave, Inc. Class A Common Stock
- Extremely high beta (21.65) reflects intense stock price swings and speculative trading risk.
4. Regulatory & Legal
Fortinet, Inc.
- Operates globally with exposure to cybersecurity regulations and data privacy laws; well established compliance protocols.
CoreWeave, Inc. Class A Common Stock
- Emerging firm still navigating complex cloud service regulations and potential AI governance challenges.
5. Supply Chain & Operations
Fortinet, Inc.
- Diverse hardware and software supply chain with established partners; resilient but exposed to global chip shortages.
CoreWeave, Inc. Class A Common Stock
- Relies heavily on cutting-edge GPU and specialized hardware; supply disruptions could impair service delivery.
6. ESG & Climate Transition
Fortinet, Inc.
- Increasing focus on sustainable cybersecurity solutions; moderate ESG reporting maturity.
CoreWeave, Inc. Class A Common Stock
- Early-stage ESG initiatives; faces scrutiny over energy-intensive cloud infrastructure carbon footprint.
7. Geopolitical Exposure
Fortinet, Inc.
- Global footprint exposes it to U.S.-China tensions and international trade restrictions in cybersecurity.
CoreWeave, Inc. Class A Common Stock
- Primarily U.S.-based but vulnerable to geopolitical risks impacting cloud hardware supply and AI export controls.
Which company shows a better risk-adjusted profile?
Fortinet’s most impactful risk lies in intense competition and regulatory complexity, mitigated by solid capital structure and stable earnings. CoreWeave faces acute financial distress risk, highlighted by its poor debt metrics and extreme stock volatility. Fortinet shows a clearly superior risk-adjusted profile, underscored by a strong Altman Z-score of 5.5 versus CoreWeave’s 0.8 distress zone. The contrast in financial health and market stability justifies heightened caution on CoreWeave despite its growth potential.
Final Verdict: Which stock to choose?
Fortinet’s superpower lies in its robust economic moat and remarkable capital efficiency. It consistently generates strong returns well above its cost of capital, signaling a sustainable competitive advantage. A point of vigilance is its relatively high valuation multiples, which could pressure returns if growth slows. Fortinet suits investors targeting aggressive growth with a focus on quality and profitability.
CoreWeave impresses with explosive revenue growth and potential in a niche cloud computing market. Its moat is less proven, and the company currently struggles with cash flow and balance sheet stability, reflecting a riskier profile than Fortinet. CoreWeave fits growth-at-a-reasonable-price (GARP) investors willing to tolerate volatility for outsized upside.
If you prioritize durable profitability and capital discipline, Fortinet outshines CoreWeave with better stability and value creation. However, if you seek high-growth potential and can absorb financial risk, CoreWeave offers a compelling, though speculative, growth trajectory. Each stock appeals to distinct investor profiles balancing opportunity and risk.
Disclaimer: Investment carries a risk of loss of initial capital. The past performance is not a reliable indicator of future results. Be sure to understand risks before making an investment decision.
Go Further
I encourage you to read the complete analyses of Fortinet, Inc. and CoreWeave, Inc. Class A Common Stock to enhance your investment decisions: