Home > Comparison > Technology > CRWV vs FFIV
The strategic rivalry between CoreWeave, Inc. and F5, Inc. defines the evolving landscape of technology infrastructure solutions. CoreWeave operates a cutting-edge cloud platform focused on GenAI compute workloads, while F5 delivers mature multi-cloud application security and delivery systems. This analysis pits CoreWeave’s high-growth innovation against F5’s established enterprise footprint to assess which offers a superior risk-adjusted return for a diversified portfolio navigating technological transformation.

Table of contents
Companies Overview
CoreWeave and F5 stand as pivotal players in the software infrastructure market, each commanding significant influence.
CoreWeave, Inc. Class A Common Stock: Cloud Platform Pioneer
CoreWeave operates a cloud platform that fuels scaling and acceleration for GenAI workloads. Its revenue derives from GPU and CPU compute, storage, networking, and managed services. In 2025, CoreWeave focused strategically on expanding infrastructure capabilities for AI model training and mission control, underpinning its growth in high-demand compute services.
F5, Inc.: Multi-Cloud Security and Delivery Leader
F5 specializes in multi-cloud application security and delivery, offering products like BIG-IP appliances and software solutions across diverse environments. Its revenue engines include advanced firewalls, application security, and professional services. In 2025, F5 prioritized strengthening cloud partnerships and expanding security offerings to support hybrid and public cloud deployments worldwide.
Strategic Collision: Similarities & Divergences
Both firms excel in software infrastructure but diverge in approach: CoreWeave builds scalable compute infrastructure, while F5 focuses on securing and optimizing application delivery. Their competition centers on serving enterprise cloud needs—compute versus security layers. Investors will note CoreWeave’s growth potential in AI infrastructure contrasts with F5’s established footprint in multi-cloud security solutions.
Income Statement Comparison
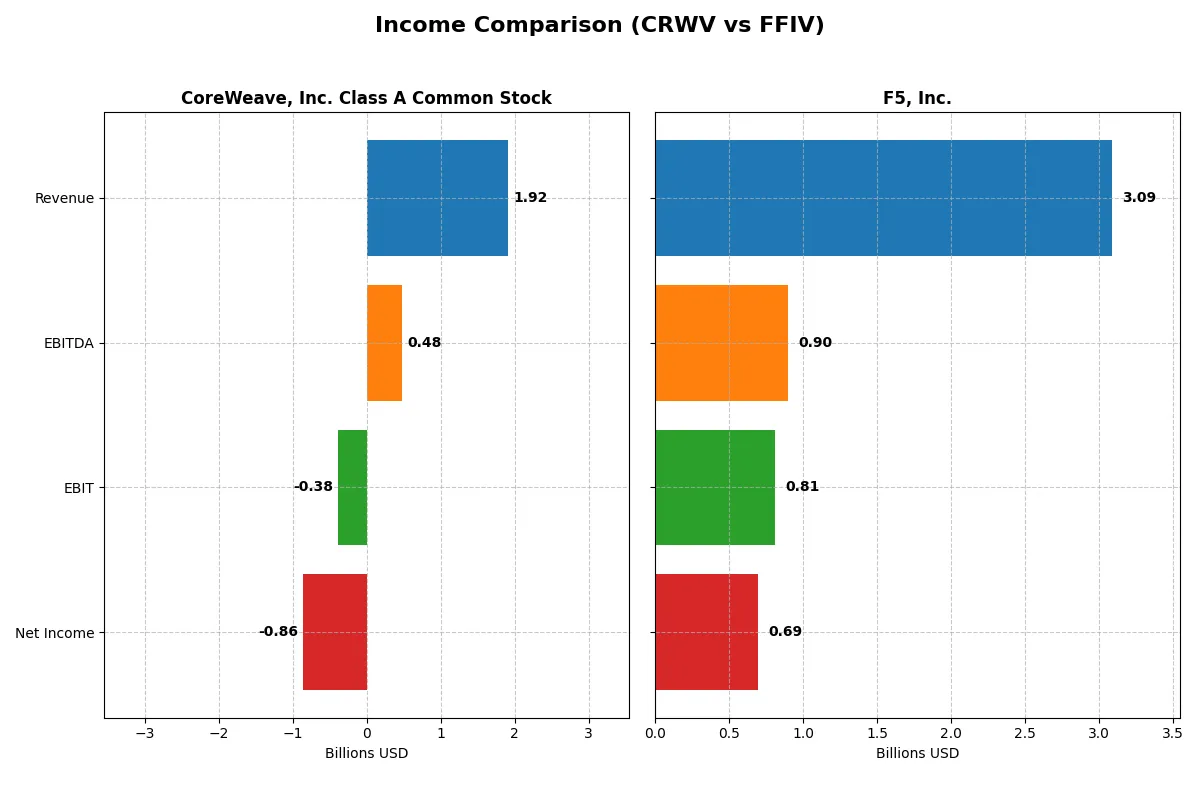
This data dissects the core profitability and scalability of both corporate engines to reveal who dominates the bottom line:
| Metric | CoreWeave (CRWV) | F5, Inc. (FFIV) |
|---|---|---|
| Revenue | 1.92B | 3.09B |
| Cost of Revenue | 493M | 564M |
| Operating Expenses | 1.10B | 1.76B |
| Gross Profit | 1.42B | 2.52B |
| EBITDA | 480M | 901M |
| EBIT | -383M | 808M |
| Interest Expense | 361M | 0 |
| Net Income | -863M | 692M |
| EPS | -2.33 | 11.95 |
| Fiscal Year | 2024 | 2025 |
Income Statement Analysis: The Bottom-Line Duel
This income statement comparison reveals which company runs a more efficient and profitable business engine amid their growth paths.
CoreWeave, Inc. Class A Common Stock Analysis
CoreWeave surged its revenue from $15.8M in 2022 to $1.9B in 2024, showcasing explosive top-line growth. However, it struggles with a negative net margin of -45.08%, despite a strong gross margin of 74.24%. In 2024, CoreWeave’s net loss widened to $937M, reflecting high interest expenses and heavy non-operating costs dampening profitability.
F5, Inc. Analysis
F5 steadily grew revenue from $2.6B in 2021 to $3.1B in 2025, maintaining robust profitability. Its gross margin stands at a healthy 81.74%, while net margin reached 22.42% in 2025. F5 delivered consistent net income expansion, reporting $692M in net profit in 2025, driven by strong operating leverage and zero interest expense, highlighting operational efficiency.
Profitability Momentum vs. Rapid Growth Struggles
F5 leads clearly with consistent profitability and margin strength, outperforming CoreWeave’s rapid revenue ramp but sustained losses. CoreWeave impresses with explosive growth but remains burdened by heavy interest costs and negative net income. For investors, F5’s stable profit profile offers a more reliable income stream compared to CoreWeave’s high-risk growth trajectory.
Financial Ratios Comparison
These vital ratios act as a diagnostic tool to expose the underlying fiscal health, valuation premiums, and capital efficiency of the companies compared below:
| Ratios | CoreWeave (CRWV) | F5 (FFIV) |
|---|---|---|
| ROE | 2.09% | 19.28% |
| ROIC | 2.08% | 13.91% |
| P/E | -18.7 | 26.91 |
| P/B | -39.11 | 5.19 |
| Current Ratio | 0.39 | 1.56 |
| Quick Ratio | 0.39 | 1.51 |
| D/E | -25.68 | 0.06 |
| Debt-to-Assets | 59.56% | 3.65% |
| Interest Coverage | 0.90 | 0 |
| Asset Turnover | 0.11 | 0.49 |
| Fixed Asset Turnover | 0.13 | 9.02 |
| Payout ratio | -6.69% | 0% |
| Dividend yield | 0.36% | 0% |
| Fiscal Year | 2024 | 2025 |
Efficiency & Valuation Duel: The Vital Signs
Financial ratios serve as a company’s DNA, uncovering hidden risks and operational strengths essential for informed investment decisions.
CoreWeave, Inc. Class A Common Stock
CoreWeave posts a low ROE of 2.1%, signaling weak profitability despite a favorable P/E and P/B ratio. Its margins are deeply negative, reflecting operational challenges. The stock appears stretched with a current ratio at 0.39, indicating liquidity concerns. CoreWeave offers a modest dividend yield of 0.36%, but reinvestment is limited, lacking R&D spending.
F5, Inc.
F5 delivers a strong 19.3% ROE and a robust 22.4% net margin, showcasing operational efficiency. Valuation metrics like a P/E of 26.9 appear expensive relative to peers. The company maintains solid liquidity with a 1.56 current ratio and no dividend payout, opting instead to fuel growth through consistent R&D investment.
Premium Valuation vs. Operational Safety
F5 balances profitability and liquidity better than CoreWeave, which struggles with negative margins and liquidity risks. F5’s premium valuation reflects higher operational safety and growth focus. Investors favoring steady returns and resilience may prefer F5’s profile, while CoreWeave’s riskier stance suits those seeking speculative opportunities.
Which one offers the Superior Shareholder Reward?
CoreWeave (CRWV) pays a minimal dividend yield of 0.36% in 2024 but suffers negative free cash flow (-$14.7/share) and weak operating margins, signaling an unsustainable payout and no buybacks. F5 (FFIV) does not pay dividends but generates strong free cash flow ($15.7/share) with robust margins and invests heavily in buybacks. Historically, F5’s capital allocation emphasizes shareholder value via buybacks, while CoreWeave’s losses and weak liquidity pose high risks. I find F5 offers a far superior total return profile in 2026, balancing sustainable cash flow and disciplined repurchases over CoreWeave’s speculative payout.
Comparative Score Analysis: The Strategic Profile
The radar chart reveals the fundamental DNA and trade-offs of CoreWeave, Inc. Class A Common Stock and F5, Inc., highlighting their financial strengths and weaknesses:
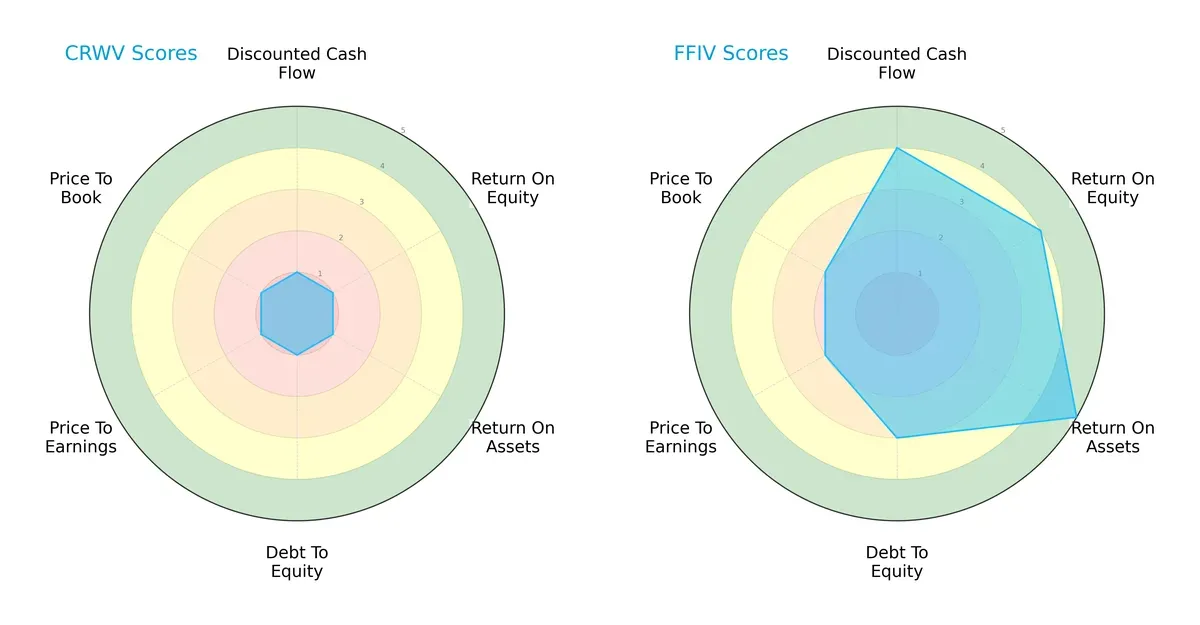
F5 dominates across all key metrics with a favorable overall score of 4 versus CoreWeave’s very unfavorable 1. F5 excels in ROA (5) and ROE (4), showing superior asset and equity efficiency. CoreWeave scores uniformly 1 across DCF, leverage, and valuation metrics, signaling severe financial imbalances. F5 presents a more balanced profile, while CoreWeave relies on no clear edge and faces significant valuation and solvency risks.
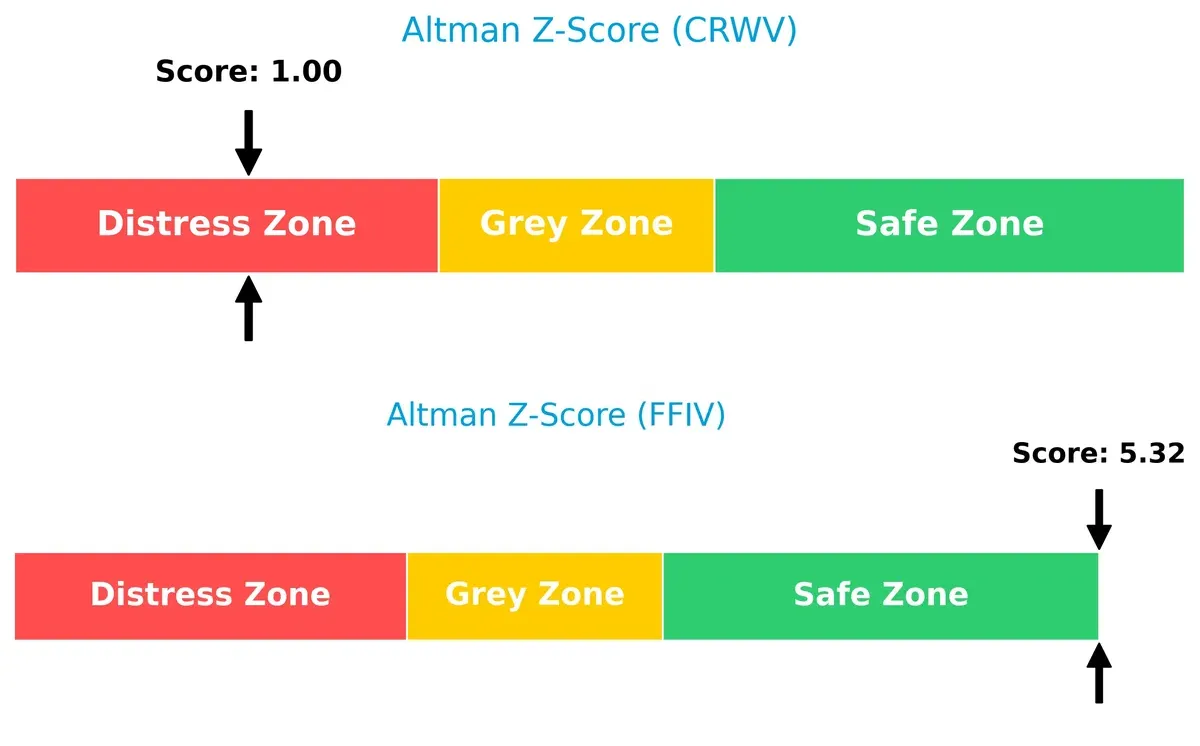
Bankruptcy Risk: Solvency Showdown
F5’s Altman Z-Score of 5.32 places it solidly in the safe zone, whereas CoreWeave’s 1.00 signals distress. This gap warns that CoreWeave struggles to survive adverse market conditions, unlike F5:
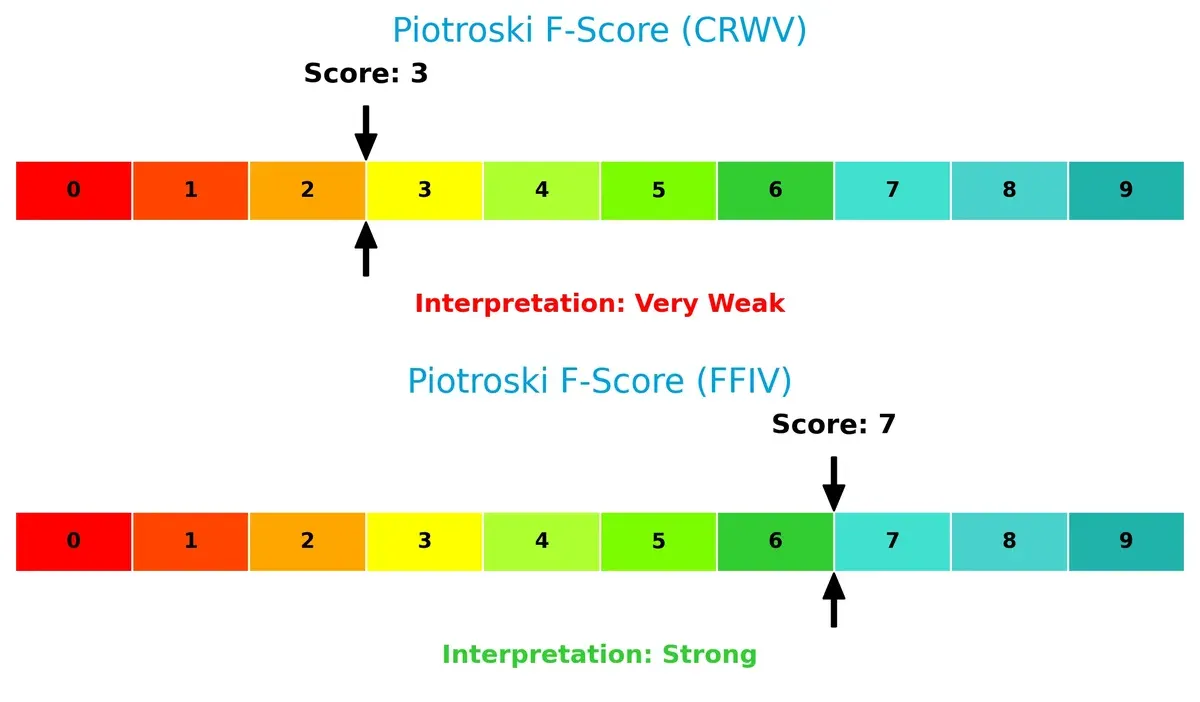
Financial Health: Quality of Operations
F5’s Piotroski F-Score of 7 indicates strong financial health and operational quality. CoreWeave’s score of 3 raises red flags about its internal metrics and financial robustness:
How are the two companies positioned?
This section dissects the operational DNA of CoreWeave and F5 by comparing their revenue distribution by segment and internal dynamics, including strengths and weaknesses. The final objective confronts their economic moats to identify which business model offers the most resilient and sustainable competitive advantage today.
Revenue Segmentation: The Strategic Mix
This visual comparison dissects how CoreWeave and F5 diversify their income streams and where their primary sector bets lie:
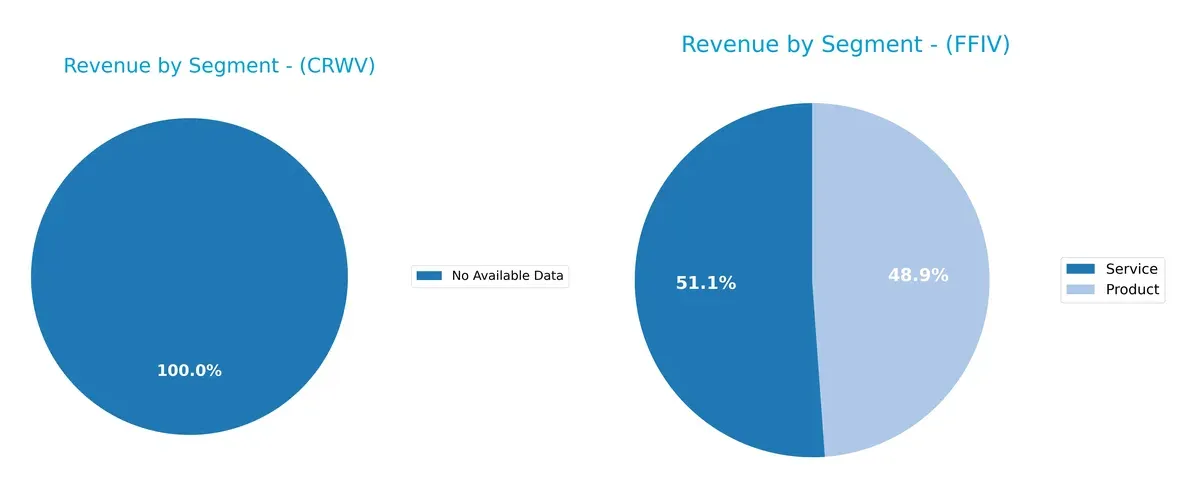
CoreWeave lacks segment data, preventing analysis. F5 shows a balanced revenue split, with $1.51B from Products and $1.58B from Services in 2025. This mix reduces concentration risk and signals dual strength in infrastructure and recurring services. F5 pivots between tangible product sales and service contracts, anchoring its ecosystem lock-in and smoothing cyclicality. In contrast, CoreWeave’s unseen segmentation poses an unknown strategic risk.
Strengths and Weaknesses Comparison
This table compares the strengths and weaknesses of CoreWeave (CRWV) and F5 (FFIV) based on key financial and strategic criteria:
CoreWeave Strengths
- High ROE at 208.77% indicating strong equity returns
- Favorable PE and PB ratios suggest market confidence
- Low debt-to-equity ratio signals conservative leverage
F5 Strengths
- Positive net margin of 22.42% shows profitability
- Favorable ROIC at 13.99% exceeds cost of capital
- Strong current and quick ratios indicate liquidity
- Robust fixed asset turnover at 9.02 supports efficient asset use
- Diverse revenue streams from products ($1.5B) and services ($1.6B)
- Global presence with significant Americas ($1.8B), EMEA ($827M), Asia Pacific ($537M) sales
CoreWeave Weaknesses
- Negative net margin at -45.08% reflects losses
- ROIC of 2.08% is below WACC of 83.48%, destroying value
- Poor liquidity ratios (current and quick at 0.39)
- High debt-to-assets at 59.56% increases financial risk
- Negative interest coverage of -1.06 signals stress
- Low asset turnover of 0.11 limits efficiency
- Minimal dividend yield at 0.36%
F5 Weaknesses
- Unfavorable PE (26.91) and PB (5.19) valuations may pressure returns
- Asset turnover of 0.49 lags efficiency benchmarks
- Zero dividend yield may deter income investors
Both companies reveal contrasting financial profiles. CoreWeave’s strengths in equity returns and market valuation contrast with its liquidity and profitability weaknesses. F5 demonstrates solid profitability, liquidity, and global diversification but faces valuation and efficiency challenges. These profiles highlight distinct corporate strategies and risk exposures investors must weigh carefully.
The Moat Duel: Analyzing Competitive Defensibility
A structural moat is the only reliable shield protecting long-term profits from relentless competitive pressure. Let’s dissect the competitive moats of CoreWeave and F5:
CoreWeave, Inc.: Emerging Scale Advantage with Infrastructure Focus
CoreWeave’s moat stems from its specialized GPU compute infrastructure catering to GenAI workloads. Despite rapid revenue growth (12,000% over 3 years), CoreWeave generates negative net margins and destroys capital (ROIC well below WACC). Its moat remains fragile as it scales and invests heavily; future products must improve profitability to solidify defenses.
F5, Inc.: Established Application Security Ecosystem
F5’s moat leverages a mature portfolio of multi-cloud security and delivery solutions with strong customer lock-in. It consistently delivers ROIC above WACC by 5.7%, with growing profitability and stable 82% gross margins. Its broad geographic reach and cloud partnerships position it to deepen its moat through expansion and innovation in 2026.
Infrastructure Scaling vs. Security Ecosystem: Who Defends Best?
F5 holds the deeper and more durable moat, evidenced by superior ROIC and margin stability. CoreWeave’s rapid growth is impressive but unprofitable, leaving it vulnerable. F5 is better equipped to defend market share with proven profitability and expanding ecosystem lock-in.
Which stock offers better returns?
Over the past year, CoreWeave, Inc. and F5, Inc. showed strong upward price movements with accelerating trends and notable volatility, reflecting robust trading dynamics.
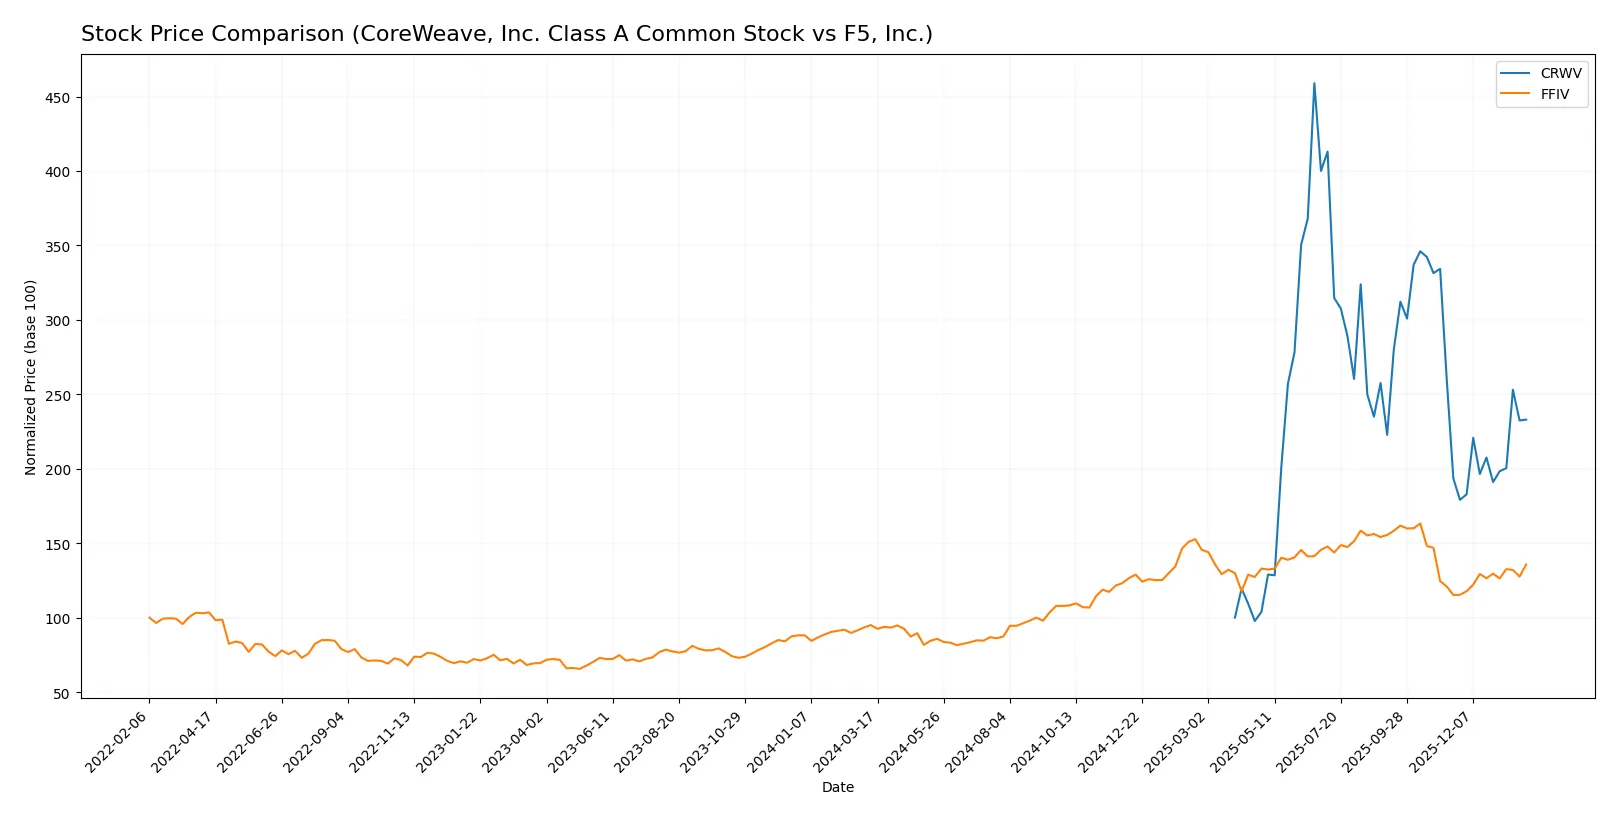
Trend Comparison
CoreWeave, Inc. stock rose 133% over the last 12 months, displaying a bullish trend with accelerating momentum and a high standard deviation of 34.91, hitting a peak near 184.
F5, Inc. gained 43% in the same period, also bullish with acceleration, but with greater volatility at 48.51 standard deviation and a high price close to 332.
CoreWeave outperformed F5 significantly, delivering the highest market return with a 90% greater price increase over the past year.
Target Prices
Analysts present a cautiously optimistic target consensus for CoreWeave and F5, reflecting growth potential tempered by market volatility.
| Company | Target Low | Target High | Consensus |
|---|---|---|---|
| CoreWeave, Inc. Class A Common Stock | 84 | 175 | 120.73 |
| F5, Inc. | 295 | 352 | 330.67 |
CoreWeave’s consensus target of 120.73 suggests upside from its current 93.19 stock price, indicating growth expectations. F5’s consensus target of 330.67 also signals potential appreciation from its current 275.61 level.

Don’t Let Luck Decide Your Entry Point
Optimize your entry points with our advanced ProRealTime indicators. You’ll get efficient buy signals with precise price targets for maximum performance. Start outperforming now!
How do institutions grade them?
The following tables summarize recent institutional grades for CoreWeave, Inc. Class A Common Stock and F5, Inc.:
CoreWeave, Inc. Class A Common Stock Grades
Here are the latest analyst grades from notable financial institutions for CoreWeave:
| Grading Company | Action | New Grade | Date |
|---|---|---|---|
| Mizuho | Maintain | Neutral | 2026-01-27 |
| Deutsche Bank | Upgrade | Buy | 2026-01-27 |
| Macquarie | Maintain | Neutral | 2026-01-27 |
| Needham | Maintain | Hold | 2026-01-26 |
| DA Davidson | Upgrade | Buy | 2026-01-26 |
| Barclays | Maintain | Equal Weight | 2026-01-12 |
| Wells Fargo | Maintain | Overweight | 2026-01-08 |
| DA Davidson | Upgrade | Neutral | 2026-01-05 |
| Jefferies | Maintain | Buy | 2026-01-05 |
| Goldman Sachs | Maintain | Neutral | 2025-11-17 |
F5, Inc. Grades
Below are the most recent grades assigned to F5, Inc. by prominent analysts:
| Grading Company | Action | New Grade | Date |
|---|---|---|---|
| Needham | Maintain | Hold | 2026-01-28 |
| Piper Sandler | Maintain | Overweight | 2026-01-28 |
| Goldman Sachs | Maintain | Neutral | 2026-01-28 |
| Barclays | Maintain | Equal Weight | 2026-01-28 |
| RBC Capital | Maintain | Outperform | 2026-01-28 |
| JP Morgan | Upgrade | Overweight | 2026-01-15 |
| Piper Sandler | Upgrade | Overweight | 2026-01-05 |
| RBC Capital | Upgrade | Outperform | 2026-01-05 |
| Morgan Stanley | Maintain | Equal Weight | 2025-12-17 |
| Morgan Stanley | Maintain | Equal Weight | 2025-10-28 |
Which company has the best grades?
F5, Inc. holds generally stronger grades, with multiple “Overweight” and “Outperform” ratings from leading firms. CoreWeave has a mix of “Neutral,” “Hold,” and some “Buy” ratings, indicating more cautious optimism. Investors may interpret F5’s higher grades as a signal of greater institutional confidence.
Risks specific to each company
The following categories identify the critical pressure points and systemic threats facing both firms in the 2026 market environment:
1. Market & Competition
CoreWeave, Inc. Class A Common Stock
- Faces intense competition in cloud infrastructure with rapid tech shifts and high beta indicating sensitivity to market swings.
F5, Inc.
- Competes in multi-cloud security with established partnerships, showing stable demand but pressure from evolving cloud players.
2. Capital Structure & Debt
CoreWeave, Inc. Class A Common Stock
- High debt-to-assets ratio (59.56%) and poor interest coverage signal financial strain and risk in servicing debt.
F5, Inc.
- Low debt-to-assets (3.65%) and strong interest coverage provide financial flexibility and lower default risk.
3. Stock Volatility
CoreWeave, Inc. Class A Common Stock
- Extremely high beta (~21.65) implies severe price volatility and market sensitivity, raising investor risk.
F5, Inc.
- Beta near 1.0 suggests stock moves in line with market, offering more predictable price behavior.
4. Regulatory & Legal
CoreWeave, Inc. Class A Common Stock
- Emerging company risks facing evolving cloud and AI regulations; limited track record managing compliance.
F5, Inc.
- Longer operational history with established compliance protocols in software security, but subject to complex global regulations.
5. Supply Chain & Operations
CoreWeave, Inc. Class A Common Stock
- Relies on cutting-edge GPU and compute hardware; vulnerable to supply chain disruptions and tech obsolescence.
F5, Inc.
- Diversified product lines and services reduce single points of operational failure but must manage global service delivery complexity.
6. ESG & Climate Transition
CoreWeave, Inc. Class A Common Stock
- Younger company with limited ESG track record; energy-intensive infrastructure may face increasing regulatory scrutiny.
F5, Inc.
- More mature with likely established ESG policies but must continuously adapt to sustainability demands in tech sector.
7. Geopolitical Exposure
CoreWeave, Inc. Class A Common Stock
- Primarily US-based, less diversified geographically, increasing vulnerability to US-specific policy shifts.
F5, Inc.
- Global footprint across Americas, EMEA, and APAC spreads geopolitical risk but faces complexity from international tensions.
Which company shows a better risk-adjusted profile?
CoreWeave’s most impactful risk is its precarious capital structure and extreme stock volatility. F5’s primary risk lies in competitive pressure amid evolving cloud security demands. Overall, F5 exhibits a markedly better risk-adjusted profile, supported by its strong Altman Z-score (5.3) and Piotroski score (7), compared to CoreWeave’s distress-zone Z-score (1.0) and weak Piotroski (3). This gap reflects F5’s financial stability and operational maturity versus CoreWeave’s early-stage fragility.
Final Verdict: Which stock to choose?
CoreWeave’s superpower lies in its explosive revenue growth and gross margin strength, signaling a high-growth potential in emerging tech markets. However, its persistent negative free cash flow and weak liquidity ratios remain points of vigilance. It suits aggressive growth portfolios willing to weather operational volatility for outsized upside.
F5, Inc. commands a durable moat through steady returns on invested capital and resilient profitability. Its strong balance sheet and consistent free cash flow offer better stability compared to CoreWeave. This makes it more attractive for GARP investors who value growth balanced with financial prudence.
If you prioritize aggressive growth with a tolerance for financial strain, CoreWeave’s disruptive momentum might be compelling despite risks. However, if you seek a blend of growth and stability with a proven competitive advantage, F5 outshines as the more prudent choice. Each fits markedly different investor profiles given their distinct risk-reward profiles.
Disclaimer: Investment carries a risk of loss of initial capital. The past performance is not a reliable indicator of future results. Be sure to understand risks before making an investment decision.
Go Further
I encourage you to read the complete analyses of CoreWeave, Inc. Class A Common Stock and F5, Inc. to enhance your investment decisions: