In the fast-evolving technology sector, CoreWeave, Inc. (CRWV) and CyberArk Software Ltd. (CYBR) stand out as key players in software infrastructure. CoreWeave specializes in cloud-based GPU and AI compute services, while CyberArk leads in cybersecurity solutions focused on privileged access management. Both companies innovate to meet growing enterprise demands, making this comparison essential. Join me as we explore which stock offers the best investment opportunity in 2026.
Table of contents
Companies Overview
I will begin the comparison between CoreWeave and CyberArk by providing an overview of these two companies and their main differences.
CoreWeave Overview
CoreWeave, Inc. operates a cloud platform focused on scaling and accelerating GenAI compute workloads for enterprises. The company provides a range of infrastructure services including GPU and CPU compute, storage, networking, and managed services. Founded in 2017 and based in Livingston, NJ, CoreWeave aims to support AI model training, VFX rendering, and mission-critical compute tasks, positioning itself in the software infrastructure sector.
CyberArk Overview
CyberArk Software Ltd. develops software-based security solutions primarily targeting privileged access management and identity services across multiple global regions. Founded in 1999 and headquartered in Petah Tikva, Israel, CyberArk offers SaaS products such as Endpoint Privilege Manager and Cloud Entitlements Manager to reduce security risks. It serves diverse industries including financial services, healthcare, and government, emphasizing secure access and credential management.
Key similarities and differences
Both CoreWeave and CyberArk operate within the software infrastructure industry, focusing on enterprise technology solutions. CoreWeave emphasizes cloud computing resources for AI and rendering workloads, whereas CyberArk specializes in cybersecurity software focused on privileged access and identity management. CoreWeave is a younger, smaller U.S.-based company with a niche in compute acceleration, while CyberArk is an established Israeli firm with a broader security product portfolio and larger workforce.
Income Statement Comparison
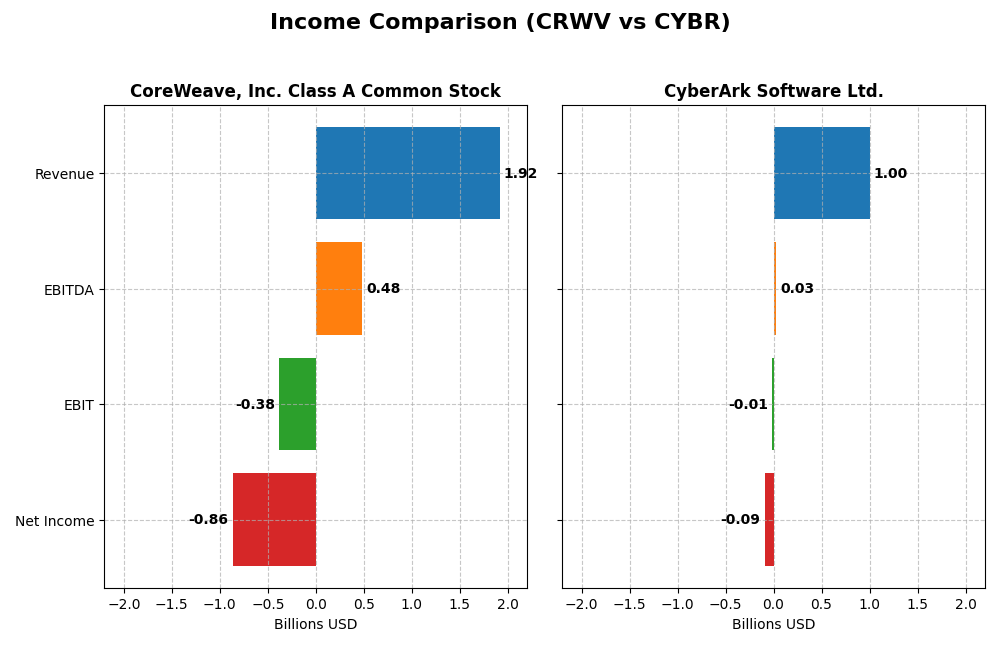
This table provides a side-by-side comparison of key income statement metrics for CoreWeave, Inc. Class A Common Stock and CyberArk Software Ltd. for the fiscal year 2024.
| Metric | CoreWeave, Inc. Class A Common Stock | CyberArk Software Ltd. |
|---|---|---|
| Market Cap | 50.4B | 22.9B |
| Revenue | 1.92B | 1.00B |
| EBITDA | 480M | 28.7M |
| EBIT | -383M | -13.3M |
| Net Income | -863M | -93.5M |
| EPS | -2.33 | -2.12 |
| Fiscal Year | 2024 | 2024 |
Income Statement Interpretations
CoreWeave, Inc. Class A Common Stock
CoreWeave’s revenue surged dramatically from $15.8M in 2022 to $1.92B in 2024, reflecting rapid expansion. Despite this, net income remained deeply negative, worsening from -$31M to -$937M over the same period. Gross margin stayed robust at 74.24%, but operating and net margins were unfavorable. In 2024, revenue growth slowed but gross profit and EBIT margins improved, indicating operational scaling challenges.
CyberArk Software Ltd.
CyberArk showed steady revenue growth from $464M in 2020 to $1.0B in 2024, with gross margins consistently favorable at 79.18%. Net income remained negative, declining from -$5.8M in 2020 to -$93M in 2024. EBIT margin was slightly negative, but interest expenses improved favorably. The latest year saw solid revenue and EBIT growth, though net margin and EPS deteriorated, reflecting ongoing profitability pressures.
Which one has the stronger fundamentals?
CoreWeave exhibits stronger revenue and gross profit growth, but with steep net losses and high interest expenses impacting profitability. CyberArk maintains higher gross margins and more stable operating expenses, yet struggles with persistent net losses and declining net margins. Overall, CoreWeave’s income statement is slightly more favorable, while CyberArk’s results are more balanced but neutral in strength.
Financial Ratios Comparison
The table below presents a side-by-side comparison of key financial ratios for CoreWeave, Inc. Class A Common Stock (CRWV) and CyberArk Software Ltd. (CYBR) for the fiscal year ended 2024.
| Ratios | CoreWeave, Inc. (CRWV) | CyberArk Software Ltd. (CYBR) |
|---|---|---|
| ROE | 2.09% | -3.94% |
| ROIC | 2.08% | -2.85% |
| P/E | -18.73 | -157.49 |
| P/B | -39.11 | 6.21 |
| Current Ratio | 0.39 | 1.48 |
| Quick Ratio | 0.39 | 1.48 |
| D/E | -25.68 | 0.01 |
| Debt-to-Assets | 59.56% | 0.88% |
| Interest Coverage | 0.90 | -17.90 |
| Asset Turnover | 0.11 | 0.30 |
| Fixed Asset Turnover | 0.13 | 51.11 |
| Payout ratio | -6.69% | 0% |
| Dividend yield | 0.36% | 0% |
Interpretation of the Ratios
CoreWeave, Inc. Class A Common Stock
CoreWeave shows mostly unfavorable ratios, including a poor current ratio (0.39) and high debt-to-assets (59.56%), indicating liquidity and leverage concerns. However, its return on equity (208.77%) and valuation metrics (PE and PB) are favorable. The company does not pay dividends, focusing likely on growth or reinvestment, with no dividend yield reported and no mention of buybacks.
CyberArk Software Ltd.
CyberArk presents a mixed ratio profile with slightly unfavorable overall ratings. It has a healthier liquidity position (current ratio 1.48) and low debt-to-assets (0.88%), yet suffers from a negative return on equity (-3.94%) and interest coverage issues. CyberArk does not pay dividends, possibly prioritizing R&D and acquisitions given its sector, and shows no dividend yield or buyback activity.
Which one has the best ratios?
Comparing both, CyberArk holds a relatively better liquidity and leverage position with more favorable ratios overall, despite some profitability weaknesses. CoreWeave faces significant challenges in liquidity and leverage despite strong equity returns. Therefore, CyberArk’s ratios are slightly more balanced, while CoreWeave’s profile is more skewed toward risk.
Strategic Positioning
This section compares the strategic positioning of CoreWeave and CyberArk, focusing on Market position, Key segments, and exposure to technological disruption:
CoreWeave
- Newer player with $50B market cap, operating in cloud infrastructure with high market volatility.
- Focuses on cloud platform services for GenAI workloads, including GPU/CPU compute and storage.
- Infrastructure field with evolving AI tech poses disruption risk but CoreWeave builds scalable platforms.
CyberArk
- Established with $23B market cap, focused on cybersecurity software, facing moderate competitive pressure.
- Diverse cybersecurity solutions including privileged access, SaaS, subscriptions, and professional services.
- Cybersecurity sector faces continual disruption from evolving cyber threats, requiring constant innovation.
CoreWeave vs CyberArk Positioning
CoreWeave’s approach is concentrated on cloud infrastructure for AI workloads, relying on emerging technology growth. CyberArk offers a diversified portfolio in cybersecurity software, spreading risk across segments but facing intense innovation demands. Each has distinct industry exposure and competitive challenges.
Which has the best competitive advantage?
Both companies are currently shedding value; CoreWeave has an unfavorable moat with stable profitability while CyberArk shows a very unfavorable moat with declining returns, indicating neither holds a strong competitive advantage based on ROIC trends.
Stock Comparison
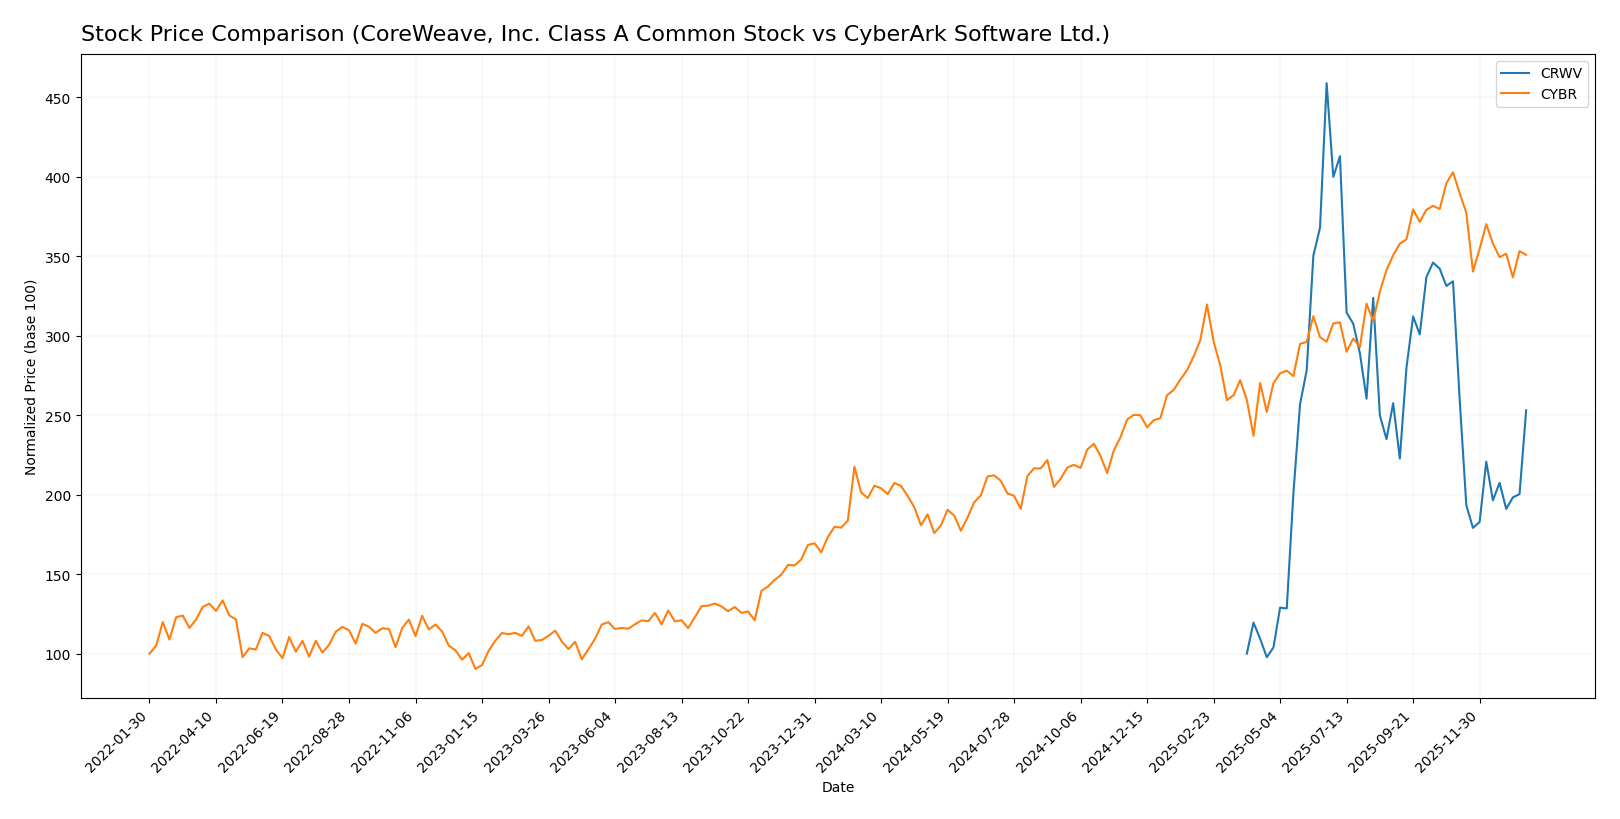
The past year showed significant bullish trends for CoreWeave, Inc. Class A Common Stock (CRWV) and CyberArk Software Ltd. (CYBR), with both experiencing substantial gains but notable deceleration and recent declines in their stock prices.
Trend Analysis
CoreWeave (CRWV) recorded a strong 153.08% price increase over the past 12 months, marking a bullish trend with deceleration and a peak price of 183.58. Recent weeks saw a 24.29% decline, indicating short-term weakness.
CyberArk (CYBR) showed a 77.27% rise over the same period, also bullish with deceleration, marked by high volatility and a peak price of 520.78. The recent trend is bearish, with a 12.89% price drop since November 2025.
Comparing trends, CRWV outperformed CYBR in yearly price appreciation, despite both stocks facing recent short-term price declines and decelerated momentum.
Target Prices
Analyst consensus provides a clear outlook on the expected price range for these technology infrastructure stocks.
| Company | Target High | Target Low | Consensus |
|---|---|---|---|
| CoreWeave, Inc. Class A Common Stock | 175 | 68 | 115.79 |
| CyberArk Software Ltd. | 520 | 440 | 479.22 |
CoreWeave’s target consensus of 115.79 suggests moderate upside from the current price of 101.23. CyberArk’s consensus target of 479.22 implies a slight upside compared to its current price of 453.65. Analyst expectations indicate generally positive growth potential for both stocks.
Analyst Opinions Comparison
This section compares analysts’ ratings and financial scores for CoreWeave, Inc. Class A Common Stock (CRWV) and CyberArk Software Ltd. (CYBR):
Rating Comparison
CRWV Rating
- Rating: D+, considered very favorable overall.
- Discounted Cash Flow Score: 1, very unfavorable.
- ROE Score: 1, very unfavorable.
- ROA Score: 1, very unfavorable.
- Debt To Equity Score: 1, very unfavorable.
- Overall Score: 1, very unfavorable.
CYBR Rating
- Rating: C-, considered very favorable overall.
- Discounted Cash Flow Score: 3, moderate rating.
- ROE Score: 1, very unfavorable.
- ROA Score: 1, very unfavorable.
- Debt To Equity Score: 2, moderate rating.
- Overall Score: 1, very unfavorable.
Which one is the best rated?
Based strictly on the provided data, CYBR holds a better rating (C-) than CRWV (D+), supported by a higher discounted cash flow score and debt-to-equity score. However, both share very unfavorable overall, ROE, and ROA scores.
Scores Comparison
Here is a comparison of the Altman Z-Score and Piotroski Score for both companies:
CRWV Scores
- Altman Z-Score: 0.80, in the distress zone, indicating high bankruptcy risk.
- Piotroski Score: 3, classified as very weak financial strength.
CYBR Scores
- Altman Z-Score: 6.52, in the safe zone, indicating low bankruptcy risk.
- Piotroski Score: 3, classified as very weak financial strength.
Which company has the best scores?
Based on the provided data, CYBR has a significantly better Altman Z-Score, indicating stronger financial stability, while both companies share the same very weak Piotroski Score of 3.
Grades Comparison
The grades of CoreWeave, Inc. Class A Common Stock and CyberArk Software Ltd. reflect differing analyst perspectives and consensus ratings:
CoreWeave, Inc. Class A Common Stock Grades
The following table summarizes recent grades from reputable analyst firms for CoreWeave:
| Grading Company | Action | New Grade | Date |
|---|---|---|---|
| Barclays | Maintain | Equal Weight | 2026-01-12 |
| Wells Fargo | Maintain | Overweight | 2026-01-08 |
| Jefferies | Maintain | Buy | 2026-01-05 |
| DA Davidson | Upgrade | Neutral | 2026-01-05 |
| Goldman Sachs | Maintain | Neutral | 2025-11-17 |
| HC Wainwright & Co. | Maintain | Buy | 2025-11-12 |
| Wells Fargo | Maintain | Overweight | 2025-11-12 |
| Barclays | Maintain | Equal Weight | 2025-11-12 |
| Loop Capital | Maintain | Buy | 2025-11-12 |
| B of A Securities | Maintain | Neutral | 2025-11-11 |
CoreWeave’s grades mostly range between Neutral and Buy, with multiple upgrades and maintained Buy or Overweight ratings indicating steady analyst confidence.
CyberArk Software Ltd. Grades
The following table presents analyst grades for CyberArk Software Ltd.:
| Grading Company | Action | New Grade | Date |
|---|---|---|---|
| Oppenheimer | Maintain | Outperform | 2024-10-22 |
| Keybanc | Maintain | Overweight | 2024-10-18 |
| Mizuho | Maintain | Outperform | 2024-10-17 |
| BTIG | Maintain | Buy | 2024-10-09 |
| Barclays | Maintain | Overweight | 2024-10-07 |
| Wedbush | Maintain | Outperform | 2024-10-01 |
| Jefferies | Maintain | Buy | 2024-09-24 |
| DA Davidson | Maintain | Buy | 2024-08-09 |
| Rosenblatt | Maintain | Buy | 2024-08-09 |
| Susquehanna | Maintain | Positive | 2024-08-09 |
CyberArk consistently receives Outperform and Buy grades, with no downgrades, reflecting strong and sustained analyst endorsement.
Which company has the best grades?
CyberArk Software Ltd. has received stronger and more consistent positive grades, predominantly Outperform and Buy, compared to CoreWeave’s mix of Neutral to Buy ratings. This suggests CyberArk may be viewed as a more robust investment by analysts, potentially impacting investor confidence and portfolio decisions.
Strengths and Weaknesses
Below is a comparison table outlining the key strengths and weaknesses of CoreWeave, Inc. (CRWV) and CyberArk Software Ltd. (CYBR) based on the most recent data available.
| Criterion | CoreWeave, Inc. Class A Common Stock (CRWV) | CyberArk Software Ltd. (CYBR) |
|---|---|---|
| Diversification | Limited product range, primarily cloud GPU infrastructure | Diverse revenue streams including SaaS, maintenance, professional services, and licenses |
| Profitability | Negative net margin (-45.08%), high ROE (208.77%), but unfavorable ROIC vs WACC (-82.85%) | Negative net margin (-9.34%), negative ROE (-3.94%) and declining ROIC (-11.0%) |
| Innovation | Focused on specialized GPU cloud services, but value destruction suggests inefficiencies | Strong in cybersecurity innovation with growing SaaS revenue but profitability challenges |
| Global presence | Emerging global footprint with limited scale | Established global presence with large SaaS and subscription revenues |
| Market Share | Niche player in cloud GPU market with growth potential | Leading player in cybersecurity with expanding SaaS market share |
Key takeaways: CoreWeave shows potential in a niche market but currently destroys value and struggles with profitability and liquidity. CyberArk, while diversified and globally established, faces declining profitability and value destruction despite strong SaaS growth. Investors should weigh growth prospects against high risks.
Risk Analysis
Below is a comparative risk assessment table for CoreWeave, Inc. Class A Common Stock (CRWV) and CyberArk Software Ltd. (CYBR) based on the most recent 2024 data:
| Metric | CoreWeave, Inc. (CRWV) | CyberArk Software Ltd. (CYBR) |
|---|---|---|
| Market Risk | Very high beta (21.65) indicating extreme volatility | Moderate beta (0.92), more stable |
| Debt level | High debt-to-assets (59.56%), weak interest coverage | Very low debt-to-assets (0.88%), moderate interest coverage |
| Regulatory Risk | Moderate, US technology sector exposure | Moderate, global cybersecurity regulations impact |
| Operational Risk | Low current and quick ratios (0.39), operational inefficiencies | Moderate liquidity (1.48), better operational metrics |
| Environmental Risk | Low direct impact, typical tech sector footprint | Low direct impact, software-focused with minimal environmental risk |
| Geopolitical Risk | US-based, moderate geopolitical exposure | Israel-based, geopolitical tensions in region possible |
The most likely and impactful risks for CoreWeave are its extreme market volatility and high leverage, raising concerns about financial stability and operational liquidity. CyberArk shows more balanced financials with lower debt risk, but geopolitical tension in its region and industry regulatory challenges remain material. Both companies exhibit weak profitability and financial health scores, warranting cautious risk management before investing.
Which Stock to Choose?
CoreWeave, Inc. Class A Common Stock (CRWV) shows a strong revenue growth of 736.64% in 2024 with a favorable gross margin of 74.24%. However, profitability ratios are mixed with a negative net margin of -45.08% and a high debt ratio at 59.56%. Financial ratios are mostly unfavorable, including a low current ratio of 0.39 and negative interest coverage. The company’s rating is very favorable (D+), but the global ratios opinion is unfavorable, reflecting value destruction.
CyberArk Software Ltd. (CYBR) posted steady revenue growth of 33.1% in 2024 and a higher gross margin of 79.18%. Profitability remains challenged with a net margin of -9.34% and declining returns on equity and capital employed. Financial ratios are slightly more balanced with a current ratio of 1.48 and moderate debt levels. The rating is very favorable (C-), with a slightly unfavorable global ratios opinion, indicating some operational challenges but better stability than CRWV.
For investors focused on growth and aggressive expansion, CRWV’s rapid revenue increase and favorable income statement might appear attractive, despite its financial risks and value destruction signals. Conversely, those prioritizing financial stability and moderate growth could find CYBR’s steadier performance and safer financial ratios more aligned with their profile, despite its declining profitability trends.
Disclaimer: Investment carries a risk of loss of initial capital. The past performance is not a reliable indicator of future results. Be sure to understand risks before making an investment decision.
Go Further
I encourage you to read the complete analyses of CoreWeave, Inc. Class A Common Stock and CyberArk Software Ltd. to enhance your investment decisions: