Home > Comparison > Technology > CRWV vs CPAY
The strategic rivalry between CoreWeave, Inc. and Corpay, Inc. shapes the Technology sector’s infrastructure landscape. CoreWeave excels as a cloud platform builder specializing in GPU and AI compute workloads, a capital-efficient innovator. In contrast, Corpay operates as a payments powerhouse, managing complex corporate and consumer expense solutions globally. This analysis will assess which company’s operational model delivers superior risk-adjusted returns for a diversified portfolio amid evolving tech demands.

Table of contents
Companies Overview
CoreWeave and Corpay stand as pivotal players in the evolving software infrastructure landscape.
CoreWeave, Inc. Class A Common Stock: Cloud Infrastructure Powerhouse
CoreWeave dominates the cloud infrastructure market with a focus on scaling and accelerating GenAI workloads. It generates revenue primarily by providing GPU and CPU compute, storage, networking, and managed services. In 2026, its strategic focus sharpens on supporting AI model training, inference, and mission-critical compute, capturing growth in enterprise AI demands.
Corpay, Inc.: Payments Infrastructure Specialist
Corpay leads in software infrastructure tailored to business and consumer payment solutions. Its revenue stems from vehicle, lodging, and corporate payment services, including accounts payable automation and virtual cards. The company’s 2026 strategy centers on expanding cross-border payment solutions and automating corporate expense management across multiple global markets.
Strategic Collision: Similarities & Divergences
Both companies operate in software infrastructure but diverge sharply in focus: CoreWeave emphasizes a closed ecosystem for AI compute, while Corpay builds an open payments infrastructure. Their primary battleground lies in enterprise adoption—CoreWeave for AI workloads, Corpay for payment automation. This contrast defines distinct risk and growth profiles, marking CoreWeave as a high-beta AI infrastructure play versus Corpay’s stable payment services model.
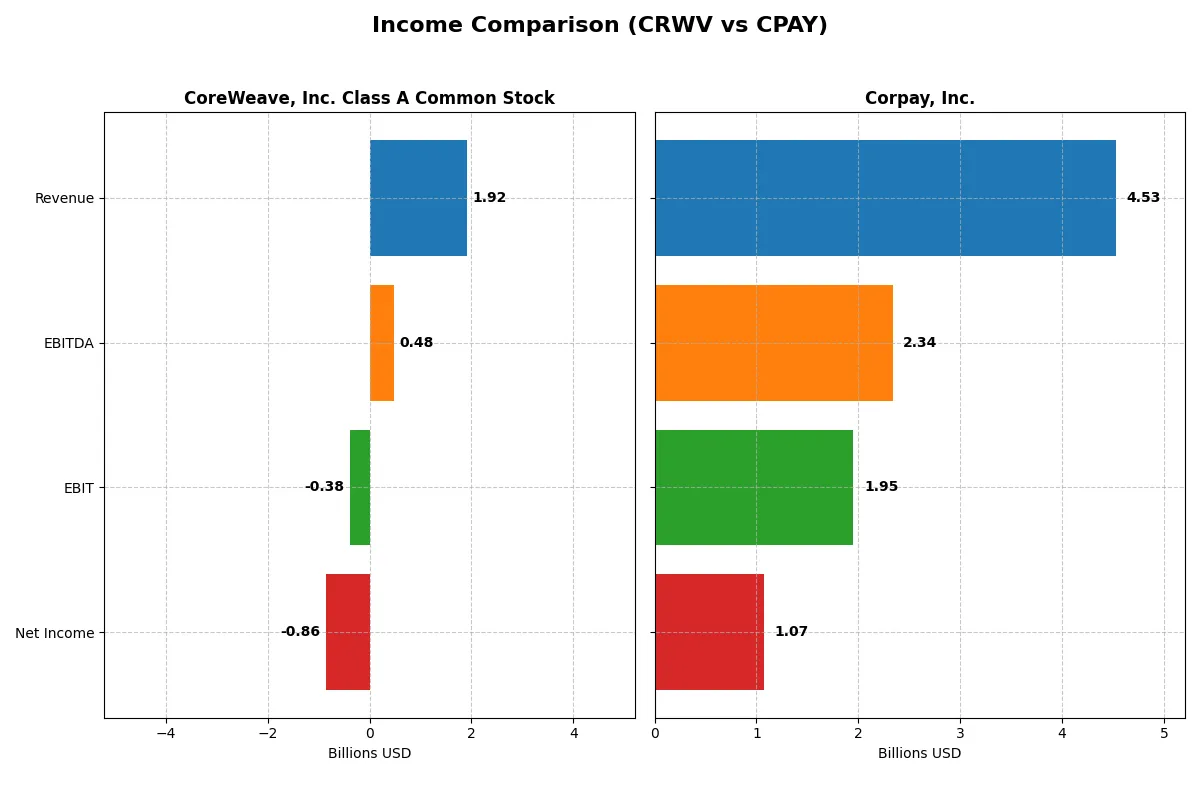
Income Statement Comparison
This data dissects the core profitability and scalability of both corporate engines to reveal who dominates the bottom line:
| Metric | CoreWeave (CRWV) | Corpay (CPAY) |
|---|---|---|
| Revenue | 1.92B | 4.53B |
| Cost of Revenue | 493M | 1.36B |
| Operating Expenses | 1.10B | 1.21B |
| Gross Profit | 1.42B | 3.17B |
| EBITDA | 480M | 2.34B |
| EBIT | -383M | 1.95B |
| Interest Expense | 361M | 404M |
| Net Income | -863M | 1.07B |
| EPS | -2.33 | 15.25 |
| Fiscal Year | 2024 | 2025 |
Income Statement Analysis: The Bottom-Line Duel
This income statement comparison reveals how efficiently each company operates and converts revenue into profit over recent years.
CoreWeave, Inc. Class A Common Stock Analysis
CoreWeave’s revenue soared from 15M in 2022 to 1.92B in 2024, showing explosive top-line growth. However, net income remains deeply negative, hitting -937M in 2024. The gross margin stays strong at 74%, but heavy interest expenses and other costs drag EBIT margin to -20%, signaling continued operational challenges despite revenue momentum.
Corpay, Inc. Analysis
Corpay grew revenue steadily from 2.83B in 2021 to 4.53B in 2025, maintaining a solid gross margin near 70%. Its net income rose to over 1B in 2025, supported by a robust 23.6% net margin and positive EBIT margin above 43%. Corpay demonstrates consistent profitability and operational efficiency, with moderate interest expenses and healthy earnings growth.
Margin Power vs. Revenue Scale
Corpay clearly outperforms CoreWeave in profitability and margin management despite smaller revenue acceleration. CoreWeave’s rapid revenue expansion is overshadowed by persistent losses and high interest costs. Investors seeking stable earnings and margin resilience will find Corpay’s profile significantly more attractive than CoreWeave’s high-growth yet unprofitable trajectory.
Financial Ratios Comparison
These vital ratios act as a diagnostic tool to expose the underlying fiscal health, valuation premiums, and capital efficiency of the companies analyzed:
| Ratios | CoreWeave (CRWV) | Corpay (CPAY) |
|---|---|---|
| ROE | 2.09% | 27.55% |
| ROIC | 2.08% | 8.78% |
| P/E | -18.73 | 19.73 |
| P/B | -39.11 | 5.43 |
| Current Ratio | 0.39 | 0.98 |
| Quick Ratio | 0.39 | 0.98 |
| D/E (Debt-to-Equity) | -25.68 | 2.58 |
| Debt-to-Assets | 59.56% | 37.86% |
| Interest Coverage | 0.90 | 4.83 |
| Asset Turnover | 0.11 | 0.17 |
| Fixed Asset Turnover | 0.13 | 9.59 |
| Payout ratio | -6.69% | 0% |
| Dividend yield | 0.36% | 0% |
| Fiscal Year | 2024 | 2025 |
Efficiency & Valuation Duel: The Vital Signs
Financial ratios act as a company’s DNA, revealing hidden risks and operational excellence that raw figures cannot capture alone.
CoreWeave, Inc. Class A Common Stock
CoreWeave posts a high ROE of 209% but suffers from negative net margins and stretched valuation metrics, including a low current ratio of 0.39. Its P/E and P/B ratios appear favorable, yet weak cash flow and high debt pose risks. Dividend yield is minimal, reflecting limited shareholder returns and no R&D reinvestment.
Corpay, Inc.
Corpay delivers solid profitability with a 28% ROE and positive net margin of 23.6%, supported by a reasonable P/E of 19.7. The company balances moderate debt and maintains a near-neutral quick ratio of 0.98. It lacks dividends but shows operational efficiency and reinvests to sustain growth, reflected in a strong fixed asset turnover of 9.59.
Premium Valuation vs. Operational Safety
CoreWeave’s metrics reveal high risk with stretched liquidity and earnings quality despite strong ROE. Corpay offers a balanced risk-reward profile with sustainable profitability and operational discipline. Investors seeking stability and steady growth may find Corpay’s profile more suitable than CoreWeave’s volatile setup.
Which one offers the Superior Shareholder Reward?
I compare CoreWeave (CRWV) and Corpay (CPAY) on distribution philosophy and shareholder returns. CRWV pays a tiny 0.36% dividend with a negative free cash flow, signaling unsustainable payouts. It has minimal buyback activity, reflecting weak capital allocation amid losses. CPAY pays no dividends but returns capital aggressively via buybacks supported by positive free cash flow of 18.5/share in 2025. CPAY’s payout focus on buybacks leverages strong operating margins (43%) and consistent cash generation. Historically, CPAY’s model aligns with long-term value creation better than CRWV’s fragile dividend. I conclude CPAY offers a superior total return profile in 2026.
Comparative Score Analysis: The Strategic Profile
The radar chart reveals the fundamental DNA and trade-offs of CoreWeave and Corpay, highlighting their financial strengths and weaknesses side by side:
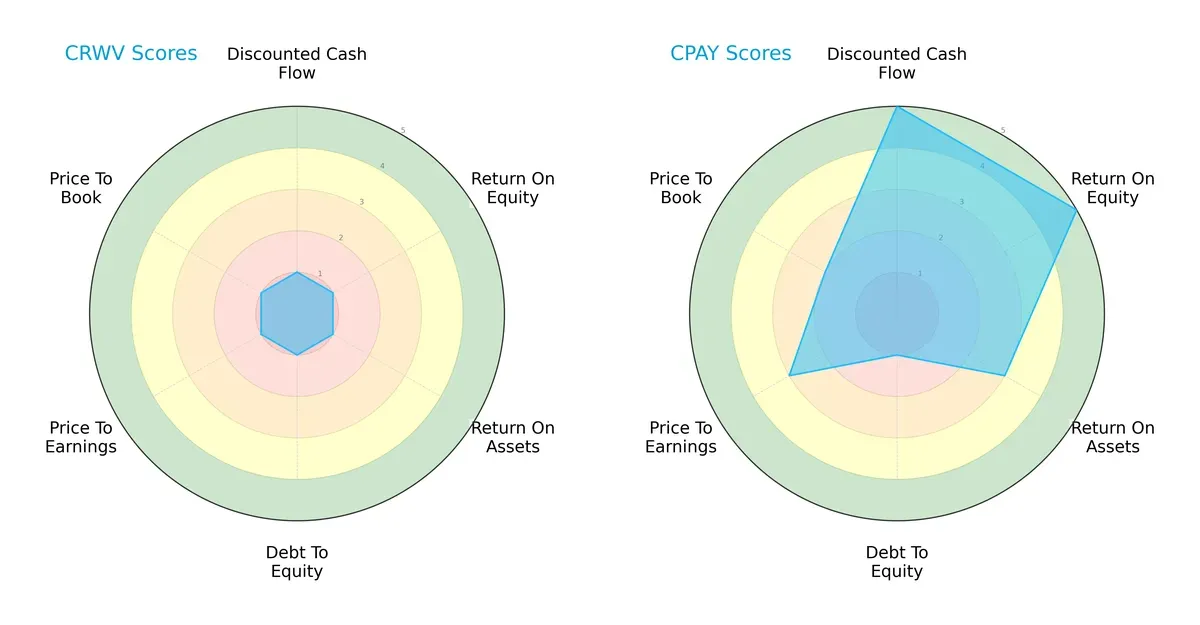
Corpay dominates in discounted cash flow and return on equity, scoring 5 in both, signaling superior profitability and cash generation. CoreWeave lags significantly, with all scores at 1, indicating severe financial stress. Both firms share a weak debt-to-equity profile, scoring equally low at 1, exposing balance sheet vulnerabilities. Corpay’s valuation metrics (PE and PB scores) are moderate but still surpass CoreWeave’s uniformly poor marks. Corpay offers a more balanced profile, while CoreWeave relies on no clear financial edge.
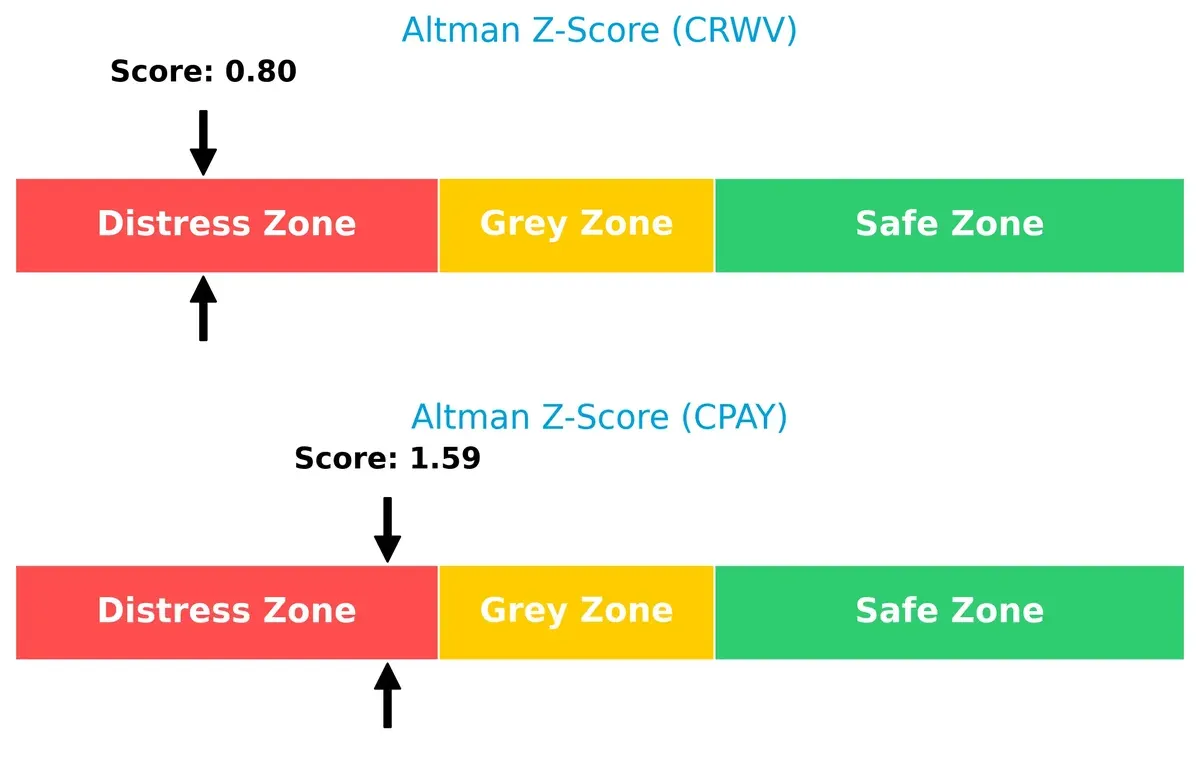
Bankruptcy Risk: Solvency Showdown
The Altman Z-Score comparison shows both firms in the distress zone, but Corpay’s 1.59 score is closer to the grey zone than CoreWeave’s 0.80, implying a marginally better survival outlook in this cycle:
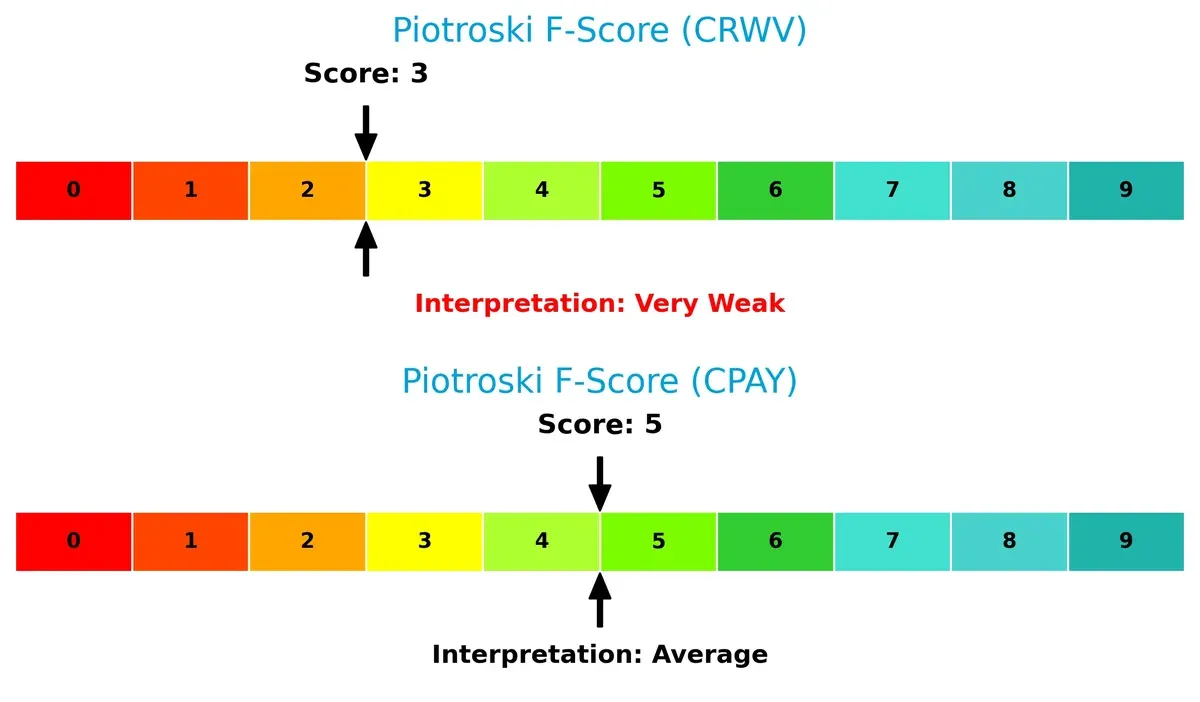
Financial Health: Quality of Operations
Corpay’s Piotroski F-Score of 5 indicates average financial health, while CoreWeave’s 3 flags very weak operational quality. CoreWeave presents more red flags in profitability and efficiency metrics compared to Corpay:
How are the two companies positioned?
This section dissects the operational DNA of CoreWeave and Corpay by comparing their revenue distribution and internal strengths and weaknesses. The final goal is to confront their economic moats and identify which model offers the most resilient competitive advantage today.
Strengths and Weaknesses Comparison
This table compares the Strengths and Weaknesses of CoreWeave (CRWV) and Corpay (CPAY):
CRWV Strengths
- High ROE at 208.77% indicates strong shareholder returns
- Favorable P/E and P/B ratios suggest market confidence
- Low debt to equity ratio at -25.68 implies conservative leverage
CPAY Strengths
- Positive net margin at 23.62% shows profitability
- Strong fixed asset turnover at 9.59 indicates efficient use of assets
- Global revenue presence with significant US, UK, Brazil sales
CRWV Weaknesses
- Negative net margin of -45.08% signals operational losses
- Very high WACC at 82.83% reflects costly capital
- Low current and quick ratios at 0.39 indicate liquidity risk
- High debt to assets at 59.56% raises solvency concerns
CPAY Weaknesses
- Current ratio below 1.0 at 0.98 hints at liquidity constraints
- Unfavorable price to book ratio at 5.43 may imply overvaluation
- Negative dividend yield at 0% shows no income return
- Moderate debt levels and interest coverage suggest cautious leverage
CoreWeave’s financial profile reveals high profitability on equity but struggles with liquidity and capital costs, challenging its operational stability. Corpay balances profitability and global diversification but faces liquidity and valuation pressures, affecting financial flexibility and investor perception.
The Moat Duel: Analyzing Competitive Defensibility
A structural moat is the only reliable barrier protecting long-term profits from relentless competition erosion:
CoreWeave, Inc. Class A Common Stock: Specialized Infrastructure Moat
CoreWeave’s moat derives from its tailored GPU and AI compute infrastructure. Its high gross margins reflect deep tech expertise, but negative EBIT signals operational challenges. Expansion in GenAI could either reinforce or strain this moat in 2026.
Corpay, Inc.: Payment Network and Scale Moat
Corpay’s competitive edge lies in its broad payment network and scale across multiple geographies. It delivers strong EBIT and net margins, creating value despite a slight ROIC decline. Growth in cross-border and corporate payments offers runway for deeper market penetration.
Specialized Compute vs. Payment Network Scale
Corpay sustains a wider moat with consistent value creation and margin robustness. CoreWeave shows promise but currently destroys value, making Corpay better positioned to defend and expand its market share in 2026.
Which stock offers better returns?
The past year shows stark contrasts in price momentum, with CoreWeave’s shares surging dramatically while Corpay’s growth remains moderate yet steady.
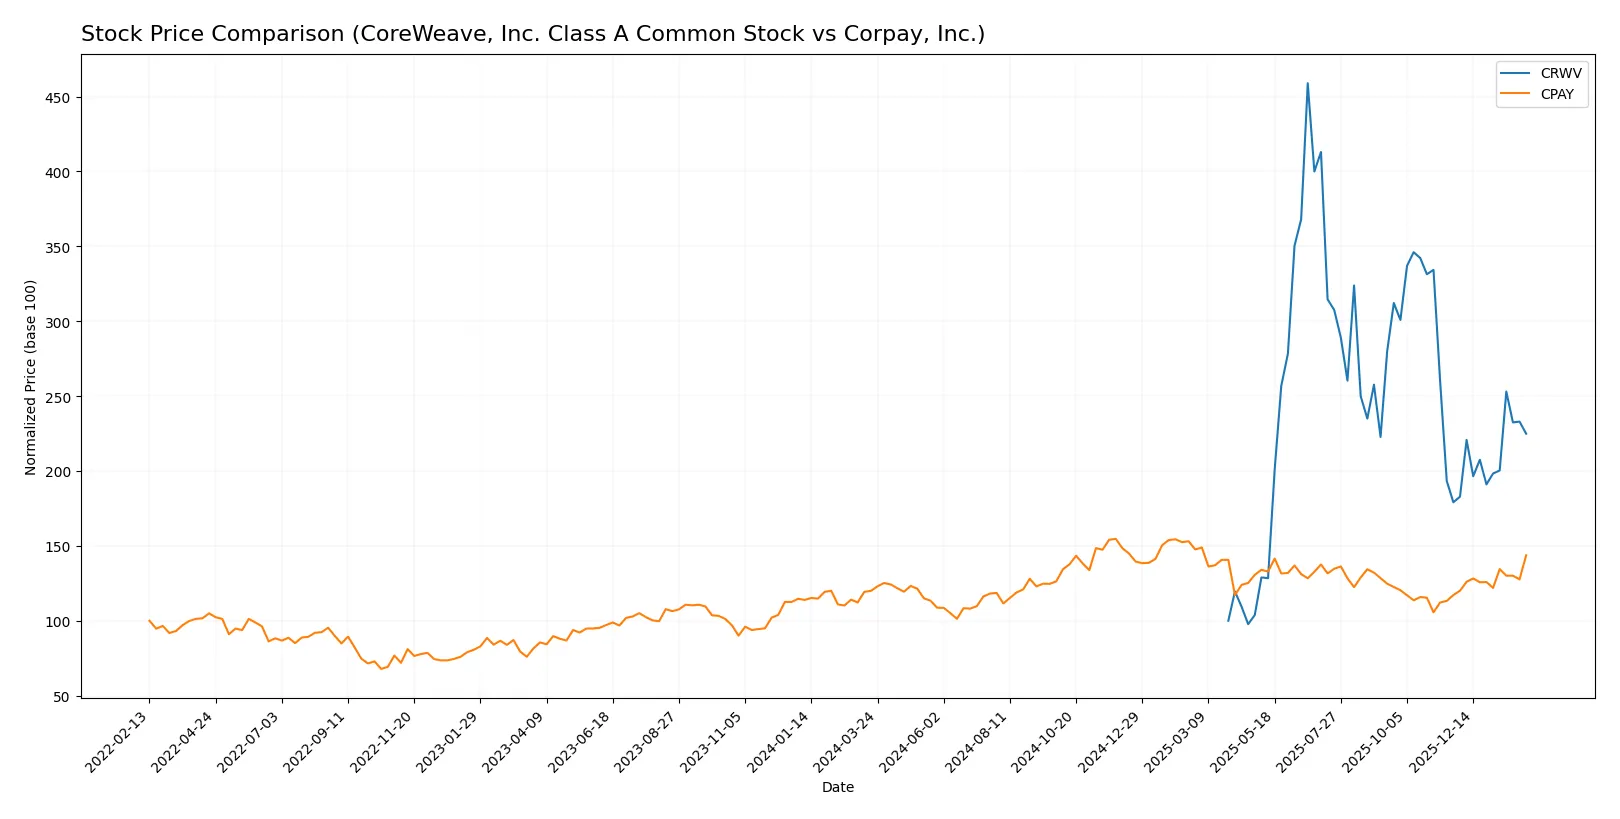
Trend Comparison
CoreWeave’s stock rose 125% over the past 12 months, signaling a strong bullish trend with accelerating momentum and a high volatility of 34.56. Prices ranged from 39.09 to 183.58.
Corpay’s stock increased 19.8% over the same period, also bullish with acceleration but lower volatility at 31.25. The price moved between 249.66 and 381.18, showing steadier gains.
CoreWeave outperformed Corpay significantly, delivering the highest market return with a more pronounced upward acceleration in price.
Target Prices
Analysts provide a bullish consensus for CoreWeave and Corpay, reflecting growth potential in infrastructure software.
| Company | Target Low | Target High | Consensus |
|---|---|---|---|
| CoreWeave, Inc. Class A Common Stock | 84 | 175 | 120.73 |
| Corpay, Inc. | 300 | 390 | 359.33 |
CoreWeave’s consensus target of 120.73 suggests a 34% upside from the current 89.95 price. Corpay’s consensus target of 359.33 aligns closely with its current 354.19 price, indicating limited near-term upside.
How do institutions grade them?
Here is a summary of recent institutional grades for CoreWeave, Inc. Class A Common Stock and Corpay, Inc.:
CoreWeave, Inc. Class A Common Stock Grades
The following table shows recent grade updates from well-known financial institutions:
| Grading Company | Action | New Grade | Date |
|---|---|---|---|
| Macquarie | Maintain | Neutral | 2026-01-27 |
| Deutsche Bank | Upgrade | Buy | 2026-01-27 |
| Mizuho | Maintain | Neutral | 2026-01-27 |
| DA Davidson | Upgrade | Buy | 2026-01-26 |
| Needham | Maintain | Hold | 2026-01-26 |
| Barclays | Maintain | Equal Weight | 2026-01-12 |
| Wells Fargo | Maintain | Overweight | 2026-01-08 |
| DA Davidson | Upgrade | Neutral | 2026-01-05 |
| Jefferies | Maintain | Buy | 2026-01-05 |
| Goldman Sachs | Maintain | Neutral | 2025-11-17 |
Corpay, Inc. Grades
Recent grades from recognized institutions are listed below:
| Grading Company | Action | New Grade | Date |
|---|---|---|---|
| Mizuho | Maintain | Neutral | 2026-02-06 |
| JP Morgan | Maintain | Overweight | 2026-02-05 |
| RBC Capital | Maintain | Sector Perform | 2026-02-05 |
| Morgan Stanley | Maintain | Overweight | 2026-02-05 |
| Morgan Stanley | Upgrade | Overweight | 2026-01-26 |
| Oppenheimer | Maintain | Outperform | 2026-01-12 |
| Oppenheimer | Upgrade | Outperform | 2025-12-05 |
| UBS | Maintain | Neutral | 2025-11-06 |
| RBC Capital | Maintain | Sector Perform | 2025-11-06 |
| JP Morgan | Maintain | Overweight | 2025-11-06 |
Which company has the best grades?
Corpay, Inc. consistently receives stronger grades, such as multiple Overweight and Outperform ratings. CoreWeave’s grades skew Neutral to Buy with some Hold ratings. Investors may interpret Corpay’s better grades as greater confidence from analysts.

Don’t Let Luck Decide Your Entry Point
Optimize your entry points with our advanced ProRealTime indicators. You’ll get efficient buy signals with precise price targets for maximum performance. Start outperforming now!
Risks specific to each company
The following categories identify the critical pressure points and systemic threats facing both firms in the 2026 market environment:
1. Market & Competition
CoreWeave, Inc. Class A Common Stock (CRWV)
- Faces intense competition in cloud infrastructure with rapid tech evolution and high beta risk (21.65).
Corpay, Inc. (CPAY)
- Competes in payments with moderate beta (0.81), benefiting from diversified services and established client base.
2. Capital Structure & Debt
CRWV
- High debt-to-assets ratio (59.56%) signals leveraged risk; poor interest coverage (-1.06) threatens financial stability.
CPAY
- Moderate leverage (37.86% debt-to-assets) with neutral interest coverage (4.83), but debt-to-equity is still unfavorable.
3. Stock Volatility
CRWV
- Extremely volatile stock, beta at 21.65, causing large price swings and high investor risk.
CPAY
- Relatively stable stock with beta of 0.81, offering lower volatility in line with sector norms.
4. Regulatory & Legal
CRWV
- Emerging tech sector faces evolving regulations on AI and cloud security, increasing compliance costs.
CPAY
- Payment processing is heavily regulated globally; exposure to financial compliance risk in multiple jurisdictions.
5. Supply Chain & Operations
CRWV
- Relies on specialized hardware and data centers, vulnerable to supply disruptions and rising costs.
CPAY
- Operations depend on global payment networks and service providers, exposed to third-party operational risks.
6. ESG & Climate Transition
CRWV
- High energy usage in data centers raises ESG concerns; transition to greener tech crucial.
CPAY
- Faces pressure to reduce carbon footprint in fleet and payment operations; ESG initiatives underway.
7. Geopolitical Exposure
CRWV
- Primarily US-focused, limited direct geopolitical risk but sensitive to US-China tech tensions.
CPAY
- Operates internationally, exposed to currency fluctuations, trade policies, and geopolitical instability.
Which company shows a better risk-adjusted profile?
Corpay’s manageable leverage, diversified global footprint, and stable stock volatility offer a stronger risk-adjusted profile. CoreWeave’s extremely high beta, poor liquidity ratios, and distress-zone scores expose it to elevated financial and operational risks. CoreWeave’s biggest risk is its precarious capital structure and liquidity. Corpay’s principal concern lies in regulatory and geopolitical complexities. This contrast highlights Corpay as the more prudent choice amid 2026 market uncertainties.
Final Verdict: Which stock to choose?
CoreWeave’s superpower lies in its rapid revenue growth and bullish price momentum, signaling strong market interest. However, its weak liquidity and value destruction highlight a critical point of vigilance. It fits an aggressive growth portfolio willing to tolerate operational volatility for potential breakout gains.
Corpay’s strategic moat is its consistent value creation with solid operating margins and a decent moat, despite a slightly declining ROIC trend. It offers better financial stability and moderate growth, making it suitable for GARP investors seeking a balance of growth and reasonable risk.
If you prioritize high-growth opportunities and can handle financial instability, CoreWeave could be compelling due to its explosive top-line expansion. However, if you seek steady value creation with more financial resilience, Corpay outshines as a more stable choice, though it commands a premium valuation. Both demand careful risk assessment aligned with your investment profile.
Disclaimer: Investment carries a risk of loss of initial capital. The past performance is not a reliable indicator of future results. Be sure to understand risks before making an investment decision.
Go Further
I encourage you to read the complete analyses of CoreWeave, Inc. Class A Common Stock and Corpay, Inc. to enhance your investment decisions: