Home > Comparison > Industrials > CPRT vs ORLY
The strategic rivalry between Copart, Inc. and O’Reilly Automotive, Inc. shapes the evolving landscape of the automotive services sector. Copart operates as a capital-light, tech-driven vehicle remarketing platform within Industrials, whereas O’Reilly Automotive leads as a vast consumer cyclical retailer of aftermarket auto parts. This analysis contrasts their distinct models and growth trajectories to identify which offers a superior risk-adjusted return for a diversified portfolio in today’s market environment.

Table of contents
Companies Overview
Copart, Inc. and O’Reilly Automotive, Inc. both hold pivotal roles in the automotive sector, shaping aftermarket services and vehicle remarketing.
Copart, Inc.: Leader in Online Vehicle Auctions
Copart dominates the specialty business services market by providing online auctions and vehicle remarketing globally. Its core revenue stems from digital vehicle sales using proprietary auction technology. In 2026, Copart continues to innovate with tools like IntelliSeller and Copart 360, enhancing the efficiency and transparency of vehicle processing.
O’Reilly Automotive, Inc.: Premier Auto Parts Retailer
O’Reilly Automotive stands as a major retailer in the auto parts industry, generating sales through 5,784 stores across the US and Mexico. The company focuses on supplying new and remanufactured parts alongside professional services. Its 2026 strategy emphasizes broadening its product range and bolstering service programs to meet both DIY and professional customer demands.
Strategic Collision: Similarities & Divergences
Both companies serve the automotive aftermarket but diverge sharply in approach. Copart operates a digital auction platform targeting wholesale and salvage vehicles, while O’Reilly runs a vast retail network emphasizing physical parts sales and services. Their competitive battleground is the automotive aftermarket, yet their distinct models appeal to different customer bases. Copart offers a tech-driven growth profile; O’Reilly emphasizes scale and service breadth.
Income Statement Comparison
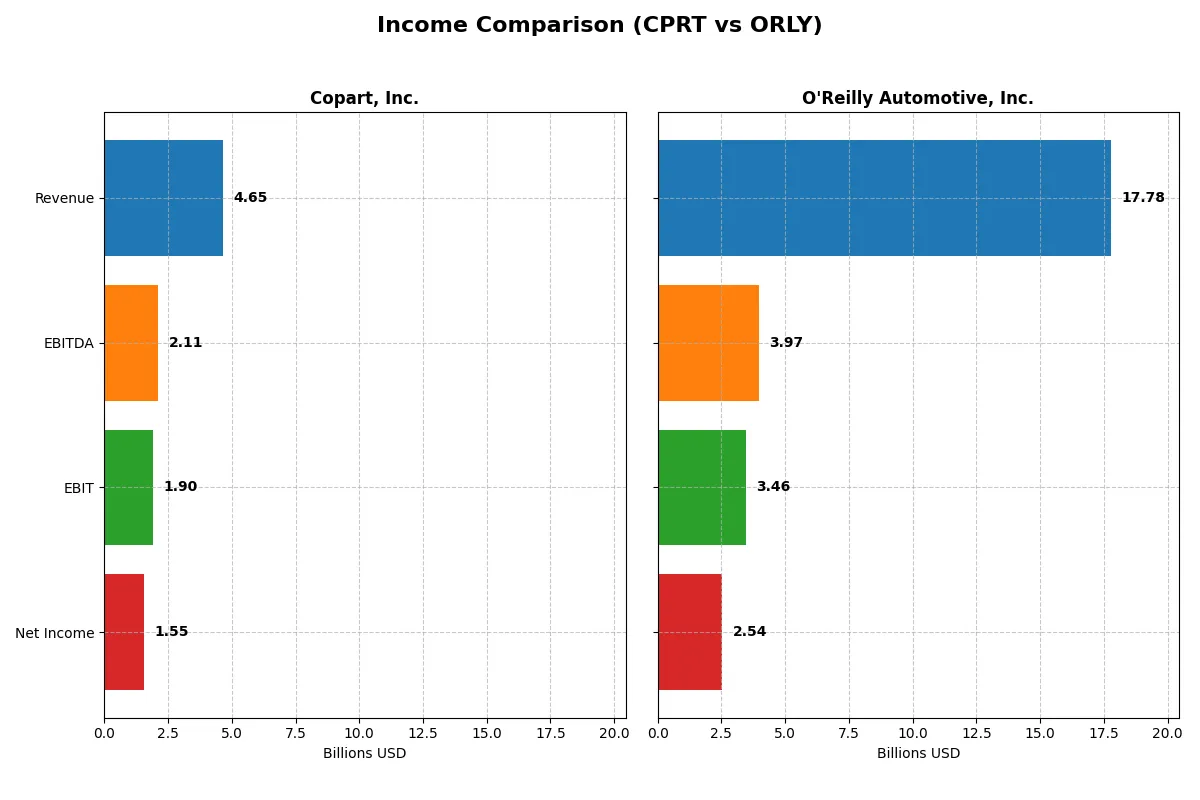
This data dissects the core profitability and scalability of both corporate engines to reveal who dominates the bottom line:
| Metric | Copart, Inc. (CPRT) | O’Reilly Automotive, Inc. (ORLY) |
|---|---|---|
| Revenue | 4.65B | 17.78B |
| Cost of Revenue | 2.55B | 8.61B |
| Operating Expenses | 403M | 5.71B |
| Gross Profit | 2.10B | 9.17B |
| EBITDA | 2.11B | 3.97B |
| EBIT | 1.90B | 3.46B |
| Interest Expense | 0 | 235M |
| Net Income | 1.55B | 2.54B |
| EPS | 1.61 | 2.98 |
| Fiscal Year | 2025 | 2025 |
Income Statement Analysis: The Bottom-Line Duel
The upcoming income statement comparison reveals which company runs a more efficient and profitable corporate engine through revenue growth, margins, and net income trends.
Copart, Inc. Analysis
Copart’s revenue surged from 2.7B in 2021 to 4.6B in 2025, with net income rising from 936M to 1.55B. Its gross margin holds strong around 45%, while net margins remain robust above 33%. The 2025 year shows accelerating EBIT growth of 20.6%, signaling improving operational efficiency despite a slight dip in net margin overall.
O’Reilly Automotive, Inc. Analysis
O’Reilly’s revenue climbed from 13.3B in 2021 to nearly 17.8B in 2025, with net income increasing from 2.16B to 2.54B. Gross margin leads the pack at 51.6%, yet net margin stands at a lower 14.3%. The latest year reflects steady EBIT growth near 6%, but net margin contraction suggests rising expenses pressure profitability.
Margin Strength vs. Scale and Growth
Copart excels with higher net margins and faster EBIT growth, showing superior profitability and operational leverage. O’Reilly impresses with greater revenue scale and higher gross margins but weaker net margin trends. For investors prioritizing margin expansion and bottom-line efficiency, Copart’s profile appears more compelling.
Financial Ratios Comparison
These vital ratios act as a diagnostic tool to expose the underlying fiscal health, valuation premiums, and capital efficiency of the companies compared:
| Ratios | Copart, Inc. (CPRT) | O’Reilly Automotive, Inc. (ORLY) |
|---|---|---|
| ROE | 16.9% | 0% |
| ROIC | 14.7% | 0% |
| P/E | 28.2 | 30.6 |
| P/B | 4.8 | 0 |
| Current Ratio | 8.25 | 0 |
| Quick Ratio | 8.19 | 0 |
| D/E | 0.011 | 0 |
| Debt-to-Assets | 1.03% | 0% |
| Interest Coverage | 0 | 14.7 |
| Asset Turnover | 0.46 | 0 |
| Fixed Asset Turnover | 1.26 | 0 |
| Payout ratio | 0% | 0% |
| Dividend yield | 0% | 0% |
| Fiscal Year | 2025 | 2025 |
Efficiency & Valuation Duel: The Vital Signs
Financial ratios act as a company’s DNA, revealing hidden risks and operational strengths that numbers alone cannot expose.
Copart, Inc.
Copart displays strong profitability with a 16.9% ROE and a robust 33.4% net margin, signaling efficient operations. However, its valuation appears stretched with a P/E of 28.2 and a P/B of 4.76, which may pressure future returns. The company retains earnings for growth, offering no dividend yield, reflecting a reinvestment strategy focused on scaling.
O’Reilly Automotive, Inc.
O’Reilly shows moderate profitability with a 14.3% net margin but a troubling zero ROE and ROIC, indicating challenges in generating shareholder value. Its P/E ratio of 30.6 suggests an expensive stock, while a zero dividend yield points to limited direct returns. Elevated debt metrics and weak liquidity ratios raise caution on financial stability.
Premium Valuation vs. Operational Safety
Copart leads with stronger profitability and a more balanced capital structure despite a stretched valuation. O’Reilly’s valuation is high, but operational metrics raise concerns. Copart offers a better risk-reward balance, fitting investors prioritizing operational efficiency over speculative growth.
Which one offers the Superior Shareholder Reward?
Copart (CPRT) and O’Reilly Automotive (ORLY) both forgo dividends, choosing reinvestment and buybacks to reward shareholders. CPRT shines with a pristine balance sheet, zero debt, and a high free cash flow yield near 4%. It exercises modest buybacks, fueling sustainable growth. ORLY, however, carries heavy debt and financial leverage, limiting buyback flexibility despite stronger free cash flow per share (1.87 vs. 1.27). Its reinvestment fuels expansion but raises risk. I favor Copart’s conservative capital allocation and stable cash returns for superior, sustainable total shareholder reward in 2026.
Comparative Score Analysis: The Strategic Profile
The radar chart reveals the fundamental DNA and trade-offs of Copart, Inc. and O’Reilly Automotive, Inc., highlighting their financial strengths and valuation challenges:
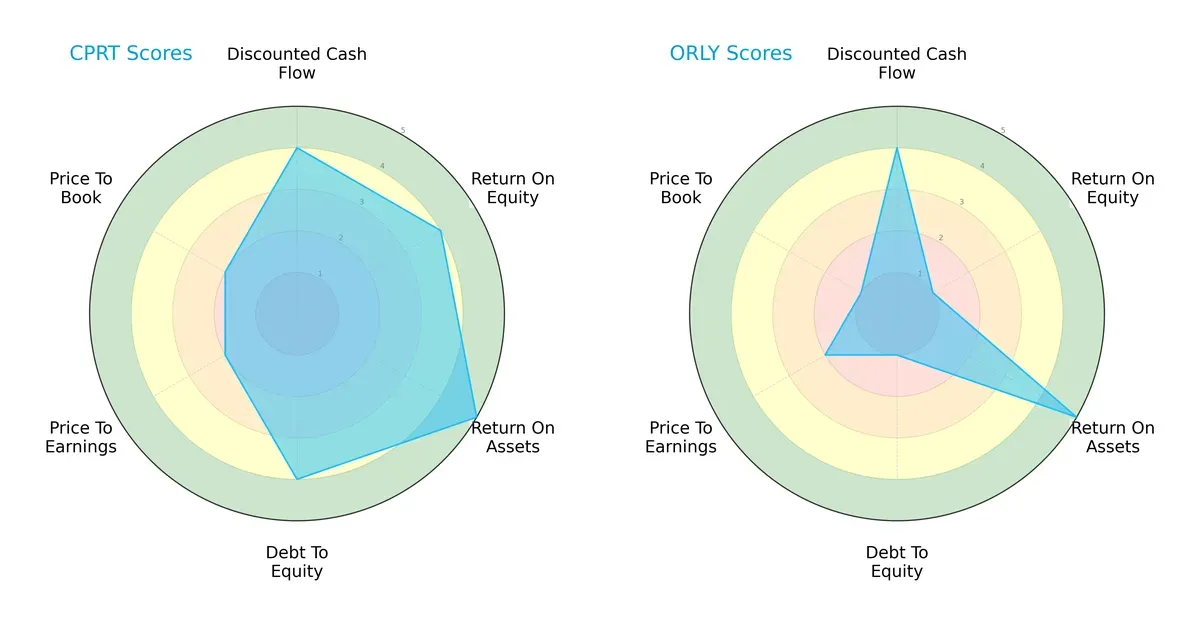
Copart shows a more balanced profile with strong scores in ROE (4), ROA (5), and Debt/Equity (4), indicating efficient asset use and solid financial stability. O’Reilly matches Copart’s ROA (5) but lags significantly in ROE (1) and Debt/Equity (1), signaling weaker profitability and higher leverage risk. Both firms carry unfavorable valuation scores, but Copart’s overall financial health stands out.
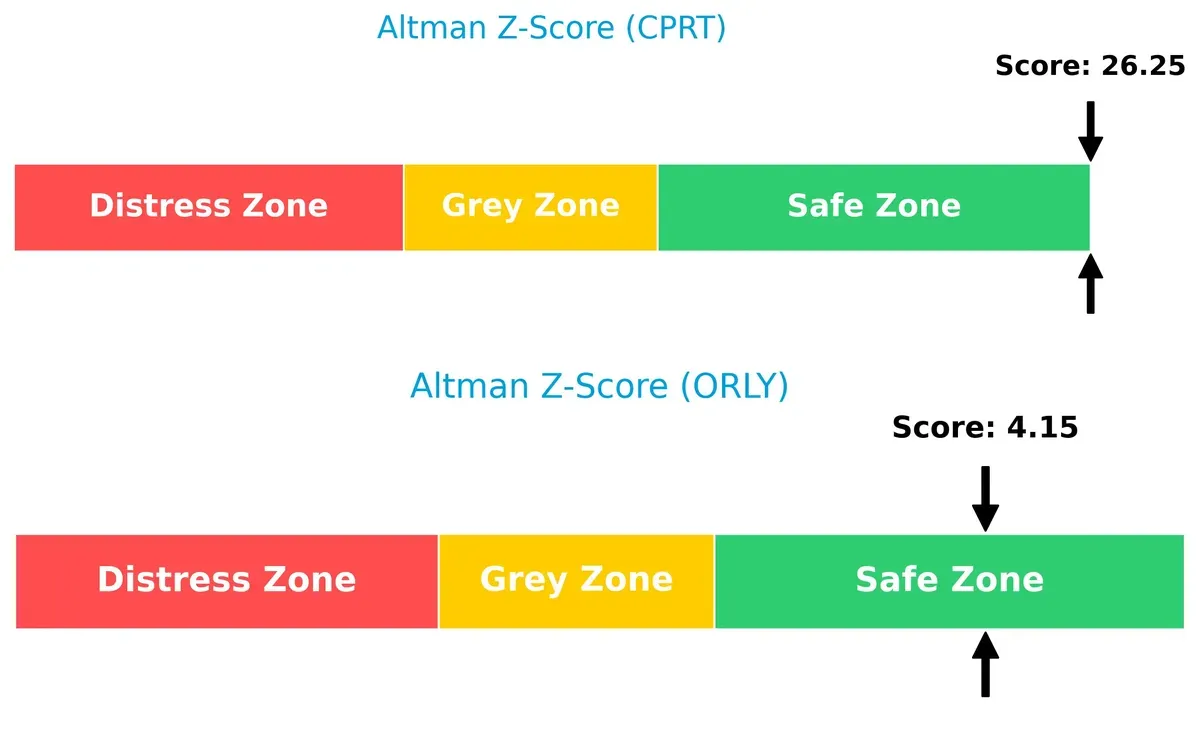
Bankruptcy Risk: Solvency Showdown
Copart’s Altman Z-Score of 26.25 vastly exceeds O’Reilly’s 4.15, placing both safely above distress zones but showing Copart’s much stronger buffer against financial distress in this cycle:
Financial Health: Quality of Operations
O’Reilly’s Piotroski F-Score of 7 edges out Copart’s 6, suggesting slightly stronger internal financial metrics and operational quality. Neither company shows critical red flags, but Copart’s average score calls for monitoring:

How are the two companies positioned?
This section dissects the operational DNA of Copart and O’Reilly by comparing their revenue distribution and internal strengths and weaknesses. The final objective is to confront their economic moats to identify which offers the most resilient, sustainable competitive advantage today.
Revenue Segmentation: The Strategic Mix
The following visual comparison dissects how both firms diversify their income streams and where their primary sector bets lie:
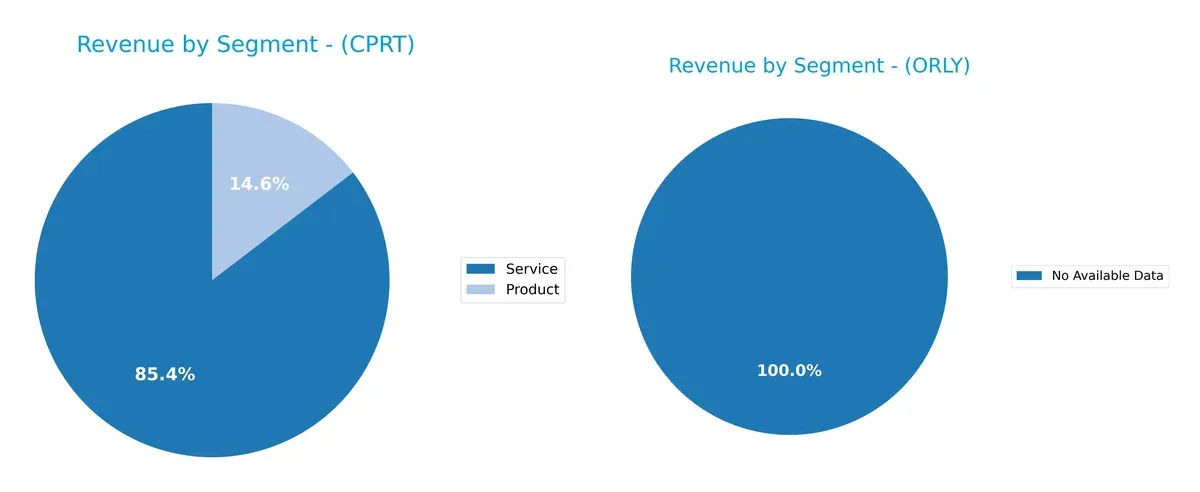
Copart, Inc. anchors revenue with Services, generating $3.97B in 2025, dwarfing Products at $678M. This heavy skew signals a service-centric model, likely tied to auction and vehicle remarketing infrastructure. O’Reilly Automotive, Inc. lacks available segmentation data, preventing a direct mix comparison. Copart’s reliance on a dominant Services segment could imply concentration risk but also strong ecosystem lock-in, given its growing service revenues outpace product sales consistently.
Strengths and Weaknesses Comparison
This table compares the Strengths and Weaknesses of Copart, Inc. and O’Reilly Automotive, Inc.:
CPRT Strengths
- Strong profitability with 33.41% net margin
- High ROE (16.9%) and ROIC (14.7%) above WACC
- Extremely low debt levels and excellent interest coverage
- Significant revenue diversification between product and service segments
- Global presence with substantial U.S. and international sales
ORLY Strengths
- Positive net margin at 14.27%
- Favorable PB ratio indicates undervaluation relative to book value
- Low debt-to-assets ratio and strong interest coverage
- Established profitability in core U.S. markets
CPRT Weaknesses
- Overvalued based on PE (28.19) and PB (4.76) ratios
- Very high current ratio (8.25) may indicate inefficient asset use
- Low asset turnover (0.46) signals lower operational efficiency
- Zero dividend yield limits income appeal
ORLY Weaknesses
- Zero ROE and ROIC reflect weak capital efficiency
- Unavailable WACC clouds cost of capital assessment
- Unfavorable PE ratio (30.6) and poor liquidity ratios (current and quick ratio at 0)
- Lack of geographic and product diversification data
Copart exhibits superior profitability and financial health with broad revenue sources and global reach. O’Reilly shows signs of valuation and efficiency challenges, with limited data on diversification. Each company’s financial profile suggests distinct strategic focuses and operational risks.
The Moat Duel: Analyzing Competitive Defensibility
A structural moat is the only safeguard preserving long-term profits from competitive erosion. Here’s how Copart and O’Reilly stack up:
Copart, Inc.: Network Effects Powerhouse
Copart’s moat stems from strong network effects in vehicle remarketing. Its 33% net margin and 5.8% ROIC-WACC spread show efficient capital use. International expansion in 2026 could deepen this advantage.
O’Reilly Automotive, Inc.: Scale and Brand Loyalty
O’Reilly relies on scale and brand loyalty, reflected in its 52% gross margin but lower 14% net margin. Despite steady revenue growth, its declining ROIC signals challenges sustaining returns amid market pressures.
Verdict: Network Effects vs. Brand Loyalty Scale
Copart’s network-driven moat is wider and shows stronger value creation than O’Reilly’s scale-based positioning. Copart is better equipped to defend market share through technological innovation and global reach.
Which stock offers better returns?
Over the past 12 months, Copart, Inc. experienced a sharp price decline while O’Reilly Automotive, Inc. showed solid gains followed by a recent pullback.
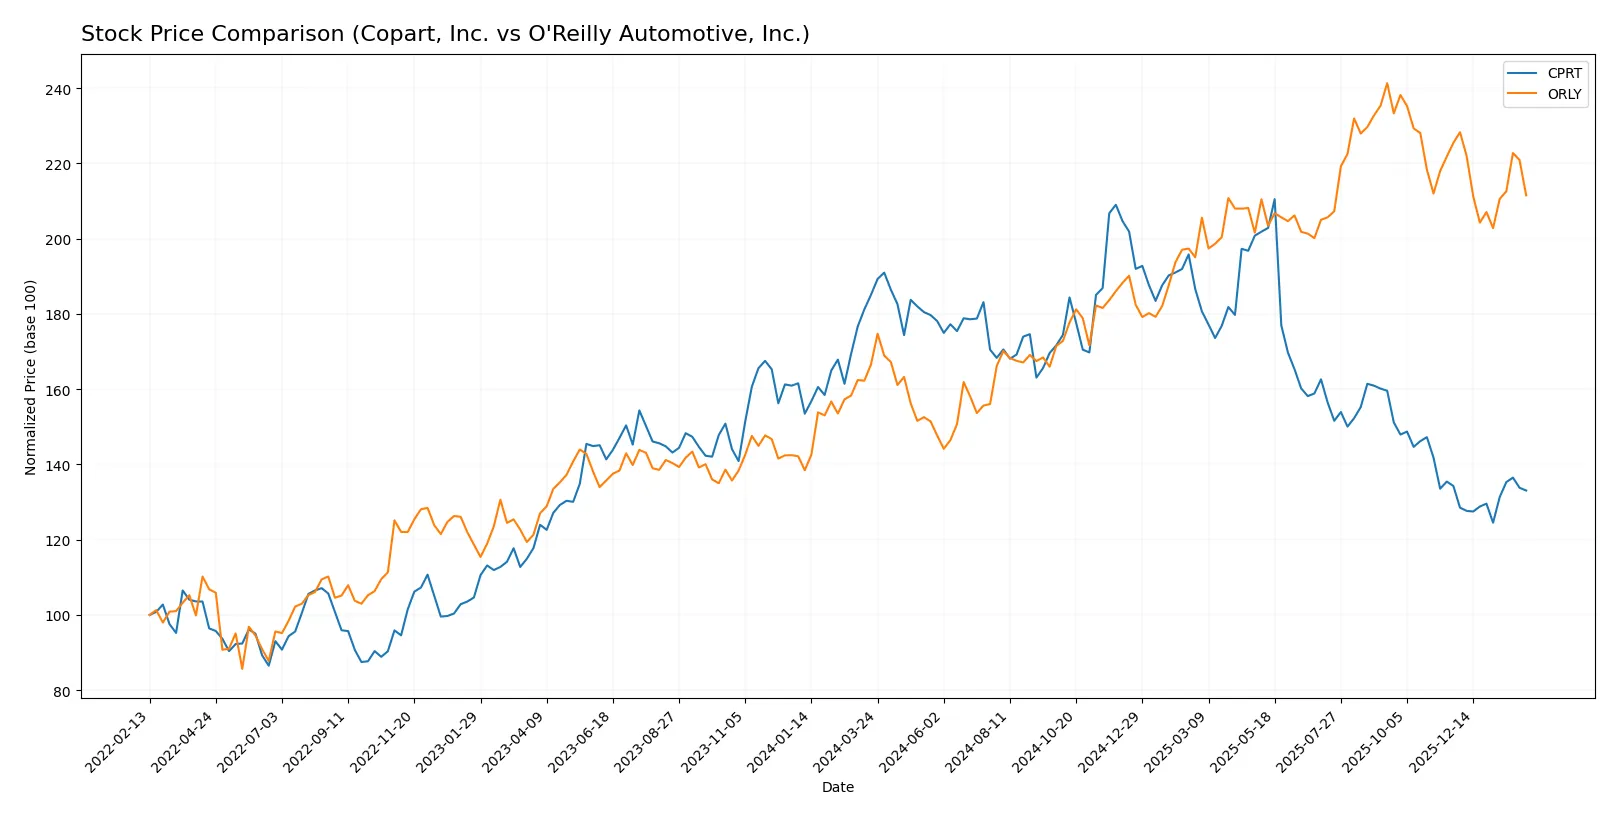
Trend Comparison
Copart, Inc. shows a bearish trend with a -28.1% price change over 12 months, accelerating downward from a high of 63.84 to a low near 37.77.
O’Reilly Automotive, Inc. posted a bullish 26.96% gain over the year but faces a recent deceleration, dropping 6.18% in the last 2.5 months from a peak of 107.5.
O’Reilly Automotive, Inc. has delivered stronger market performance than Copart, Inc., despite recent volatility and short-term weakness.
Target Prices
Analysts present a mixed but generally optimistic target consensus for these stocks.
| Company | Target Low | Target High | Consensus |
|---|---|---|---|
| Copart, Inc. | 33 | 62 | 49 |
| O’Reilly Automotive, Inc. | 91 | 121 | 108.77 |
Copart’s target consensus at $49 suggests upside from the current $40.36 price, indicating moderate growth expectations. O’Reilly’s consensus near $109 significantly exceeds its $94.22 price, reflecting stronger analyst confidence in its market position.

Don’t Let Luck Decide Your Entry Point
Optimize your entry points with our advanced ProRealTime indicators. You’ll get efficient buy signals with precise price targets for maximum performance. Start outperforming now!
How do institutions grade them?
Copart, Inc. Grades
The table below lists recent grades from major financial institutions for Copart, Inc.:
| Grading Company | Action | New Grade | Date |
|---|---|---|---|
| JP Morgan | Maintain | Neutral | 2025-11-24 |
| Barclays | Maintain | Underweight | 2025-11-21 |
| Baird | Maintain | Outperform | 2025-11-21 |
| Stephens & Co. | Maintain | Equal Weight | 2025-09-05 |
| HSBC | Upgrade | Buy | 2025-09-04 |
O’Reilly Automotive, Inc. Grades
Below are the latest institutional grades for O’Reilly Automotive, Inc.:
| Grading Company | Action | New Grade | Date |
|---|---|---|---|
| DA Davidson | Maintain | Buy | 2026-02-06 |
| JP Morgan | Maintain | Overweight | 2026-02-06 |
| Truist Securities | Maintain | Buy | 2026-02-06 |
| RBC Capital | Maintain | Outperform | 2026-02-06 |
| Mizuho | Maintain | Outperform | 2026-02-06 |
Which company has the best grades?
O’Reilly Automotive consistently receives stronger grades such as Buy and Outperform from reputable firms. Copart’s ratings are more mixed, including Neutral and Underweight. Investors may interpret O’Reilly’s higher consensus grades as a signal of greater confidence from analysts.
Risks specific to each company
In the 2026 market environment, these categories reveal the critical pressure points and systemic threats facing both Copart, Inc. and O’Reilly Automotive, Inc.:
1. Market & Competition
Copart, Inc.
- Faces intense competition in global vehicle remarketing; innovation in online auctions is key to sustaining moat.
O’Reilly Automotive, Inc.
- Competes in a fragmented auto-parts retail sector; scale and service diversification drive competitive edge.
2. Capital Structure & Debt
Copart, Inc.
- Extremely low debt levels (D/E 0.01) reduce financial risk and interest burden to near zero.
O’Reilly Automotive, Inc.
- Debt metrics unavailable or minimal; however, weak coverage ratios suggest potential liquidity concerns.
3. Stock Volatility
Copart, Inc.
- Beta 1.08 indicates volatility slightly above market average, reflecting sensitivity to cyclical shifts.
O’Reilly Automotive, Inc.
- Beta 0.62 shows defensive qualities with lower volatility, appealing to risk-averse investors.
4. Regulatory & Legal
Copart, Inc.
- Operates in multiple jurisdictions, raising exposure to evolving vehicle disposal regulations.
O’Reilly Automotive, Inc.
- Subject to automotive aftermarket regulations and environmental compliance across U.S. and Mexico operations.
5. Supply Chain & Operations
Copart, Inc.
- Relies on technology infrastructure for auctions; disruptions could impair operational efficiency.
O’Reilly Automotive, Inc.
- Extensive retail footprint demands robust logistics; supply chain shocks may affect inventory and sales.
6. ESG & Climate Transition
Copart, Inc.
- Increasing pressure to manage end-of-life vehicle recycling sustainably; ESG initiatives critical for reputation.
O’Reilly Automotive, Inc.
- Faces challenges in waste management and emissions from extensive store network; climate policies impact costs.
7. Geopolitical Exposure
Copart, Inc.
- Global operations in diverse regions expose it to currency, trade, and political risks.
O’Reilly Automotive, Inc.
- Primarily U.S.-focused with some Mexican presence; geopolitical risks are more contained but still present.
Which company shows a better risk-adjusted profile?
Copart’s most impactful risk is market competition amid technological disruption. O’Reilly’s greatest risk lies in its weak capital structure and operational supply chain vulnerabilities. Copart demonstrates a superior risk-adjusted profile, bolstered by its pristine balance sheet and strong global diversification. Its Altman Z-Score of 26.25 signals exceptional financial health, contrasting with O’Reilly’s lower but still safe 4.15. The stark difference in debt-to-equity ratios highlights Copart’s prudent capital allocation, justifying my greater confidence in its resilience.
Final Verdict: Which stock to choose?
Copart, Inc. excels as a cash machine with robust profitability and pristine balance sheet health. Its superpower lies in generating strong returns on invested capital, signaling efficient capital use. A point of vigilance is its stretched current ratio, which could hint at operational nuances. It suits portfolios aiming for aggressive growth and value creation.
O’Reilly Automotive, Inc. commands a strategic moat through its recurring revenue safety and resilient market position. Its financial profile offers more stability than Copart, despite some leverage concerns. This stock aligns well with investors seeking growth at a reasonable price (GARP) and income stability amid market fluctuations.
If you prioritize aggressive growth fueled by efficient capital deployment, Copart outshines due to its superior ROIC relative to WACC and strong earnings growth. However, if you seek a safer growth trajectory with a durable business model, O’Reilly offers better stability and a moat that cushions economic cycles. Each appeals to distinct investor avatars balancing risk and reward.
Disclaimer: Investment carries a risk of loss of initial capital. The past performance is not a reliable indicator of future results. Be sure to understand risks before making an investment decision.
Go Further
I encourage you to read the complete analyses of Copart, Inc. and O’Reilly Automotive, Inc. to enhance your investment decisions: