Home > Comparison > Utilities > GEV vs CEG
The strategic rivalry between GE Vernova Inc. and Constellation Energy Corporation shapes the future of the renewable utilities sector. GE Vernova operates as a diversified energy powerhouse, spanning power generation, wind manufacturing, and electrification solutions. In contrast, Constellation Energy focuses on regional electricity generation with a strong emphasis on nuclear and renewables. This analysis assesses which company’s operational model offers a superior risk-adjusted return for a diversified portfolio.
Table of contents
Companies Overview
GE Vernova Inc. and Constellation Energy Corporation are key players shaping America’s renewable utility landscape.
GE Vernova Inc.: Integrated Renewable Energy Innovator
GE Vernova dominates the renewable utilities sector with a diversified portfolio spanning power, wind, and electrification segments. Its core revenue stems from generating and selling electricity via hydro, gas, nuclear, and steam, alongside manufacturing wind turbine blades and delivering grid solutions. In 2026, the company emphasizes expanding its electrification offerings to capture emerging energy storage and solar markets.
Constellation Energy Corporation: Regional Power Generator
Constellation Energy operates primarily across five U.S. regions, generating electricity from nuclear, wind, solar, natural gas, and hydro assets. Its revenue engine relies on selling electricity and natural gas to utilities, municipalities, and commercial clients. The company’s 2026 focus centers on leveraging its 32,400 MW capacity to optimize regional power delivery and enhance renewable integration.
Strategic Collision: Similarities & Divergences
Both companies champion renewable energy but diverge sharply in scale and business models. GE Vernova pursues a vertically integrated approach, blending manufacturing with electricity sales, while Constellation concentrates on regional power generation and distribution. Their primary battleground lies in competing for U.S. utility contracts and grid modernization projects. Investment-wise, GE Vernova offers broader diversification, whereas Constellation presents a focused regional power play.
Income Statement Comparison
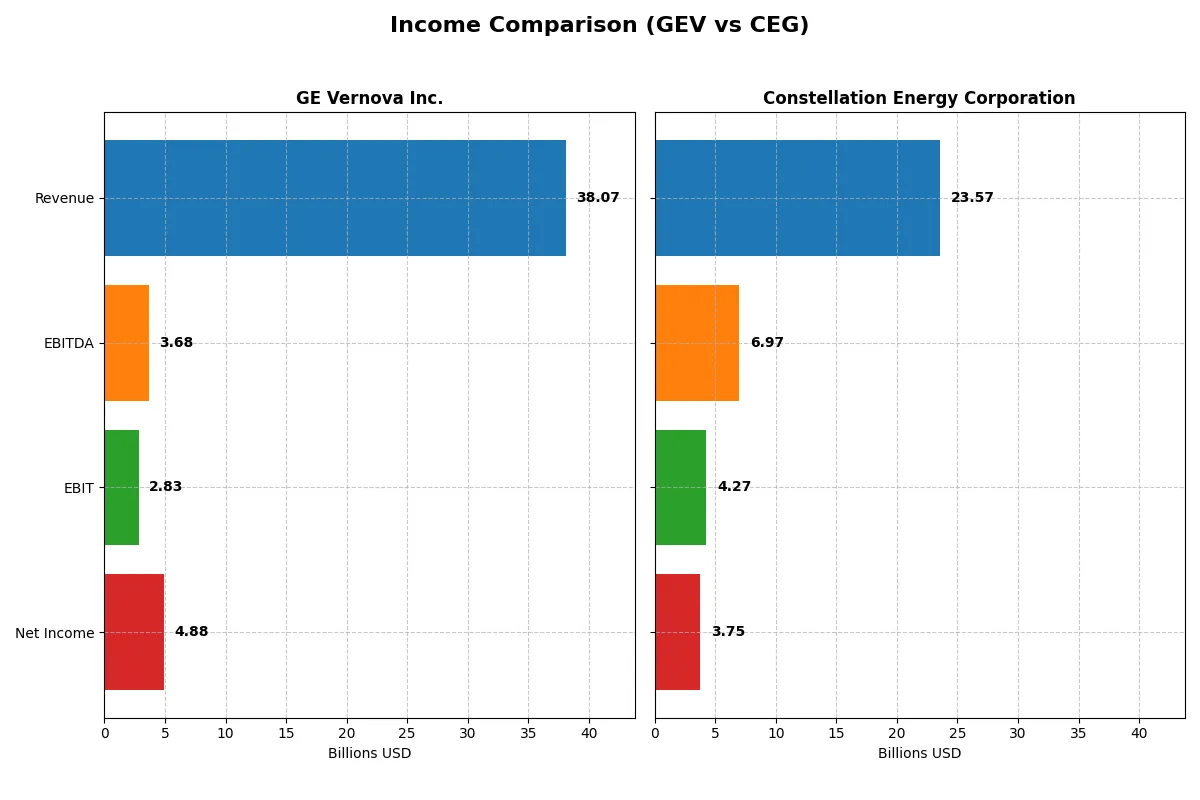
The following data dissects the core profitability and scalability of both corporate engines to reveal who dominates the bottom line:
| Metric | GE Vernova Inc. (GEV) | Constellation Energy Corporation (CEG) |
|---|---|---|
| Revenue | 38B | 23.6B |
| Cost of Revenue | 30.5B | 17.6B |
| Operating Expenses | 6.15B | 1.64B |
| Gross Profit | 7.5B | 6B |
| EBITDA | 3.68B | 6.97B |
| EBIT | 2.83B | 4.27B |
| Interest Expense | 0 | 506M |
| Net Income | 4.88B | 3.75B |
| EPS | 17.92 | 11.9 |
| Fiscal Year | 2025 | 2024 |
Income Statement Analysis: The Bottom-Line Duel
This income statement comparison reveals which company converts revenue into profits with greater efficiency and momentum.
GE Vernova Inc. Analysis
GE Vernova shows a strong revenue increase to $38.1B in 2025, up 9% from 2024, with net income surging to $4.88B. Its gross margin holds steady near 20%, while net margin improves to 12.8%, reflecting enhanced cost control. The sharp net income growth signals accelerating profitability and operational leverage gains.
Constellation Energy Corporation Analysis
Constellation Energy’s revenue declined 5.4% to $23.6B in 2024, yet net income more than doubled to $3.75B. Gross margin at 25.4% and a robust net margin of 15.9% underline strong profitability despite top-line pressure. EBIT growth of 150% highlights improving operational efficiency and margin expansion.
Margin Strength vs. Revenue Growth
GE Vernova leads in revenue growth and net income momentum, demonstrating a powerful earnings recovery. Constellation Energy excels in margin quality and operational efficiency despite a shrinking top line. For investors prioritizing growth, GE Vernova’s trajectory stands out; for margin-focused profiles, Constellation’s profitability offers a compelling appeal.
Financial Ratios Comparison
These vital ratios act as a diagnostic tool to expose the underlying fiscal health, valuation premiums, and capital efficiency of the firms analyzed:
| Ratios | GE Vernova Inc. (GEV) | Constellation Energy Corporation (CEG) |
|---|---|---|
| ROE | 43.7% | 28.5% |
| ROIC | 6.3% | 7.7% |
| P/E | 36.4 | 18.8 |
| P/B | 15.9 | 5.35 |
| Current Ratio | 0.98 | 1.57 |
| Quick Ratio | 0.73 | 1.34 |
| D/E | 0 | 0.64 |
| Debt-to-Assets | 0 | 16.0% |
| Interest Coverage | 0 | 8.6 |
| Asset Turnover | 0.60 | 0.45 |
| Fixed Asset Turnover | 6.34 | 1.11 |
| Payout Ratio | 5.6% | 11.8% |
| Dividend Yield | 0.15% | 0.63% |
| Fiscal Year | 2025 | 2024 |
Efficiency & Valuation Duel: The Vital Signs
Ratios act as the company’s DNA, revealing hidden risks and operational excellence that shape investor confidence and valuation.
GE Vernova Inc.
GEV demonstrates robust profitability with a 44% ROE and a favorable 12.8% net margin, signaling strong shareholder returns. However, its P/E of 36.4 and P/B of 15.9 indicate a stretched valuation. The company pays a minimal 0.15% dividend, opting instead to reinvest in R&D and growth initiatives.
Constellation Energy Corporation
CEG posts a solid 28.5% ROE and a superior 15.9% net margin, reflecting operational efficiency. Its P/E of 18.8 appears more reasonable, though a P/B of 5.35 is somewhat elevated. The firm offers a 0.63% dividend yield but faces moderate debt levels and a favorable liquidity profile.
Valuation Stretch vs. Operational Efficiency
Both companies show slightly favorable overall ratios. GEV’s high ROE contrasts with a stretched valuation, while CEG balances profitability with a more moderate price. Investors seeking growth might lean toward GEV’s reinvestment focus; those prioritizing stability may prefer CEG’s operational safety.
Which one offers the Superior Shareholder Reward?
I see GE Vernova Inc. (GEV) offers a minimal dividend yield of 0.15% with a low payout ratio of 5.6%, focusing on modest dividends supported by strong free cash flow (FCF) coverage of 3.2x. Its recent buyback activity is restrained, signaling cautious capital allocation. Constellation Energy Corporation (CEG) pays a higher dividend yield of 0.63% with a 12% payout ratio, but its free cash flow per share is negative, raising sustainability concerns. CEG also runs more intensive buybacks, adding to shareholder return despite weaker cash flow. I judge GEV’s conservative dividend plus solid FCF and moderate buybacks as a more sustainable model. CEG’s aggressive distributions risk long-term value. For 2026, I favor GEV for superior total shareholder reward given its prudent capital strategy and robust cash flow backing.
Comparative Score Analysis: The Strategic Profile
The radar chart reveals the fundamental DNA and trade-offs of GE Vernova Inc. and Constellation Energy Corporation:
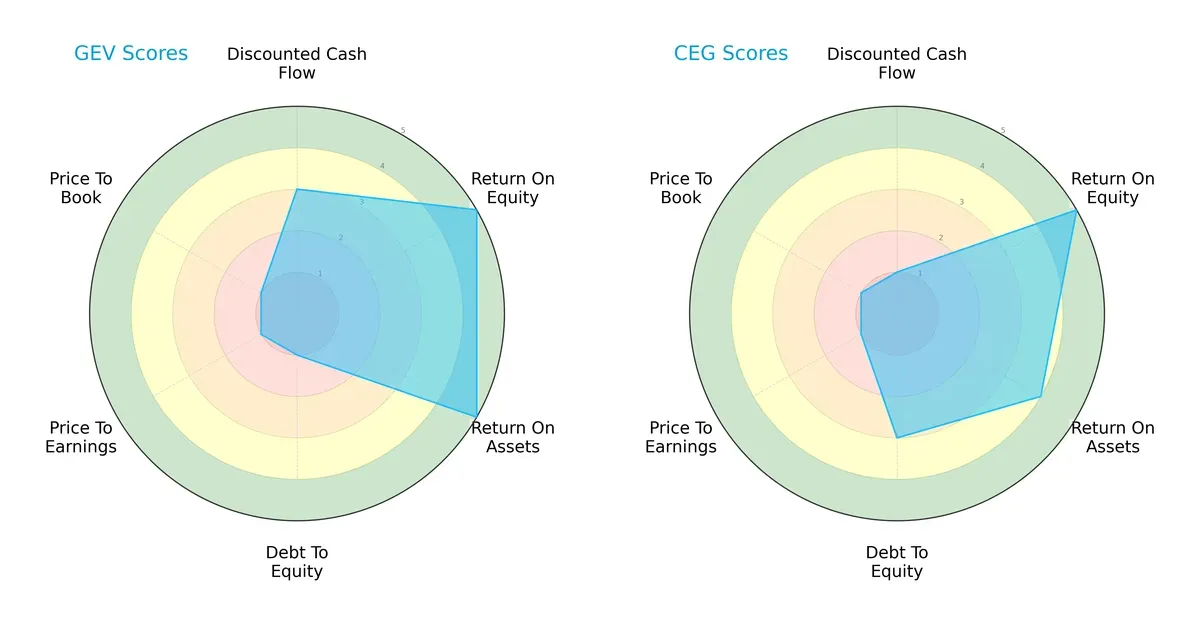
GE Vernova excels in profitability with top ROE and ROA scores (5 each), but its financial leverage and valuation metrics lag significantly, scoring a weak 1 in debt-to-equity and valuation ratios. Constellation Energy shows a more balanced debt profile (score 3) and decent asset returns (ROA 4), yet it struggles on discounted cash flow (score 1). GE Vernova’s strength lies in operational efficiency, while Constellation presents a steadier capital structure. Overall, GE Vernova’s profile is less balanced due to its high leverage and valuation risk.
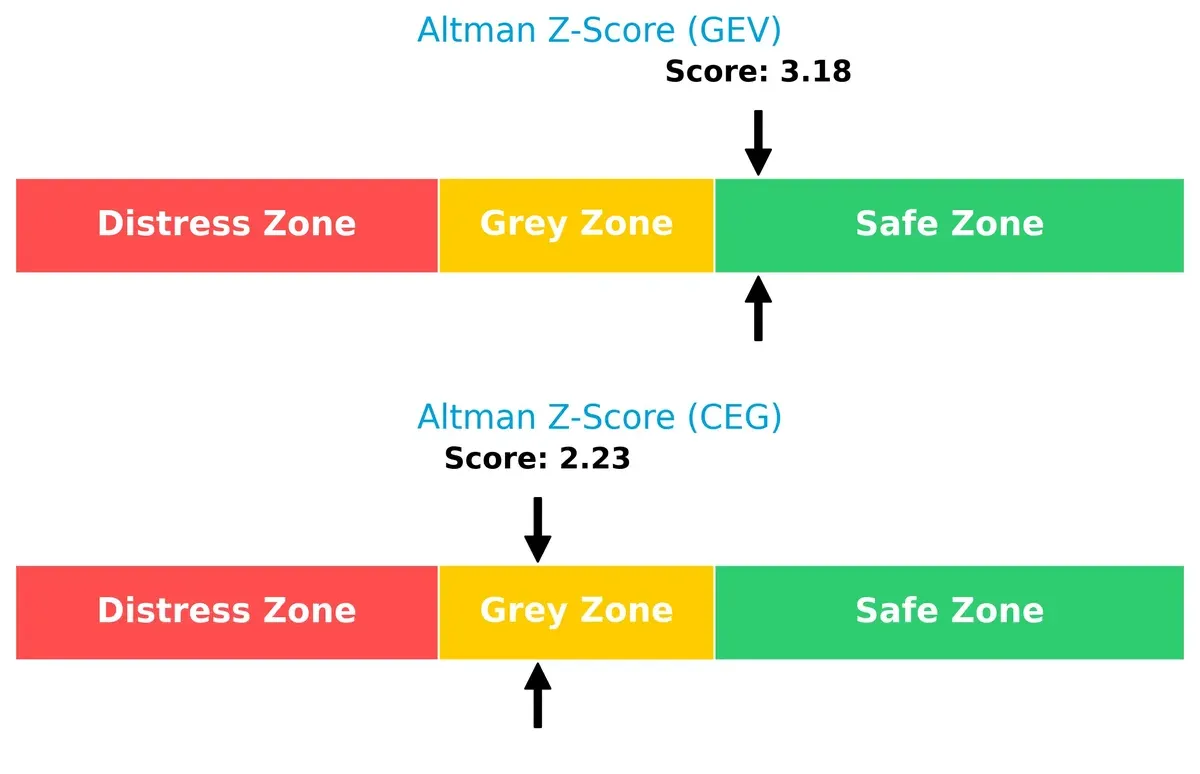
Bankruptcy Risk: Solvency Showdown
GE Vernova’s Altman Z-Score of 3.18 places it firmly in the safe zone, signaling strong solvency and low bankruptcy risk. Constellation Energy’s score of 2.23 situates it in the grey zone, indicating moderate financial distress risk in this cycle:
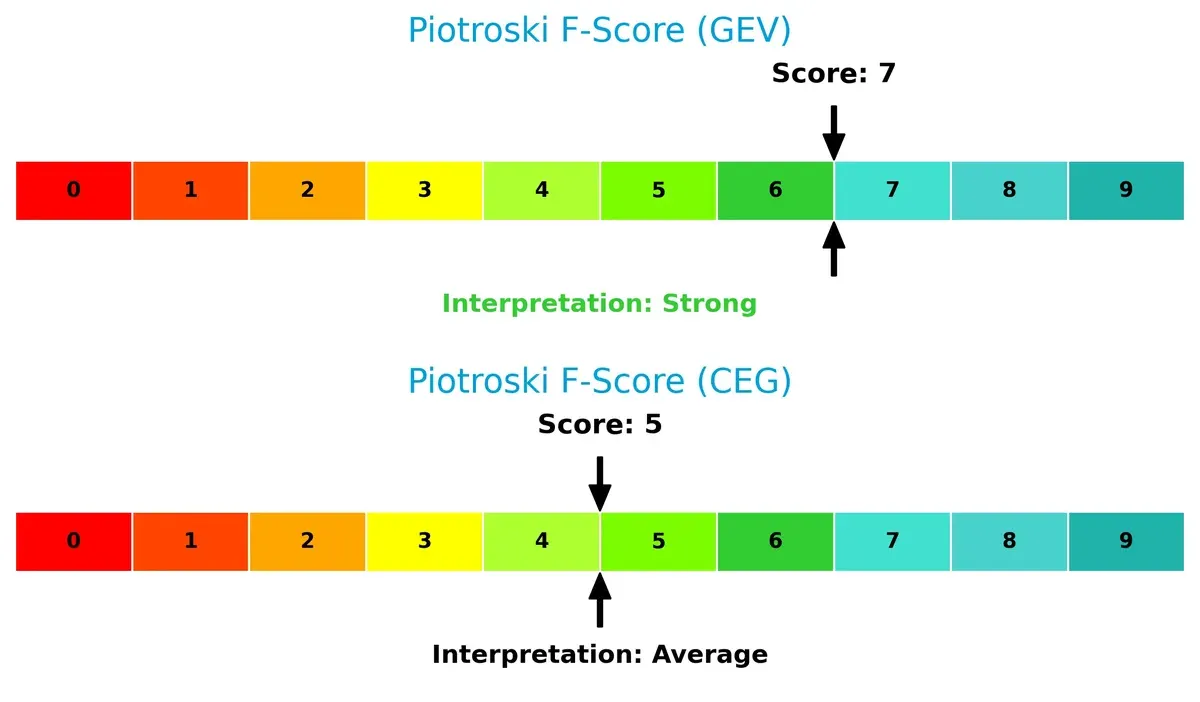
Financial Health: Quality of Operations
GE Vernova’s Piotroski F-Score of 7 signals strong financial health with robust internal metrics. Constellation’s score of 5 is average, suggesting some red flags in profitability or efficiency relative to GE Vernova:
How are the two companies positioned?
This section dissects the operational DNA of GEV and CEG by comparing their revenue distribution and internal dynamics, including strengths and weaknesses. The final goal confronts their economic moats to reveal which model offers the most resilient, sustainable competitive advantage today.
Revenue Segmentation: The Strategic Mix
This comparison dissects how GE Vernova Inc. and Constellation Energy Corporation diversify income streams and where their primary sector bets lie:
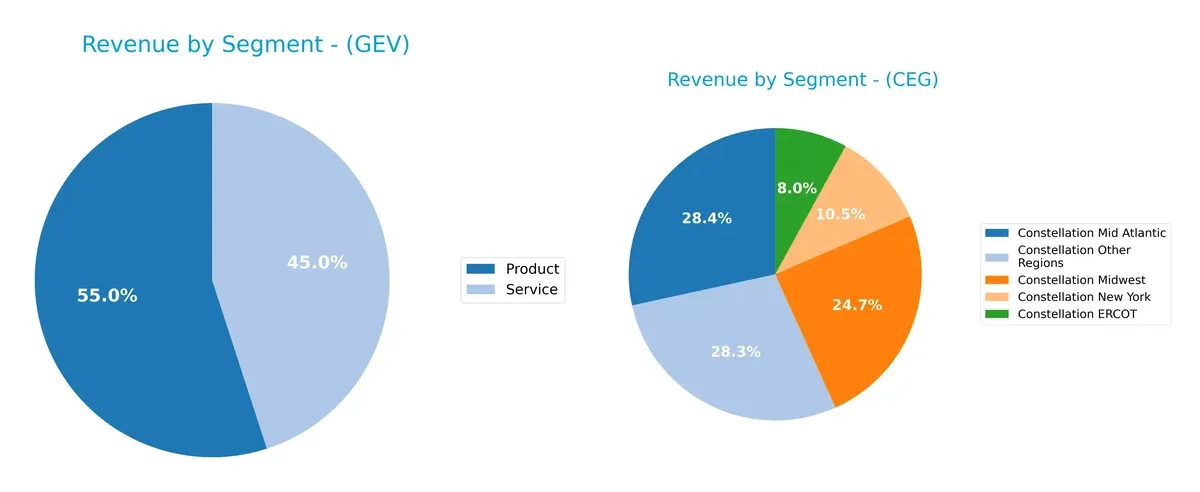
GE Vernova anchors revenue in two broad segments: Products at $20.9B and Services at $17.1B, signaling a balanced but concentrated portfolio. Constellation Energy spreads revenue across multiple regional segments, from $1.55B in ERCOT to $5.52B in Mid Atlantic, showing a geographically diversified model. GE Vernova’s focus on products and services implies operational specialization, while Constellation’s regional mix reduces concentration risk but depends heavily on energy infrastructure stability.
Strengths and Weaknesses Comparison
This table compares the Strengths and Weaknesses of GE Vernova Inc. and Constellation Energy Corporation:
GE Vernova Strengths
- High net margin at 12.83%
- Exceptional ROE at 43.69%
- Zero debt and infinite interest coverage
- Strong fixed asset turnover at 6.34
- Significant global revenue diversification across Americas, Asia, Europe, Middle East, and Africa
Constellation Energy Strengths
- Higher net margin at 15.91%
- Solid ROE at 28.47%
- Favorable liquidity ratios with current ratio 1.57 and quick ratio 1.34
- Diversified regional revenue within multiple U.S. regions
- Favorable debt-to-assets at 15.89% with good interest coverage of 8.44
GE Vernova Weaknesses
- Unfavorable valuation multiples (PE 36.4, PB 15.9)
- Weak liquidity with current ratio 0.98 and quick ratio 0.73
- Dividend yield very low at 0.15%
- ROIC below WACC (6.3% vs. 9.93%)
- Asset turnover is only neutral at 0.6
Constellation Energy Weaknesses
- Price-to-book ratio unfavorable at 5.35
- Asset turnover weak at 0.45
- Dividend yield modest at 0.63%
- Moderate leverage with debt-to-equity at 0.64
- ROIC slightly above WACC but only neutral status
Overall, both companies show slightly favorable financial health with distinct strengths. GE Vernova excels in leverage management and global footprint, while Constellation offers better liquidity and regional market penetration. Each faces valuation and efficiency challenges that could influence strategic focus.
The Moat Duel: Analyzing Competitive Defensibility
A structural moat is the only reliable shield protecting long-term profits from relentless competitive erosion in utilities:
GE Vernova Inc.: Intangible Assets and Diversified Energy Solutions
GE Vernova’s moat stems from its broad energy portfolio and proprietary grid solutions. Despite neutral ROIC trends, it suffers value destruction. Expansion into electrification could deepen its edge by 2026.
Constellation Energy Corporation: Operational Efficiency and Regional Footprint
Constellation leverages operational scale and regional diversification. Its improving ROIC signals growing efficiency, contrasting GE Vernova’s stagnant returns. Future growth hinges on nuclear and renewable integration.
The Moat Verdict: Diversified Innovation vs. Operational Momentum
Constellation’s growing ROIC trend grants it a slightly deeper moat despite current value erosion. GE Vernova’s wider energy scope is vulnerable without improved capital returns. Constellation stands better poised to defend market share.
Which stock offers better returns?
The past year reveals stark contrasts in price momentum and trading dynamics between GE Vernova Inc. and Constellation Energy Corporation.
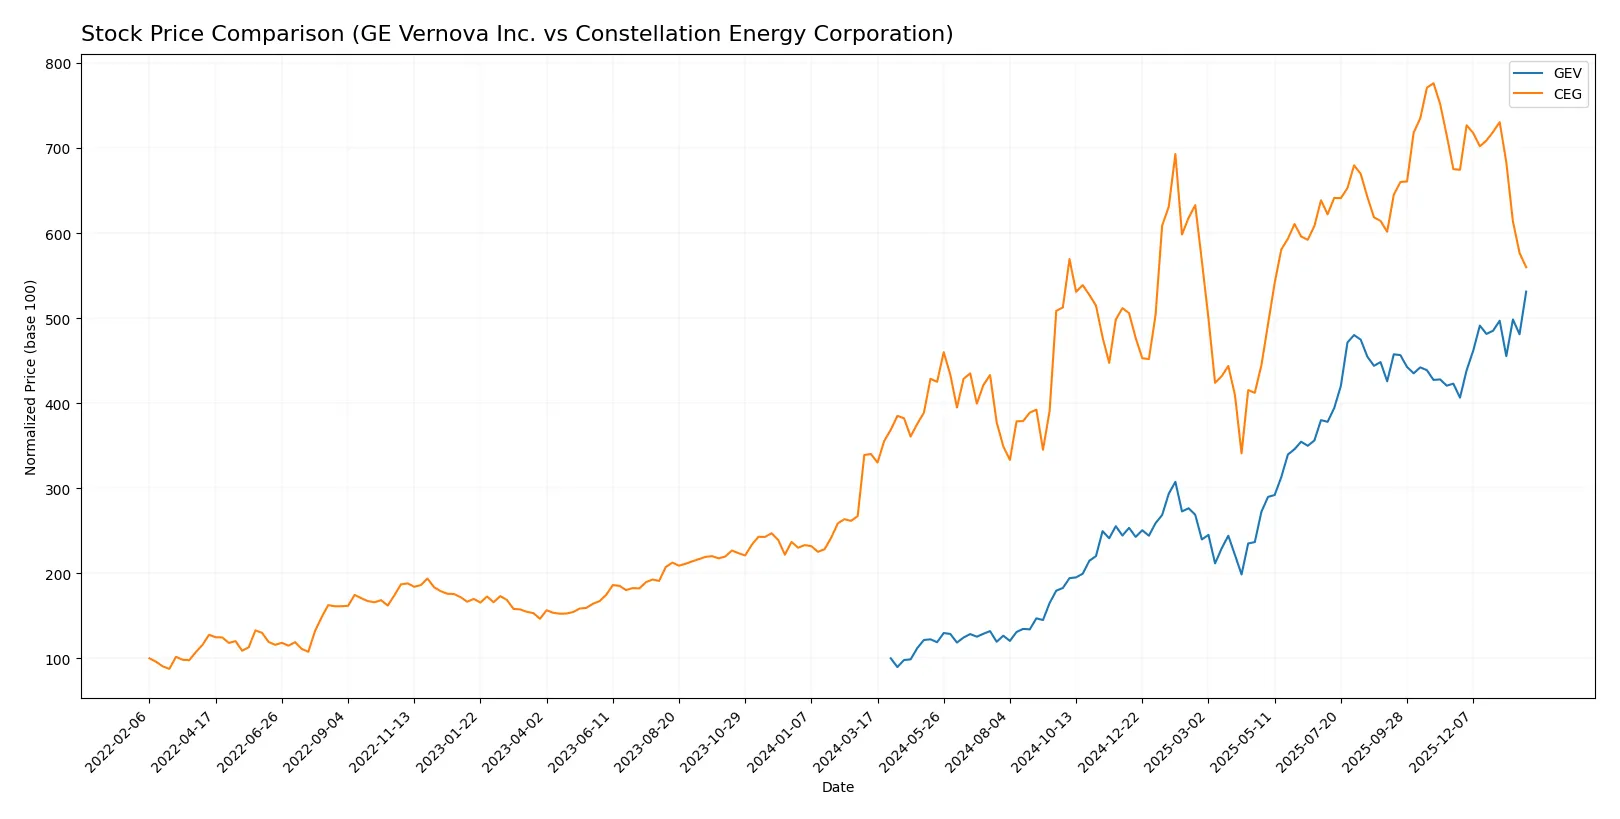
Trend Comparison
GE Vernova Inc. posted a strong bullish trend with a 431.17% price increase over 12 months, marked by accelerating gains and a wide price range from 123 to 726. The recent quarter sustained a 25.6% rise, confirming ongoing momentum.
Constellation Energy Corporation also exhibited a bullish trend with a 64.55% rise over the same period but shows deceleration. The recent quarter reversed, declining 17.09%, reflecting seller dominance and weakening momentum.
GE Vernova Inc. outperformed Constellation Energy Corporation, delivering substantially higher returns and sustained acceleration over the past year.
Target Prices
Analysts present a clear consensus with robust upside potential for both GE Vernova Inc. and Constellation Energy Corporation.
| Company | Target Low | Target High | Consensus |
|---|---|---|---|
| GE Vernova Inc. | 475 | 1,087 | 818.33 |
| Constellation Energy Corporation | 375 | 460 | 405.63 |
The consensus targets for GEV and CEG imply 13% and 45% upside, respectively, from current prices, reflecting strong analyst confidence amid sector growth.

Don’t Let Luck Decide Your Entry Point
Optimize your entry points with our advanced ProRealTime indicators. You’ll get efficient buy signals with precise price targets for maximum performance. Start outperforming now!
How do institutions grade them?
The following tables summarize institutional grades for GE Vernova Inc. and Constellation Energy Corporation:
GE Vernova Inc. Grades
This table shows recent grades and actions from key grading companies for GE Vernova Inc.
| Grading Company | Action | New Grade | Date |
|---|---|---|---|
| RBC Capital | maintain | Outperform | 2026-01-30 |
| Goldman Sachs | maintain | Buy | 2026-01-29 |
| Evercore ISI Group | maintain | Outperform | 2026-01-29 |
| Citigroup | maintain | Neutral | 2026-01-29 |
| Susquehanna | maintain | Positive | 2026-01-29 |
| GLJ Research | maintain | Buy | 2026-01-12 |
| Citigroup | maintain | Neutral | 2026-01-12 |
| Baird | downgrade | Neutral | 2026-01-09 |
| Barclays | maintain | Overweight | 2026-01-07 |
| Jefferies | maintain | Buy | 2025-12-22 |
Constellation Energy Corporation Grades
This table presents recent grades and actions from major grading firms on Constellation Energy Corporation.
| Grading Company | Action | New Grade | Date |
|---|---|---|---|
| Wells Fargo | maintain | Overweight | 2026-01-20 |
| UBS | maintain | Buy | 2025-12-17 |
| JP Morgan | maintain | Overweight | 2025-12-16 |
| Citigroup | maintain | Neutral | 2025-11-10 |
| Mizuho | maintain | Neutral | 2025-10-27 |
| JP Morgan | maintain | Overweight | 2025-10-20 |
| Keybanc | maintain | Overweight | 2025-10-15 |
| Seaport Global | upgrade | Buy | 2025-10-08 |
| Jefferies | maintain | Hold | 2025-09-09 |
| Raymond James | maintain | Outperform | 2025-08-11 |
Which company has the best grades?
GE Vernova Inc. holds a predominance of “Buy” and “Outperform” ratings, with minor neutral and one downgrade. Constellation Energy shows mostly “Overweight” and “Buy” grades, plus some neutral and hold ratings. GE Vernova’s consistently higher-grade consensus could signal stronger institutional conviction, potentially influencing investor confidence more positively.
Risks specific to each company
The following categories identify the critical pressure points and systemic threats facing both firms in the 2026 market environment:
1. Market & Competition
GE Vernova Inc.
- Faces intense competition in renewable utilities with high valuation multiples pressuring growth expectations.
Constellation Energy Corporation
- Operates in diverse power regions but contends with regional market saturation and moderate valuation metrics.
2. Capital Structure & Debt
GE Vernova Inc.
- Zero debt load provides financial flexibility but may limit leverage benefits for growth.
Constellation Energy Corporation
- Moderate debt-to-equity ratio (~0.64) balances growth and risk but increases interest obligations.
3. Stock Volatility
GE Vernova Inc.
- Higher beta (~1.30) signals elevated stock volatility, increasing investor risk exposure.
Constellation Energy Corporation
- Lower beta (~1.15) suggests relatively less price fluctuation and market sensitivity.
4. Regulatory & Legal
GE Vernova Inc.
- Subject to stringent renewable energy regulations and grid modernization policies.
Constellation Energy Corporation
- Exposed to complex regional regulatory frameworks and potential nuclear licensing risks.
5. Supply Chain & Operations
GE Vernova Inc.
- Broad operational segments require robust supply chains, vulnerable to component shortages.
Constellation Energy Corporation
- Large generating capacity demands stable fuel supplies and operational reliability.
6. ESG & Climate Transition
GE Vernova Inc.
- Strong focus on renewables aligns with climate goals but depends on technological advancements.
Constellation Energy Corporation
- Diverse energy mix includes nuclear and natural gas, posing transition and reputational risks.
7. Geopolitical Exposure
GE Vernova Inc.
- Primarily US-based, limiting direct geopolitical risks but sensitive to domestic policy shifts.
Constellation Energy Corporation
- US-centric operations face similar risks, with some exposure to regional energy policy volatility.
Which company shows a better risk-adjusted profile?
GE Vernova’s zero debt and strong Altman Z-score place it in a safer financial zone despite high valuation and volatility. Constellation Energy’s moderate debt and regional regulatory complexity increase risk, and its grey zone Altman Z-score signals moderate financial distress potential. The high beta and stretched valuation multiples heighten GE Vernova’s market risk, but its balance sheet strength and operational scale offer a more resilient profile. Constellation’s weaker Piotroski score and DCF outlook underline valuation and cash flow concerns. Therefore, GE Vernova shows a better risk-adjusted profile, supported by its robust capital structure and financial stability despite market pressures.
Final Verdict: Which stock to choose?
GE Vernova Inc. (GEV) impresses with its strong profitability and capital efficiency, making it a cash machine in a challenging energy market. However, its high valuation and tight liquidity ratios are points of vigilance. It suits investors seeking aggressive growth with tolerance for elevated risk.
Constellation Energy Corporation (CEG) boasts a durable strategic moat rooted in steady operational cash flow and a safer balance sheet. Its recurring revenue model offers stability compared to GEV’s volatility. CEG fits well within portfolios focused on Growth at a Reasonable Price (GARP).
If you prioritize rapid capital appreciation and can manage valuation risks, GEV’s operational momentum and profitability make it compelling. However, if you seek better financial stability and a more conservative growth path, CEG offers superior resilience despite slower recent price appreciation. Both present analytical scenarios for distinct investor profiles.
Disclaimer: Investment carries a risk of loss of initial capital. The past performance is not a reliable indicator of future results. Be sure to understand risks before making an investment decision.
Go Further
I encourage you to read the complete analyses of GE Vernova Inc. and Constellation Energy Corporation to enhance your investment decisions: