Home > Comparison > Utilities > XEL vs ED
The strategic rivalry between Xcel Energy Inc. and Consolidated Edison, Inc. shapes the dynamics of the regulated electric utilities sector. Xcel Energy operates a diverse energy mix across multiple states, blending traditional and renewable sources. In contrast, Consolidated Edison focuses on dense urban markets with integrated electric, gas, and steam delivery. This analysis evaluates which operational model offers superior risk-adjusted returns amid evolving energy demands and regulatory pressures.
Table of contents
Companies Overview
Xcel Energy and Consolidated Edison dominate the regulated electric utility landscape in the United States.
Xcel Energy Inc.: Multi-Source Regulated Utility
Xcel Energy stands as a diversified energy generator serving 3.7M electricity and 2.1M natural gas customers. Its revenue stems from generation, transmission, and distribution of electricity and natural gas across eight states. In 2026, the company emphasizes expanding renewable generation and infrastructure to balance sustainability with regulated returns.
Consolidated Edison, Inc.: Urban Energy Infrastructure Leader
Consolidated Edison delivers regulated electric, gas, and steam services to over 5M customers primarily in New York City and Westchester. Its core revenue arises from regulated utility operations covering electric, gas, and steam delivery. The firm focuses strategically on maintaining aging infrastructure and investing in renewable and energy transmission projects.
Strategic Collision: Similarities & Divergences
Both firms operate in the regulated electric utility sector with a focus on stable, long-term cash flows. Xcel Energy adopts a broader geographic footprint and diversified fuel mix, while Consolidated Edison concentrates on dense urban infrastructure and multi-utility services. Their primary battleground lies in balancing infrastructure modernization with regulatory frameworks. Investors face distinct profiles: Xcel offers diversified growth through renewables, whereas Con Edison emphasizes urban utility reliability and infrastructure investments.
Income Statement Comparison
This data dissects the core profitability and scalability of both corporate engines to reveal who dominates the bottom line:
| Metric | Xcel Energy Inc. (XEL) | Consolidated Edison, Inc. (ED) |
|---|---|---|
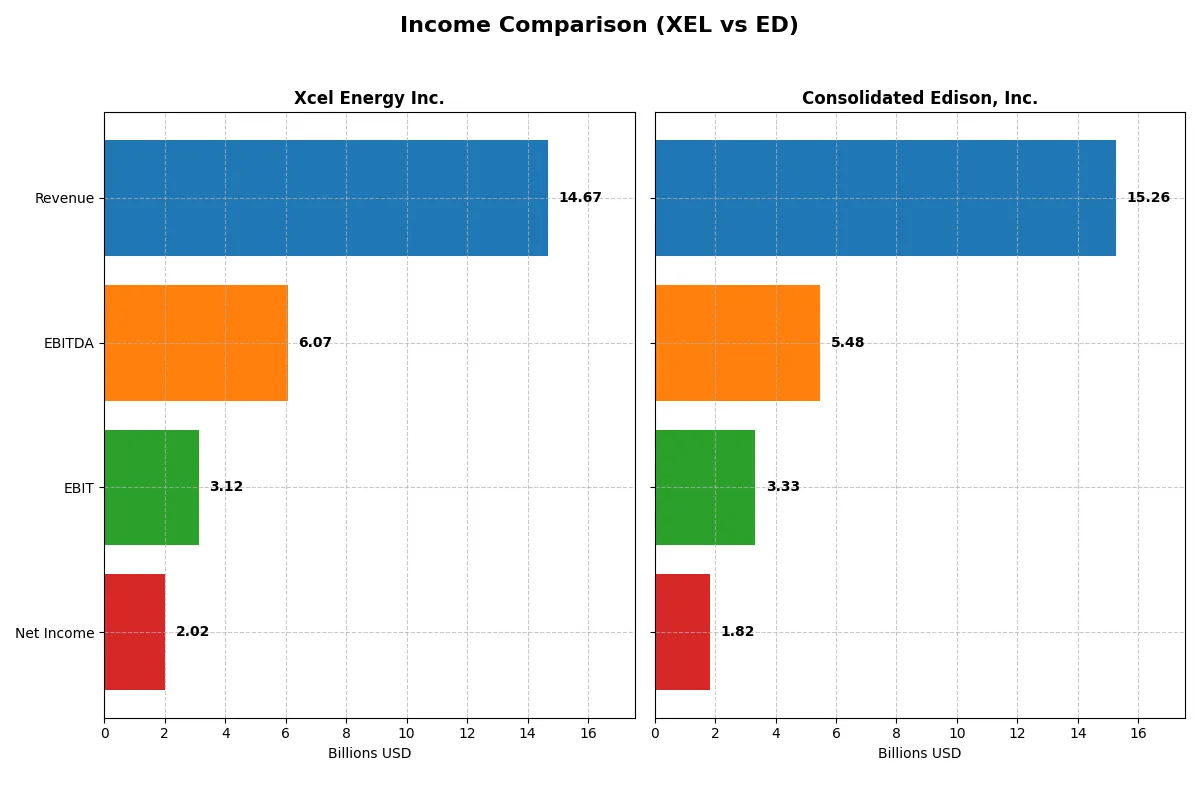
| Revenue | 14.7B | 15.3B |
| Cost of Revenue | 11.1B | 5.5B |
| Operating Expenses | 686M | 7.0B |
| Gross Profit | 3.6B | 9.8B |
| EBITDA | 6.1B | 5.5B |
| EBIT | 3.1B | 3.3B |
| Interest Expense | 1.3B | 1.2B |
| Net Income | 2.0B | 1.8B |
| EPS | 3.44 | 5.26 |
| Fiscal Year | 2025 | 2024 |
Income Statement Analysis: The Bottom-Line Duel
This income statement comparison reveals the true efficiency of Xcel Energy Inc. and Consolidated Edison, Inc. as corporate engines powering growth and profitability.
Xcel Energy Inc. Analysis
Xcel Energy’s revenue grew steadily to $14.7B in 2025, with net income rising to $2.0B. Its gross margin slipped to 24.3%, but EBIT margin held firm at 21.2%. Despite a 42% gross profit drop last year, operating expenses scaled well with revenue, signaling operational discipline. The 2025 momentum shows cautious efficiency gains amid margin pressure.
Consolidated Edison, Inc. Analysis
Consolidated Edison posted $15.3B revenue in 2024, up moderately, with net income at $1.8B. Its gross margin stands robust at 64%, outperforming peers, while EBIT margin edges slightly higher at 21.8%. Recent EBIT contracted 17.5%, and net margin declined sharply, reflecting cost challenges. Overall, the company shows strong margin power but weaker near-term profitability momentum.
Margin Strength vs. Growth Resilience
Xcel Energy delivers steady revenue and net income growth with solid EBIT margin control, despite recent gross profit volatility. Consolidated Edison boasts superior gross margins but faces headwinds in EBIT and net income growth. For investors, Xcel’s consistent income expansion offers a more resilient profile, while Consolidated Edison’s margin advantages come with near-term earnings risks.
Financial Ratios Comparison
These vital ratios act as a diagnostic tool to expose the underlying fiscal health, valuation premiums, and capital efficiency of the companies compared below:
| Ratios | Xcel Energy Inc. (XEL) | Consolidated Edison, Inc. (ED) |
|---|---|---|
| ROE | 9.9% | 8.3% |
| ROIC | 3.6% | 3.5% |
| P/E | 19.6 | 17.0 |
| P/B | 1.95 | 1.41 |
| Current Ratio | 0.67 | 1.04 |
| Quick Ratio | 0.57 | 0.96 |
| D/E | 1.55 | 1.27 |
| Debt-to-Assets | 43.1% | 39.4% |
| Interest Coverage | 2.02 | 2.30 |
| Asset Turnover | 0.19 | 0.22 |
| Fixed Asset Turnover | 0.23 | 0.29 |
| Payout Ratio | 61% | 60% |
| Dividend Yield | 3.1% | 3.6% |
| Fiscal Year | 2024 | 2024 |
Efficiency & Valuation Duel: The Vital Signs
Financial ratios serve as a company’s DNA, exposing hidden risks and operational excellence that shape investor decisions.
Xcel Energy Inc.
Xcel Energy shows a favorable net margin of 13.76% but a zero ROE, signaling weak shareholder profitability. Its P/E ratio stands neutral at 21.48, suggesting fair valuation. The firm delivers a strong 3.83% dividend yield, rewarding shareholders despite limited reinvestment signals in R&D or growth initiatives.
Consolidated Edison, Inc.
Consolidated Edison posts a solid net margin of 11.93% and an ROE of 8.29%, though considered unfavorable versus sector standards. Its P/E ratio of 16.96 reflects a reasonable valuation. The company maintains a 3.56% dividend yield, balancing shareholder returns with modest reinvestment, supported by a WACC of 4.79% indicating cost-effective capital use.
Dividend Strength vs. Operational Efficiency
Xcel Energy offers higher dividend yield but lacks ROE, raising concerns about return on equity. Consolidated Edison presents balanced profitability and valuation metrics with a slightly lower yield. Investors prioritizing stable dividends might prefer Xcel, while those valuing operational efficiency may lean toward Consolidated Edison.
Which one offers the Superior Shareholder Reward?
Xcel Energy (XEL) delivers a 3.8% dividend yield with a high 82% payout ratio, signaling strong cash return but limited reinvestment. Consolidated Edison (ED) pays a 3.6% yield with a 60% payout ratio, balancing dividends and growth. Both face free cash flow deficits, but ED’s more moderate payout and consistent buybacks suggest a sustainable, attractive total return. I favor ED for superior long-term shareholder reward in 2026.
Comparative Score Analysis: The Strategic Profile
The radar chart reveals the fundamental DNA and trade-offs of both firms, highlighting their distinct competitive strengths and weaknesses:
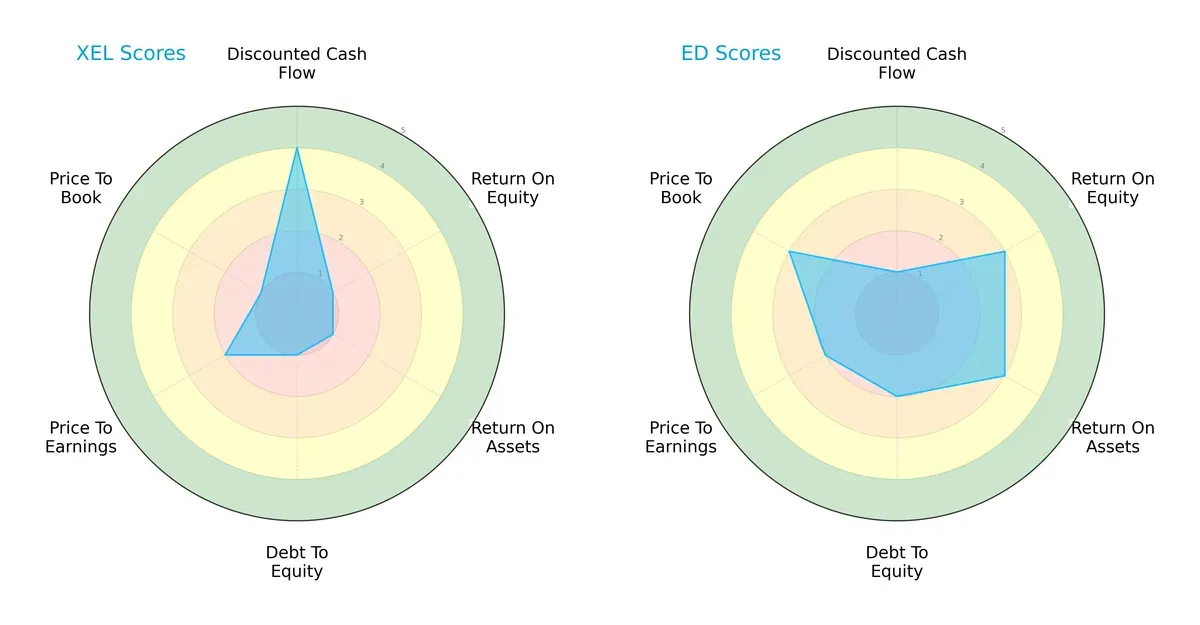
Xcel Energy Inc. (XEL) excels in discounted cash flow with a favorable score of 4 but struggles with profitability and leverage, scoring very unfavorably in ROE, ROA, and debt-to-equity. Consolidated Edison, Inc. (ED) displays a more balanced profile, with moderate scores in ROE, ROA, and price-to-book, though its DCF score is weak. ED leans on operational efficiency and asset returns, while XEL depends heavily on future cash flow potential despite financial risks.
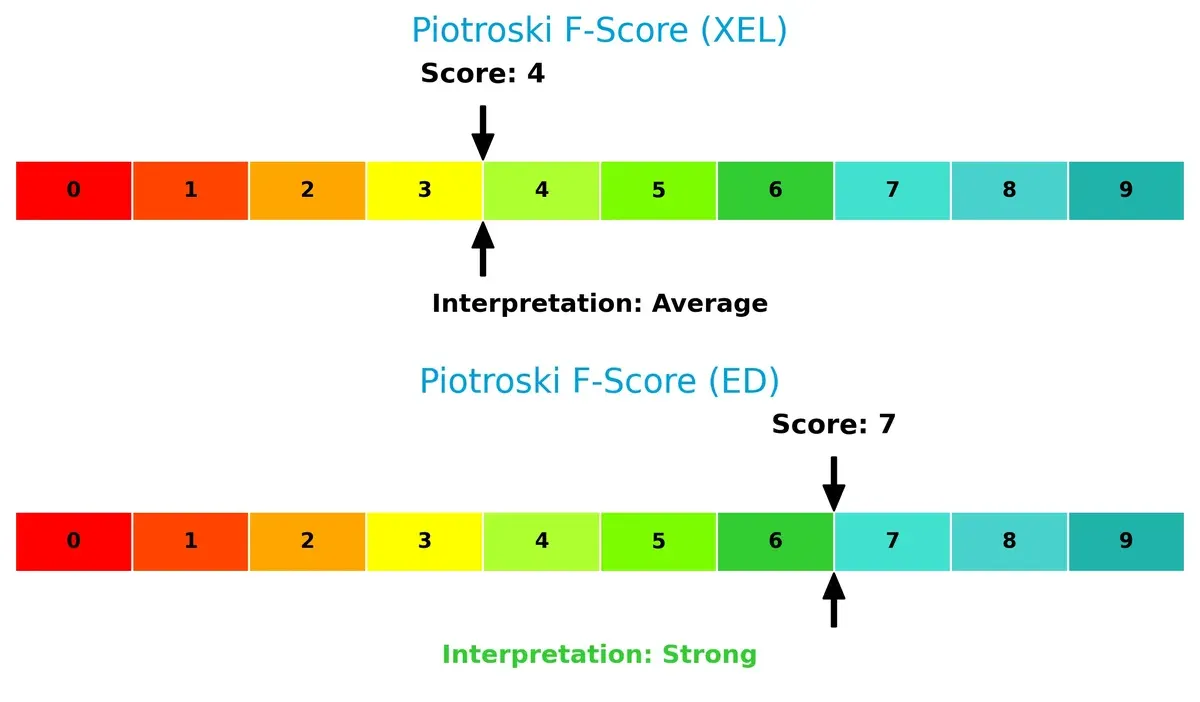
Financial Health: Quality of Operations
Consolidated Edison, Inc. (ED) scores a strong 7 on the Piotroski F-Score, indicating robust financial health and operational quality. Xcel Energy Inc. (XEL), with an average score of 4, signals caution due to weaker internal metrics and potential red flags in financial strength:
How are the two companies positioned?
This section dissects the operational DNA of XEL and ED by comparing their revenue distribution by segment alongside internal strengths and weaknesses. The goal is to confront their economic moats to identify the most resilient and sustainable competitive advantage today.
Revenue Segmentation: The Strategic Mix
This visual comparison dissects how Xcel Energy Inc. and Consolidated Edison, Inc. diversify their income streams and where their primary sector bets lie:
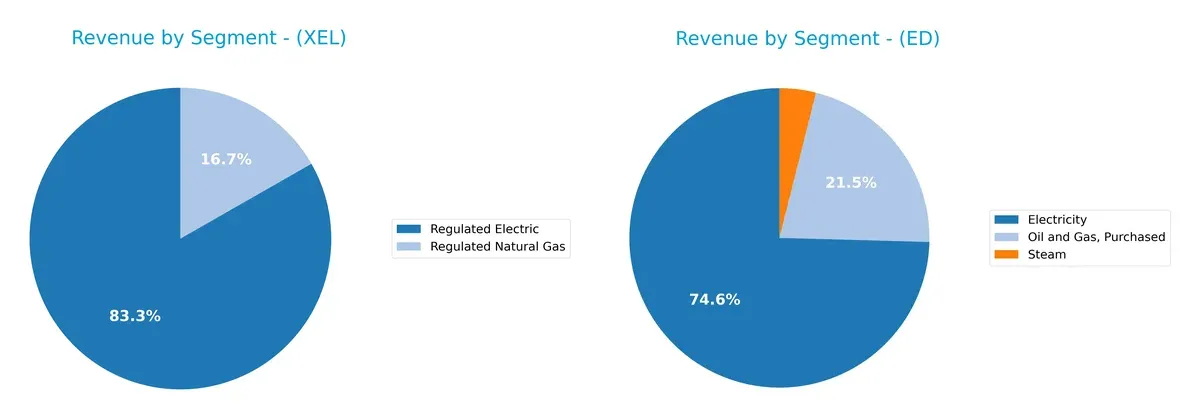
Xcel Energy anchors revenue in Regulated Electric at $22.3B, with Regulated Natural Gas adding $4.5B, showing a focused but stable utility mix. Consolidated Edison displays a more diversified stream: Electricity at $10.8B, Oil and Gas Purchased at $3.1B, and Steam at $0.57B. Xcel’s dominance in regulated electric utilities implies strong infrastructure control but higher regulatory risk. Con Edison’s broader base mitigates concentration risk but demands agile capital allocation across segments.
Strengths and Weaknesses Comparison
This table compares the Strengths and Weaknesses of Xcel Energy Inc. and Consolidated Edison, Inc.:
Xcel Energy Inc. Strengths
- Strong net margin at 13.76%
- Favorable debt-to-assets ratio
- Dividend yield at 3.83%
- Broad regulated electric and natural gas revenue streams
Consolidated Edison, Inc. Strengths
- Favorable net margin at 11.93%
- WACC at 4.79% supports capital efficiency
- Positive dividend yield at 3.56%
- Diverse product segments including electricity, oil, steam, and non-utility products
Xcel Energy Inc. Weaknesses
- Zero ROE and ROIC indicate poor capital returns
- Unfavorable liquidity ratios
- Low asset turnover signals inefficiency
- Slightly unfavorable global ratios evaluation
Consolidated Edison, Inc. Weaknesses
- ROE and ROIC below optimal levels
- High debt-to-equity ratio at 1.27
- Unfavorable asset turnover ratios
- Slightly unfavorable global ratios evaluation
Xcel Energy benefits from solid profitability and conservative leverage but suffers from weak returns on invested capital and liquidity concerns. Consolidated Edison shows more balanced diversification but faces leverage pressures and subpar asset efficiency. Each company’s strategy must address these distinct financial tensions.
The Moat Duel: Analyzing Competitive Defensibility
A structural moat is the only reliable shield protecting long-term profits from relentless competition erosion:
Xcel Energy Inc.: Asset-Intensive Utility Moat
Xcel relies on regulated infrastructure and scale economies as its moat. It sustains stable margins and steady revenue growth. However, declining ROIC signals pressure on capital efficiency heading into 2026.
Consolidated Edison, Inc.: Urban Monopoly Moat
Con Ed leverages entrenched urban networks and regulatory barriers. Its high gross margin reflects pricing power. Yet shrinking ROIC and recent margin volatility challenge its moat’s durability in evolving energy markets.
Legacy Infrastructure vs. Urban Monopoly: Which Moat Holds Stronger?
Both companies face declining ROIC trends, undermining their moats. Still, Xcel’s broader geographic footprint and diversified energy mix offer a wider moat. Xcel appears better positioned to defend market share amid rising competitive and regulatory pressures.
Which stock offers better returns?
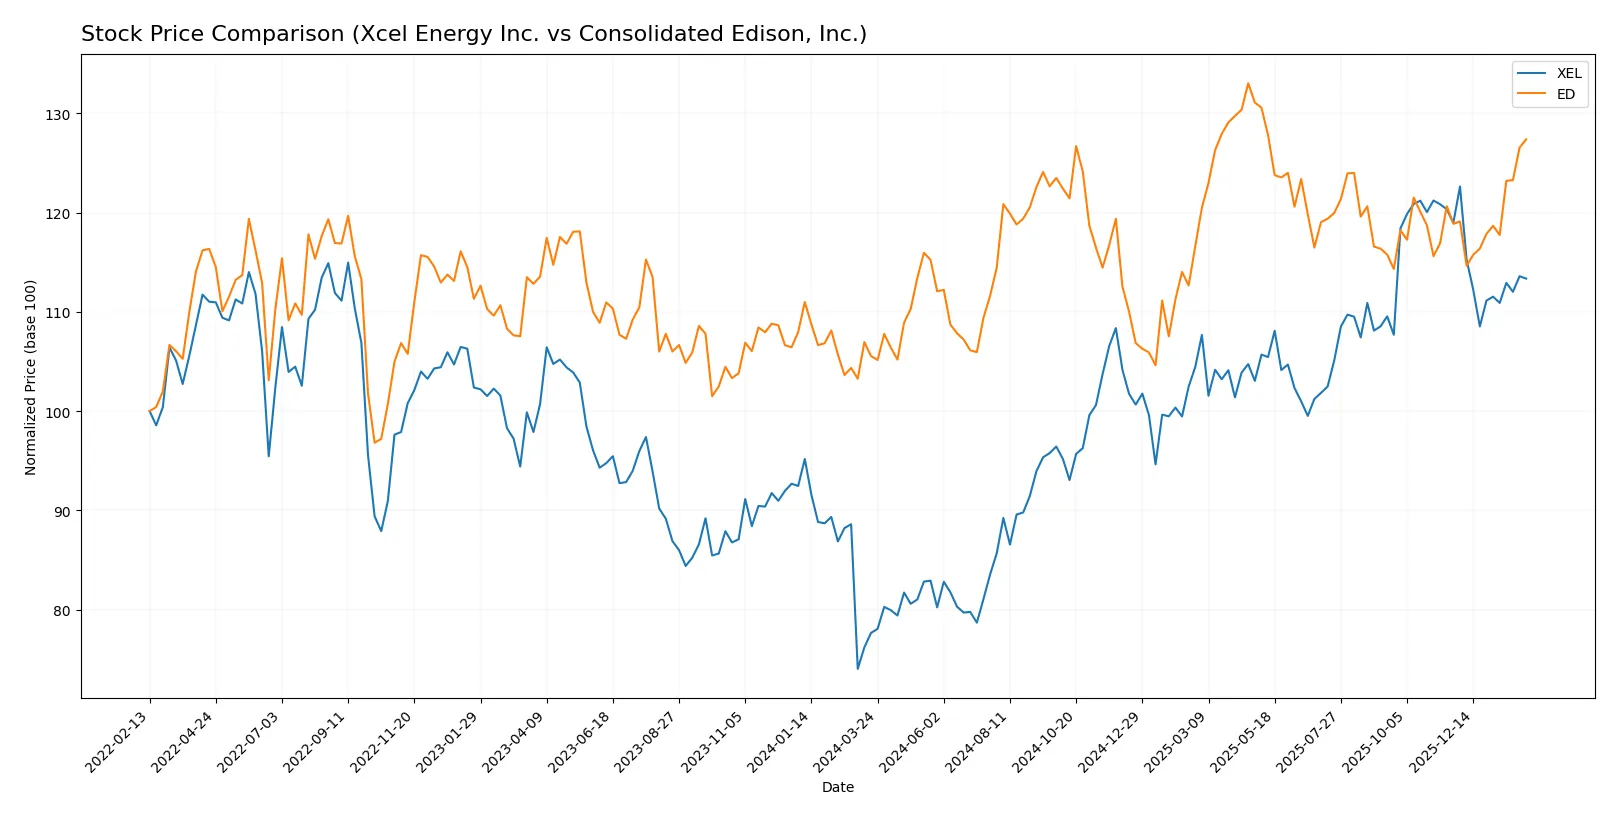
The past year shows distinct price gains and trading dynamics for both stocks, with Xcel Energy’s robust rise and Consolidated Edison’s steadier but accelerating growth.
Trend Comparison
Xcel Energy Inc. (XEL) posted a strong 46.0% gain over the past 12 months, indicating a bullish trend with deceleration. Its price ranged from $52.0 to $82.1, showing high volatility (8.24 std dev). Recently, XEL declined 4.7% with seller dominance.
Consolidated Edison, Inc. (ED) gained 20.7% over the year, also bullish with accelerating momentum. Price fluctuated between $88.2 and $112.1 with moderate volatility (5.77 std dev). Recent trend shows a 7.2% rise and strong buyer dominance.
XEL outperformed ED with a higher total return despite recent weakness. ED shows accelerating strength, but XEL delivered the superior market performance over 12 months.
Target Prices
Analysts present a mixed but cautiously optimistic target consensus for these regulated utilities.
| Company | Target Low | Target High | Consensus |
|---|---|---|---|
| Xcel Energy Inc. | 81 | 95 | 88 |
| Consolidated Edison, Inc. | 86 | 166 | 110.63 |
Xcel Energy’s target consensus at $88 offers a 16% upside from its $75.9 price, reflecting steady confidence. Consolidated Edison’s wider range and $110.63 consensus suggest moderate upside potential from $107.34, tempered by volatility risk.

Don’t Let Luck Decide Your Entry Point
Optimize your entry points with our advanced ProRealTime indicators. You’ll get efficient buy signals with precise price targets for maximum performance. Start outperforming now!
How do institutions grade them?
This section compares recent institutional grades for Xcel Energy Inc. and Consolidated Edison, Inc.:
Xcel Energy Inc. Grades
The table below summarizes recent analyst grades for Xcel Energy Inc.:
| Grading Company | Action | New Grade | Date |
|---|---|---|---|
| Barclays | Maintain | Overweight | 2026-01-15 |
| UBS | Maintain | Neutral | 2025-12-17 |
| Keybanc | Maintain | Overweight | 2025-12-12 |
| JP Morgan | Maintain | Overweight | 2025-12-11 |
| Barclays | Maintain | Overweight | 2025-11-05 |
| Citigroup | Maintain | Buy | 2025-11-03 |
| UBS | Maintain | Neutral | 2025-10-31 |
| Mizuho | Maintain | Outperform | 2025-10-27 |
| Jefferies | Maintain | Buy | 2025-10-16 |
| Keybanc | Maintain | Overweight | 2025-10-15 |
Consolidated Edison, Inc. Grades
The table below summarizes recent analyst grades for Consolidated Edison, Inc.:
| Grading Company | Action | New Grade | Date |
|---|---|---|---|
| UBS | Maintain | Neutral | 2026-01-23 |
| Barclays | Maintain | Underweight | 2026-01-22 |
| Wells Fargo | Maintain | Equal Weight | 2026-01-20 |
| UBS | Maintain | Neutral | 2026-01-07 |
| UBS | Maintain | Neutral | 2025-12-17 |
| Keybanc | Maintain | Underweight | 2025-12-12 |
| JP Morgan | Maintain | Underweight | 2025-12-12 |
| Barclays | Maintain | Underweight | 2025-11-10 |
| Barclays | Maintain | Underweight | 2025-10-22 |
| Morgan Stanley | Maintain | Underweight | 2025-10-22 |
Which company has the best grades?
Xcel Energy Inc. consistently receives positive grades ranging from Neutral to Buy/Outperform. Consolidated Edison mostly earns Neutral to Underweight ratings. Xcel’s stronger grades suggest greater institutional confidence, which could influence investor sentiment favorably.
Risks specific to each company
The following categories identify critical pressure points and systemic threats facing Xcel Energy Inc. and Consolidated Edison, Inc. in the 2026 market environment:
1. Market & Competition
Xcel Energy Inc.
- Operates in diverse states with 3.7M electric and 2.1M gas customers, facing regional competition and evolving energy mix demands.
Consolidated Edison, Inc.
- Serves 3.5M electric, 1.1M gas, and steam customers mainly in NYC metro, exposed to intense urban regulatory and market pressures.
2. Capital Structure & Debt
Xcel Energy Inc.
- Shows favorable debt-to-equity metrics but neutral interest coverage (2.32x), signaling manageable but cautious leverage.
Consolidated Edison, Inc.
- Higher debt-to-equity ratio (1.27) with neutral interest coverage (2.8x) indicates reliance on debt, increasing financial risk.
3. Stock Volatility
Xcel Energy Inc.
- Lower beta of 0.476 suggests less stock volatility, appealing for risk-averse investors.
Consolidated Edison, Inc.
- Even lower beta at 0.388, indicating relatively stable stock price movement amid sector volatility.
4. Regulatory & Legal
Xcel Energy Inc.
- Faces regulatory scrutiny across multiple states with evolving renewable mandates impacting operations and costs.
Consolidated Edison, Inc.
- Operates in heavily regulated NYC area, subject to stringent environmental and safety regulations, adding compliance complexity.
5. Supply Chain & Operations
Xcel Energy Inc.
- Diverse energy sources from coal to renewables create operational complexity but offer resilience.
Consolidated Edison, Inc.
- Concentrated urban infrastructure requires intensive maintenance, raising operational risk and capital needs.
6. ESG & Climate Transition
Xcel Energy Inc.
- Invests in renewable generation but carbon legacy assets pose transition risks amid accelerating climate policies.
Consolidated Edison, Inc.
- Aggressive renewable and energy infrastructure projects align with ESG trends but entail execution and financing risks.
7. Geopolitical Exposure
Xcel Energy Inc.
- Primarily US domestic operations with low geopolitical risk but regional weather events remain a concern.
Consolidated Edison, Inc.
- Concentrated in NYC metro, vulnerable to local disruptions including extreme weather and political regulatory shifts.
Which company shows a better risk-adjusted profile?
Xcel Energy’s most impactful risk lies in managing its multi-state regulatory complexity and carbon transition. Consolidated Edison faces significant financial leverage and urban operational risks. Despite Xcel’s slightly unfavorable financial ratios, its lower leverage and broader geographic spread offer a better risk-adjusted profile. Meanwhile, Con Edison’s higher debt levels and urban concentration raise caution, especially given its Altman Z-Score in the distress zone. This contrast highlights Xcel’s relative stability amid sector challenges in 2026.
Final Verdict: Which stock to choose?
Xcel Energy Inc. (XEL) impresses with its role as a cash machine in the utility sector, delivering steady income and favorable net margins. Its key vulnerability lies in a strained liquidity position, which investors must monitor closely. This stock suits aggressive growth portfolios willing to tolerate operational tightness for upside potential.
Consolidated Edison, Inc. (ED) benefits from a strategic moat anchored in its regulated utility status, providing recurring revenue safety and more balanced liquidity. It shows better financial stability relative to XEL, despite a somewhat slower growth profile. ED appeals to GARP investors seeking consistent income with reasonable valuation.
If you prioritize aggressive cash flow growth and can tolerate liquidity risks, XEL is the compelling choice due to its strong earnings yield and operational focus. However, if you seek a safer income stream with a solid regulatory moat and steadier balance sheet, ED offers better stability and recurring cash flow reliability. Both scenarios require vigilance on declining ROIC trends, underscoring the importance of risk management.
Disclaimer: Investment carries a risk of loss of initial capital. The past performance is not a reliable indicator of future results. Be sure to understand risks before making an investment decision.
Go Further
I encourage you to read the complete analyses of Xcel Energy Inc. and Consolidated Edison, Inc. to enhance your investment decisions: