Consolidated Edison, Inc. (ED) and WEC Energy Group, Inc. (WEC) are two leading players in the regulated electric utility sector, serving millions of customers across key U.S. regions. Both companies emphasize innovation in renewable energy and infrastructure development while operating extensive transmission networks. Given their market overlap and strategic focus, this comparison aims to help investors identify which company offers a more compelling investment opportunity in the evolving energy landscape. Let’s explore their strengths to guide your portfolio decisions.
Table of contents
Companies Overview
I will begin the comparison between Consolidated Edison, Inc. and WEC Energy Group, Inc. by providing an overview of these two companies and their main differences.
Consolidated Edison, Inc. Overview
Consolidated Edison, Inc. operates primarily in regulated electric, gas, and steam delivery services in the US, focusing on New York City and surrounding areas. It serves approximately 3.5M electric customers and 1.1M gas customers, alongside steam services. The company also invests in renewable energy infrastructure and transmission projects, positioning itself as a diversified utility with a strong local market presence.
WEC Energy Group, Inc. Overview
WEC Energy Group, Inc. provides regulated natural gas and electricity services, including renewable and nonregulated energy, across multiple US states. It operates extensive overhead and underground distribution lines and substations, supporting millions of customers. The company’s diversified energy generation mix includes coal, natural gas, hydroelectric, wind, solar, and biomass, reflecting a broad energy portfolio beyond traditional utilities.
Key similarities and differences
Both companies operate in the regulated electric and gas utility sector in the US, with a focus on stable, long-term service delivery. They share diversified energy portfolios, including renewable assets. However, Consolidated Edison concentrates on a dense urban market with steam services, while WEC Energy Group covers multiple states and a wider range of energy sources, including significant natural gas infrastructure and nonregulated energy operations. Their employee counts and market caps also differ, reflecting scale and operational scope variations.
Income Statement Comparison
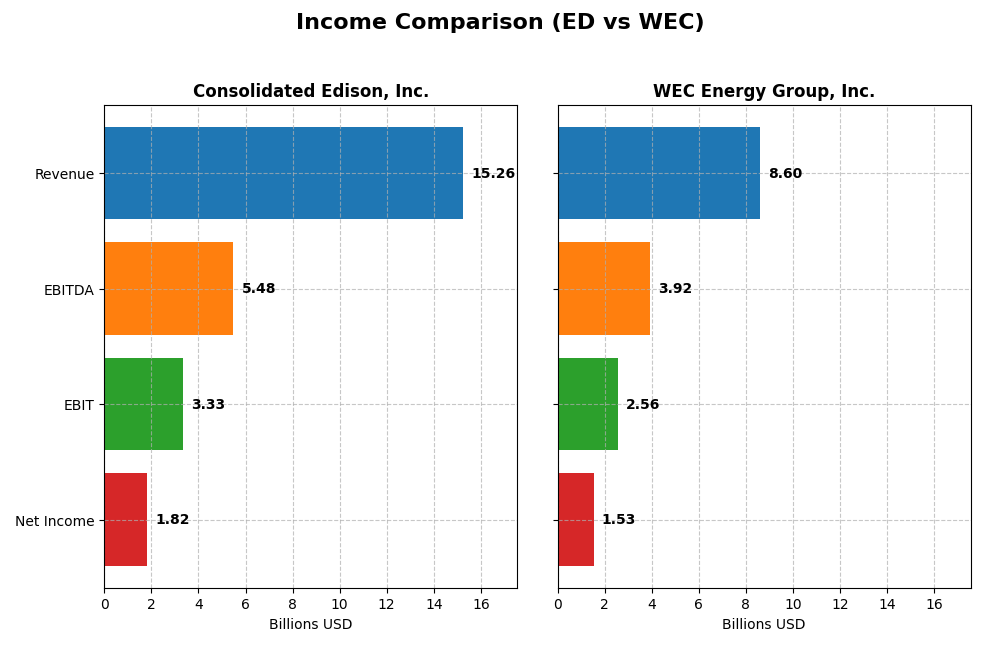
Below is a side-by-side comparison of key income statement metrics for Consolidated Edison, Inc. and WEC Energy Group, Inc. for the fiscal year 2024.
| Metric | Consolidated Edison, Inc. (ED) | WEC Energy Group, Inc. (WEC) |
|---|---|---|
| Market Cap | 35.8B | 33.5B |
| Revenue | 15.3B | 8.6B |
| EBITDA | 5.5B | 3.9B |
| EBIT | 3.3B | 2.6B |
| Net Income | 1.82B | 1.53B |
| EPS | 5.26 | 4.81 |
| Fiscal Year | 2024 | 2024 |
Income Statement Interpretations
Consolidated Edison, Inc.
Consolidated Edison showed a 24.65% revenue increase and a 65.3% net income growth from 2020 to 2024, with favorable gross and net margins at 63.99% and 11.93%, respectively. However, in 2024, revenue growth slowed to 4.16%, EBIT declined by 17.51%, and net margin contracted by 30.64%, signaling margin pressure despite overall positive trends.
WEC Energy Group, Inc.
WEC Energy’s revenue rose 18.76% and net income advanced 27.25% over the 2020-2024 period, supported by a strong EBIT margin of 29.79% and a net margin of 17.77%. In 2024, revenue fell by 3.3%, yet EBIT grew 13.18%, net margin improved by 18.58%, and EPS rose 14.45%, reflecting operational efficiency and margin expansion despite lower sales.
Which one has the stronger fundamentals?
WEC Energy demonstrates stronger recent fundamentals with expanding margins and earnings despite a revenue dip, supported by a high percentage (85.71%) of favorable income statement metrics. Consolidated Edison shows solid long-term growth but faces near-term margin and earnings declines, reflected in a lower 57.14% favorable metric rate, indicating more volatility in profitability.
Financial Ratios Comparison
The following table presents a side-by-side comparison of key financial ratios for Consolidated Edison, Inc. (ED) and WEC Energy Group, Inc. (WEC) based on their most recent fiscal year 2024 data.
| Ratios | Consolidated Edison, Inc. (ED) | WEC Energy Group, Inc. (WEC) |
|---|---|---|
| ROE | 8.29% | 12.30% |
| ROIC | 3.48% | 4.14% |
| P/E | 16.96 | 19.46 |
| P/B | 1.41 | 2.39 |
| Current Ratio | 1.04 | 0.60 |
| Quick Ratio | 0.96 | 0.43 |
| D/E (Debt-to-Equity) | 1.27 | 1.64 |
| Debt-to-Assets | 39.4% | 42.9% |
| Interest Coverage | 2.30 | 2.64 |
| Asset Turnover | 0.22 | 0.18 |
| Fixed Asset Turnover | 0.29 | 0.25 |
| Payout ratio | 60.4% | 69.1% |
| Dividend yield | 3.56% | 3.55% |
Interpretation of the Ratios
Consolidated Edison, Inc.
Consolidated Edison shows a mixed ratio profile with favorable net margin (11.93%) and WACC (4.72%), but weaker returns on equity (8.29%) and invested capital (3.48%). Its debt-to-equity ratio (1.27) and asset turnover ratios are also unfavorable, signaling potential efficiency and leverage concerns. The company pays a dividend with a 3.56% yield, reflecting a stable shareholder return supported by a moderate payout ratio.
WEC Energy Group, Inc.
WEC Energy presents stronger net margin (17.77%) than Consolidated Edison, with neutral returns on equity (12.3%) but a slightly unfavorable return on invested capital (4.14%). Liquidity ratios such as current (0.6) and quick ratios (0.43) are unfavorable, indicating tighter short-term financial flexibility. WEC maintains a dividend yield near 3.55%, suggesting consistent shareholder returns despite some leverage and efficiency challenges.
Which one has the best ratios?
Both companies exhibit slightly unfavorable overall ratio profiles, but Consolidated Edison has a marginally better balance of favorable ratios, especially in liquidity and leverage metrics. WEC’s higher net margin and return on equity are offset by weaker liquidity and more pronounced leverage issues. The choice depends on weighing profitability against financial stability.
Strategic Positioning
This section compares the strategic positioning of Consolidated Edison, Inc. and WEC Energy Group, Inc. including Market position, Key segments, and disruption:
Consolidated Edison, Inc.
- Large regulated electric utility with 3.5M electric customers mainly in New York City and Westchester County.
- Key segments include electricity, oil and gas purchased, steam, and non-utility products and services.
- Exposure includes renewable and energy infrastructure projects but no explicit mention of disruptive tech risk.
WEC Energy Group, Inc.
- Regulated utility operating mainly in Wisconsin and Illinois with diversified segments including non-utility energy.
- Key segments include Wisconsin, Illinois, other states, electric transmission, and non-utility energy infrastructure.
- Operates diverse energy sources including renewables, with electric transmission and natural gas infrastructure exposure.
Consolidated Edison, Inc. vs WEC Energy Group, Inc. Positioning
Consolidated Edison has a concentrated regional focus with diverse energy offerings, while WEC Energy is more diversified across multiple states and segments, including non-utility infrastructure. Each approach presents distinct operational scopes and business drivers.
Which has the best competitive advantage?
Both companies are currently shedding value as ROIC is below WACC; however, WEC Energy shows a growing ROIC trend, indicating improving profitability, whereas Consolidated Edison faces declining profitability, suggesting a weaker competitive advantage.
Stock Comparison
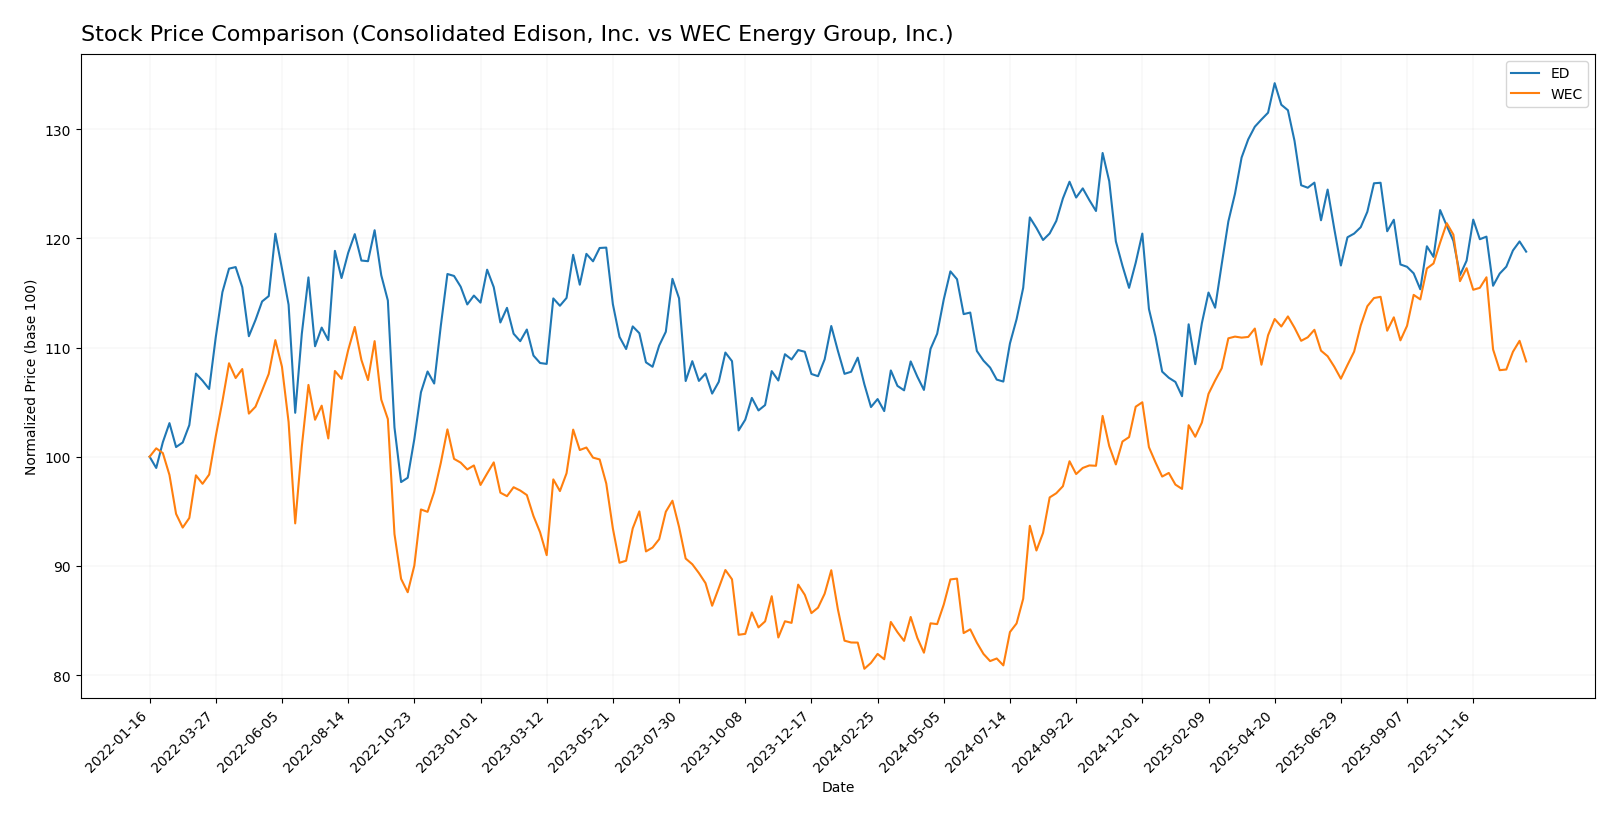
The stock price performance of Consolidated Edison, Inc. (ED) and WEC Energy Group, Inc. (WEC) over the past 12 months reveals notable bullish trends with decelerating momentum, contrasting recent short-term declines and shifts in buyer-seller dynamics.
Trend Analysis
Consolidated Edison, Inc. (ED) showed a 13.62% price increase over the past year, indicating a bullish trend with deceleration. Recent weeks reveal a slight negative trend of -0.83%, with low volatility and a marginal downward slope.
WEC Energy Group, Inc. (WEC) posted a stronger bullish trend with a 34.05% gain over the last 12 months, also decelerating. However, recent prices dropped sharply by -9.65%, accompanied by higher volatility and a pronounced negative slope.
Comparing the two, WEC delivered the highest market performance over the analyzed period despite its recent sharper decline, while ED maintained steadier price stability and buyer dominance in recent trading.
Target Prices
The consensus target prices for Consolidated Edison, Inc. and WEC Energy Group, Inc. reflect moderate upside potential based on analyst estimates.
| Company | Target High | Target Low | Consensus |
|---|---|---|---|
| Consolidated Edison, Inc. | 106 | 86 | 99.86 |
| WEC Energy Group, Inc. | 136 | 105 | 122.67 |
Analysts expect Consolidated Edison’s stock to hold steady near its current price of 99.21, while WEC Energy Group’s consensus target of 122.67 suggests a meaningful potential gain from its current 104.65 price.
Analyst Opinions Comparison
This section compares analysts’ ratings and grades for Consolidated Edison, Inc. and WEC Energy Group, Inc.:
Rating Comparison
ED Rating
- Rating: B-, rated as Very Favorable by analysts.
- Discounted Cash Flow Score: 1, indicating a Very Unfavorable valuation view.
- ROE Score: 3, considered Moderate efficiency in generating profit.
- ROA Score: 3, showing Moderate asset utilization effectiveness.
- Debt To Equity Score: 2, moderate financial risk level.
- Overall Score: 2, reflecting a Moderate overall financial standing.
WEC Rating
- Rating: B-, rated as Very Favorable by analysts.
- Discounted Cash Flow Score: 1, also indicating a Very Unfavorable valuation.
- ROE Score: 4, indicating a Favorable profit generation from equity.
- ROA Score: 4, reflecting Favorable asset utilization.
- Debt To Equity Score: 2, similarly moderate financial risk.
- Overall Score: 3, indicating a stronger Moderate financial standing.
Which one is the best rated?
Based strictly on provided data, WEC Energy Group holds a higher overall score (3 vs. 2) and stronger returns efficiency (ROE and ROA scores of 4 vs. 3), making it the better-rated company relative to Consolidated Edison.
Scores Comparison
The scores comparison between Consolidated Edison, Inc. (ED) and WEC Energy Group, Inc. (WEC) is as follows:
ED Scores
- Altman Z-Score: 1.19, in the distress zone, indicating high bankruptcy risk.
- Piotroski Score: 7, assessed as strong financial health.
WEC Scores
- Altman Z-Score: 1.14, also in the distress zone with high bankruptcy risk.
- Piotroski Score: 6, assessed as average financial health.
Which company has the best scores?
ED has a slightly higher Altman Z-Score and a stronger Piotroski Score compared to WEC. Both face distress zone risks, but ED’s financial strength appears stronger based on Piotroski metrics.
Grades Comparison
Here is the comparison of recent reliable grades for Consolidated Edison, Inc. and WEC Energy Group, Inc.:
Consolidated Edison, Inc. Grades
The table below summarizes recent grades from reputable financial institutions for Consolidated Edison, Inc.
| Grading Company | Action | New Grade | Date |
|---|---|---|---|
| UBS | Maintain | Neutral | 2026-01-07 |
| UBS | Maintain | Neutral | 2025-12-17 |
| Keybanc | Maintain | Underweight | 2025-12-12 |
| JP Morgan | Maintain | Underweight | 2025-12-12 |
| Barclays | Maintain | Underweight | 2025-11-10 |
| Barclays | Maintain | Underweight | 2025-10-22 |
| Morgan Stanley | Maintain | Underweight | 2025-10-22 |
| Barclays | Maintain | Underweight | 2025-10-21 |
| Keybanc | Maintain | Underweight | 2025-10-15 |
| Morgan Stanley | Maintain | Underweight | 2025-09-25 |
Consolidated Edison’s grades predominantly show underweight and neutral ratings, indicating cautious sentiment among analysts.
WEC Energy Group, Inc. Grades
The table below presents recent grades from verified grading companies for WEC Energy Group, Inc.
| Grading Company | Action | New Grade | Date |
|---|---|---|---|
| B of A Securities | Maintain | Neutral | 2025-12-31 |
| UBS | Maintain | Neutral | 2025-12-17 |
| Barclays | Maintain | Underweight | 2025-12-16 |
| Keybanc | Maintain | Overweight | 2025-12-12 |
| JP Morgan | Maintain | Neutral | 2025-12-11 |
| Scotiabank | Maintain | Sector Outperform | 2025-10-31 |
| BMO Capital | Maintain | Market Perform | 2025-10-21 |
| Barclays | Maintain | Equal Weight | 2025-10-21 |
| Keybanc | Maintain | Overweight | 2025-10-15 |
| UBS | Maintain | Neutral | 2025-10-10 |
WEC Energy Group shows a broader spectrum of ratings including overweight and sector outperform, suggesting a more favorable analyst outlook compared to Consolidated Edison.
Which company has the best grades?
WEC Energy Group has received generally better grades, including multiple overweight and sector outperform ratings, while Consolidated Edison is mostly rated underweight or neutral. This difference could imply a more optimistic market perception for WEC, potentially influencing investor confidence and portfolio decisions.
Strengths and Weaknesses
Below is a comparative overview of key strengths and weaknesses for Consolidated Edison, Inc. (ED) and WEC Energy Group, Inc. (WEC) based on recent financial and operational data.
| Criterion | Consolidated Edison, Inc. (ED) | WEC Energy Group, Inc. (WEC) |
|---|---|---|
| Diversification | Moderate: diversified revenue streams including Electricity (10.8B), Oil & Gas (3.1B), Steam (569M) | Moderate: regional focus with segments Illinois (1.6B), Wisconsin (6.3B), plus Non-Utility Energy Infrastructure (691M) |
| Profitability | Mixed: Net margin favorable at 11.9%, but ROIC (3.48%) below WACC (4.72%), indicating value destruction | Mixed: Higher net margin at 17.8%, ROIC (4.14%) still below WACC (5.3%), slight value destruction but improving profitability |
| Innovation | Limited visible innovation investment; traditional utility model dominates | Limited innovation noted; steady focus on energy infrastructure with incremental growth |
| Global presence | Primarily regional U.S. utility, limited global exposure | Regional U.S. presence, focused mainly on Wisconsin and Illinois markets |
| Market Share | Strong in New York utility market with stable electricity revenues | Strong presence in Wisconsin, growing Illinois market share, expanding infrastructure |
Key takeaways: Both companies exhibit moderate diversification and solid regional market shares but face challenges in generating returns above their cost of capital. WEC shows a slight edge with improving profitability trends, while ED struggles with declining ROIC. Neither company demonstrates strong innovation or global reach, suggesting cautious evaluation for growth-oriented investors.
Risk Analysis
Below is a comparative table summarizing key risk factors for Consolidated Edison, Inc. (ED) and WEC Energy Group, Inc. (WEC) as of 2024.
| Metric | Consolidated Edison, Inc. (ED) | WEC Energy Group, Inc. (WEC) |
|---|---|---|
| Market Risk | Low beta (0.38) indicates low volatility | Moderate beta (0.57) suggests moderate volatility |
| Debt level | Debt-to-Equity 1.27 (unfavorable), Interest Coverage 2.8 (neutral) | Debt-to-Equity 1.64 (unfavorable), Interest Coverage 3.14 (neutral) |
| Regulatory Risk | High, due to extensive regulated electric and gas operations in NYC and NY State | High, operates regulated utilities across multiple states with diverse energy sources |
| Operational Risk | Moderate, relies on aging infrastructure with transmission and distribution lines | Moderate, large network with mixed energy sources, some reliance on fossil fuels |
| Environmental Risk | Moderate, with investments in renewables but still gas and steam services | Moderate to high, diverse energy mix including coal and oil, transitioning to renewables |
| Geopolitical Risk | Low, mainly US operations concentrated in NY/NJ region | Low, primarily US Midwest operations, less exposed internationally |
The most impactful risks for both companies are their high regulatory exposures and debt levels. Both operate in highly regulated electric and gas markets where regulatory changes can affect profitability. Notably, their Altman Z-scores place them in the distress zone, signaling financial vulnerability, especially due to leverage. Operational risks tied to aging infrastructure and environmental challenges from fossil fuel dependence remain concerns amid energy transition pressures. Caution and close monitoring of regulatory developments and debt management are advisable for investors.
Which Stock to Choose?
Consolidated Edison, Inc. (ED) shows favorable income growth with a 24.65% revenue increase over five years and solid gross and net margins. Its financial ratios reveal a mixed picture, with favorable net margin but unfavorable ROE and ROIC, alongside moderate debt levels. The company carries a very favorable rating but exhibits a very unfavorable MOAT due to declining ROIC below WACC.
WEC Energy Group, Inc. (WEC) presents favorable income metrics, including a 18.76% revenue growth over five years and strong EBIT and net margins. Financial ratios indicate good profitability and moderate debt, though liquidity ratios are unfavorable. The rating is very favorable, and the MOAT is slightly unfavorable, reflecting improving profitability despite ROIC below WACC.
For investors prioritizing growth and improving profitability, WEC’s increasing ROIC and stronger income statement growth might appear more attractive. Conversely, those valuing a historically stable income profile may find ED’s consistent margins and very favorable rating relevant, despite its declining economic moat. The choice could hinge on tolerance for value erosion versus preference for growth trends.
Disclaimer: Investment carries a risk of loss of initial capital. The past performance is not a reliable indicator of future results. Be sure to understand risks before making an investment decision.
Go Further
I encourage you to read the complete analyses of Consolidated Edison, Inc. and WEC Energy Group, Inc. to enhance your investment decisions: