In the evolving landscape of regulated electric utilities, The Southern Company (SO) and Consolidated Edison, Inc. (ED) stand out as prominent players with significant market presence and innovation strategies. Both companies operate extensive electricity and gas distribution networks, serving millions of customers in key U.S. regions. This comparison explores their operational strengths and growth potential to help investors identify which stock might offer the best opportunity in today’s utility sector. Let’s dive into the details to find the most compelling choice for your portfolio.
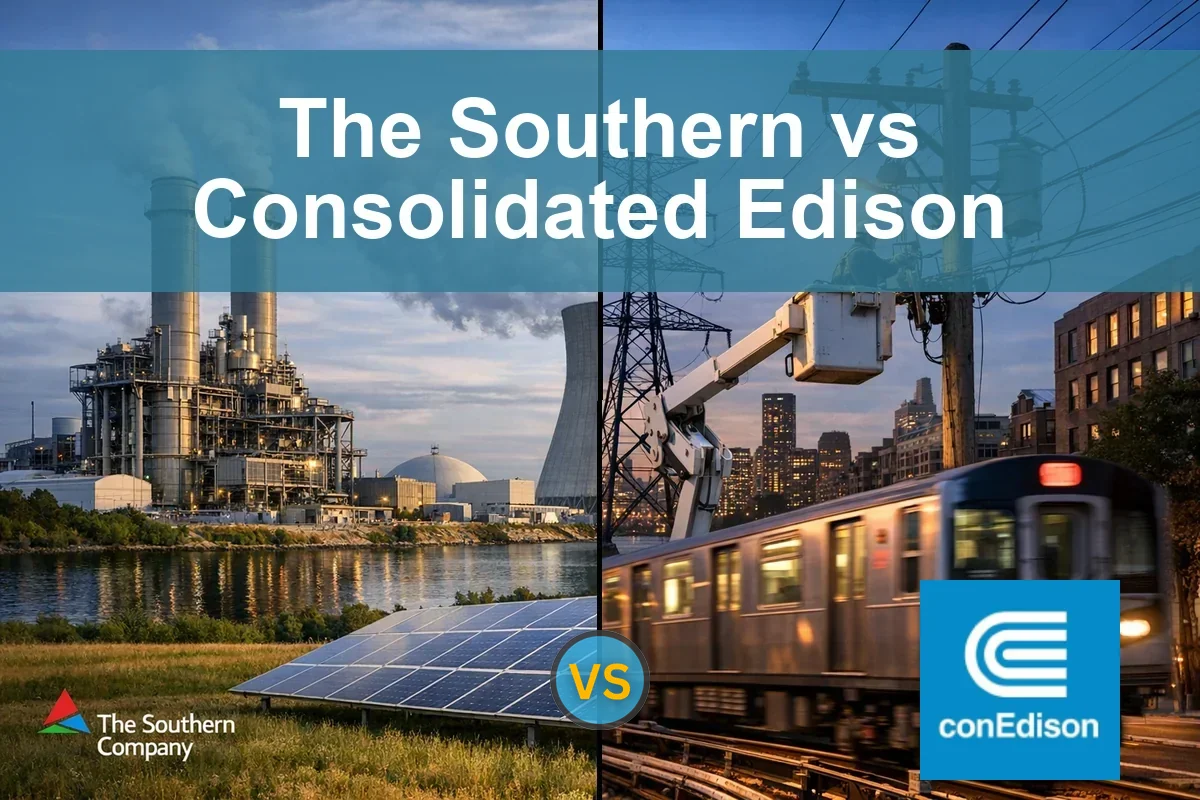
Table of contents
Companies Overview
I will begin the comparison between The Southern Company and Consolidated Edison, Inc. by providing an overview of these two companies and their main differences.
The Southern Company Overview
The Southern Company, headquartered in Atlanta, Georgia, operates in the regulated electric industry, focusing on electricity generation, transmission, and distribution. It serves approximately 8.7M electric and gas utility customers and manages a diverse energy portfolio including fossil fuel, nuclear, hydroelectric, solar, and wind facilities. The company also provides natural gas services and digital communications, emphasizing broad energy infrastructure and renewable projects.
Consolidated Edison, Inc. Overview
Consolidated Edison, based in New York City, serves about 3.5M electric, 1.1M gas, and 1,555 steam customers primarily in New York and parts of New Jersey. It operates a comprehensive network of transmission and distribution lines and substations, focusing on regulated electric, gas, and steam delivery. The company also invests in renewable energy and energy infrastructure projects, catering mainly to residential, commercial, industrial, and government clients.
Key similarities and differences
Both companies operate in the regulated electric utilities sector and invest in renewable energy and infrastructure development. Southern Company is larger by market cap (approximately $95.7B versus $35.8B for Consolidated Edison) and serves more customers across multiple states, while Consolidated Edison focuses more on urban markets with electric, gas, and steam services. Southern Company has a broader energy mix, including nuclear and various renewables, compared to Consolidated Edison’s more concentrated regional utility operations.
Income Statement Comparison
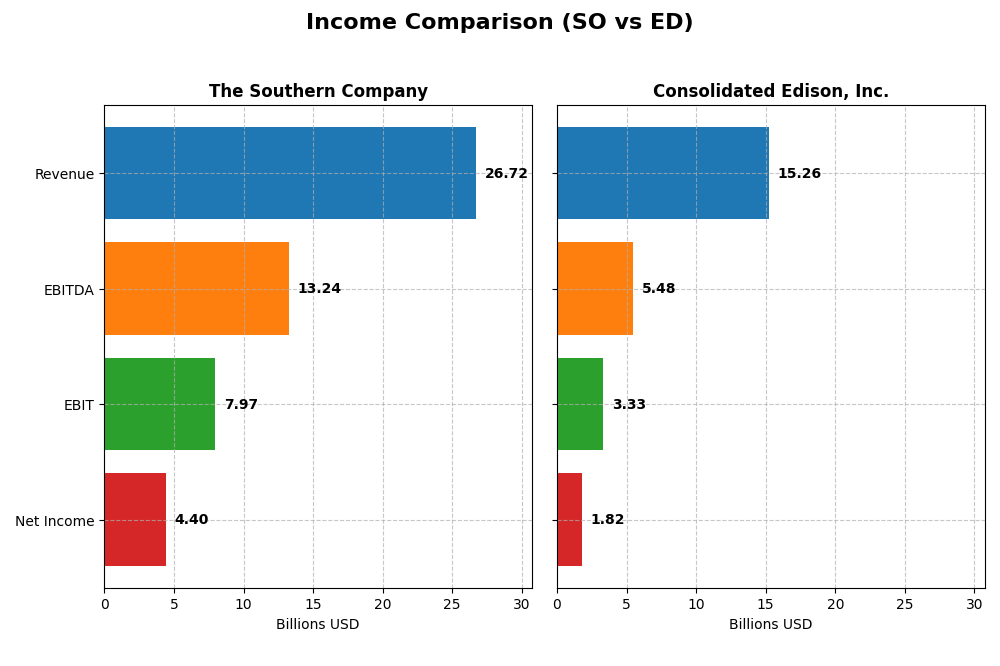
The table below compares key income statement metrics for The Southern Company and Consolidated Edison, Inc. for the fiscal year 2024.
| Metric | The Southern Company | Consolidated Edison, Inc. |
|---|---|---|
| Market Cap | 95.7B | 35.8B |
| Revenue | 26.7B | 15.3B |
| EBITDA | 13.2B | 5.5B |
| EBIT | 7.97B | 3.33B |
| Net Income | 4.40B | 1.82B |
| EPS | 4.02 | 5.26 |
| Fiscal Year | 2024 | 2024 |
Income Statement Interpretations
The Southern Company
The Southern Company exhibited steady revenue growth from 20.4B in 2020 to 26.7B in 2024, with net income rising from 3.1B to 4.4B over the same period. Margins generally improved, particularly gross margin at nearly 50% and EBIT margin close to 30%. The 2024 year showed moderate revenue growth of 5.8% and a favorable 17.4% EBIT increase, indicating strengthened profitability despite slightly unfavorable operating expense trends.
Consolidated Edison, Inc.
Consolidated Edison’s revenue increased from 12.2B in 2020 to 15.3B in 2024, while net income grew from 1.1B to 1.8B. Gross margin was notably strong at 64%, though EBIT margin was lower at about 22%. The latest year saw a 4.2% revenue rise but a 17.5% decline in EBIT and a sharp 30.6% net margin contraction, reflecting operational challenges and margin pressure despite solid long-term net income growth.
Which one has the stronger fundamentals?
Both companies show favorable overall income statement evaluations with solid revenue and net income growth over five years. The Southern Company demonstrates more consistent margin improvements and a stronger EBIT growth trend recently, although it faces higher interest expenses. Consolidated Edison boasts higher gross margins but struggles with recent profitability declines and margin contraction. The Southern Company’s fundamentals appear more stable, while Consolidated Edison shows mixed short-term signals.
Financial Ratios Comparison
Below is a comparison of key financial ratios for The Southern Company (SO) and Consolidated Edison, Inc. (ED) based on the most recent fiscal year 2024 data.
| Ratios | The Southern Company (SO) | Consolidated Edison, Inc. (ED) |
|---|---|---|
| ROE | 13.3% | 8.3% |
| ROIC | 4.3% | 3.5% |
| P/E | 20.5 | 17.0 |
| P/B | 2.72 | 1.41 |
| Current Ratio | 0.67 | 1.04 |
| Quick Ratio | 0.46 | 0.96 |
| D/E (Debt to Equity) | 2.00 | 1.27 |
| Debt-to-Assets | 45.7% | 39.4% |
| Interest Coverage | 2.58 | 2.30 |
| Asset Turnover | 0.18 | 0.22 |
| Fixed Asset Turnover | 0.25 | 0.29 |
| Payout ratio | 67.1% | 60.4% |
| Dividend yield | 3.27% | 3.56% |
Interpretation of the Ratios
The Southern Company
The Southern Company shows a mixed ratio profile with favorable net margin (16.47%) and dividend yield (3.27%), but unfavorable returns on invested capital (4.25%) and weak liquidity indicated by a current ratio of 0.67. Its debt levels and asset turnover ratios also raise concerns. The company maintains a steady dividend payout, supported by free cash flow, though some caution is warranted due to high leverage and liquidity risks.
Consolidated Edison, Inc.
Consolidated Edison presents a moderately balanced ratio set with a favorable net margin (11.93%) and price-to-book ratio (1.41), but weaker returns on equity (8.29%) and invested capital (3.48%). Liquidity ratios are neutral, and debt levels are somewhat high. The dividend yield of 3.56% is supported but should be monitored alongside the company’s moderate leverage and asset efficiency challenges.
Which one has the best ratios?
Both companies face challenges, reflected in their slightly unfavorable global ratio opinions. The Southern Company has stronger profitability and dividend yield but weaker liquidity and asset turnover. Consolidated Edison benefits from better liquidity and valuation metrics but shows weaker returns. Overall, neither company stands out decisively as having the best ratios.
Strategic Positioning
This section compares the strategic positioning of The Southern Company and Consolidated Edison, Inc., including market position, key segments, and exposure to disruption:
The Southern Company
- Large market cap of 95.7B, facing regulated electric sector competition.
- Diversified segments: gas distribution, pipeline investments, wholesale and retail electricity, renewable energy projects.
- Invests in renewables and digital services; operates multiple generation types including hydro, fossil, nuclear, solar, wind, and storage.
Consolidated Edison, Inc.
- Smaller market cap of 35.8B, also in regulated electric sector with local competition.
- Concentrated on regulated electric, gas, steam delivery, plus non-utility products and energy infrastructure investments.
- Owns and operates transmission and distribution lines, renewable projects, and invests in electric and gas transmission.
The Southern Company vs Consolidated Edison, Inc. Positioning
The Southern Company has a diversified business model across gas, electric, and renewables, offering broader exposure to energy segments, while Consolidated Edison focuses on regulated utilities and energy infrastructure, emphasizing localized service delivery and non-utility offerings.
Which has the best competitive advantage?
Both companies are shedding value as ROIC is below WACC; Southern Company shows a slightly unfavorable moat with growing profitability, whereas Consolidated Edison faces a very unfavorable moat with declining profitability.
Stock Comparison
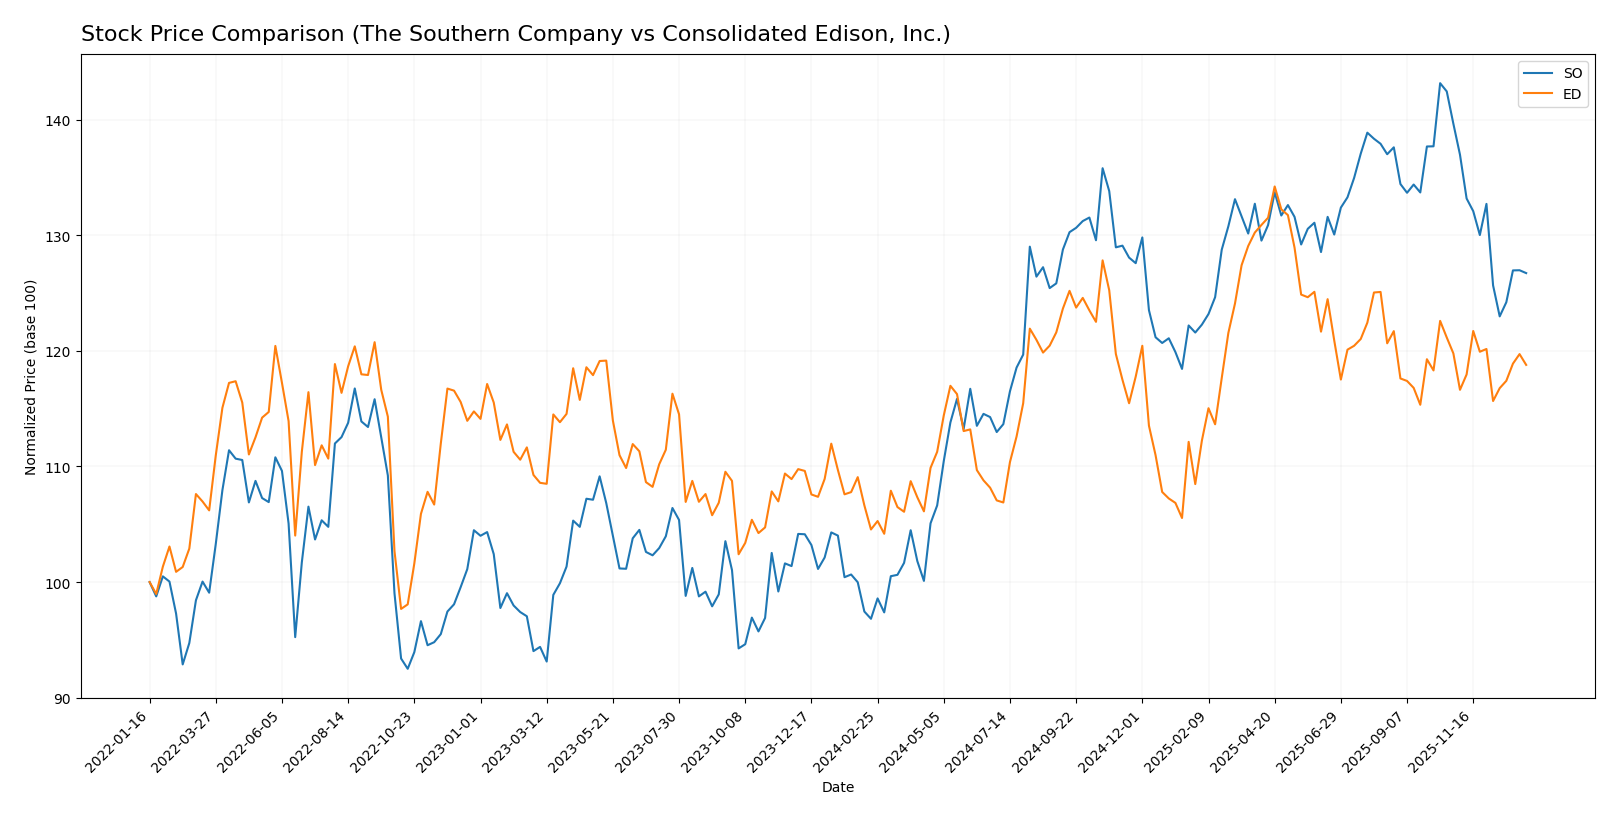
The stock price chart over the past 12 months reveals distinct bullish trends for both The Southern Company and Consolidated Edison, Inc., with notable deceleration and recent short-term weakness in prices.
Trend Analysis
The Southern Company’s stock showed a strong bullish trend over the past year with a 30.88% increase, decelerating toward the end, and experienced a recent 9.25% decline indicating short-term bearish pressure. Consolidated Edison, Inc. posted a 13.62% bullish gain over the year, also decelerating, with a marginal recent drop of 0.83%, reflecting a mostly neutral short-term trend. Comparing both, The Southern Company delivered a higher overall market performance with a more pronounced long-term increase despite recent volatility.
Target Prices
Analysts present a clear target price consensus for The Southern Company and Consolidated Edison, Inc.
| Company | Target High | Target Low | Consensus |
|---|---|---|---|
| The Southern Company | 103 | 76 | 93.1 |
| Consolidated Edison, Inc. | 106 | 86 | 99.86 |
For The Southern Company, the consensus target price of 93.1 USD is moderately above the current price of 87.01 USD, suggesting potential upside. Consolidated Edison’s consensus at 99.86 USD closely aligns with its current price of 99.21 USD, indicating a stable outlook.
Analyst Opinions Comparison
This section compares the analysts’ ratings and financial scores for The Southern Company and Consolidated Edison, Inc.:
Rating Comparison
The Southern Company Rating
- Rating: B-, considered very favorable overall.
- Discounted Cash Flow Score: Moderate at 3, indicating fair valuation.
- ROE Score: Favorable at 4, showing strong profit generation from equity.
- ROA Score: Moderate at 3, reflecting average asset utilization.
- Debt To Equity Score: Very unfavorable at 1, indicating higher financial risk.
- Overall Score: Moderate at 3.
Consolidated Edison, Inc. Rating
- Rating: B-, also considered very favorable overall.
- Discounted Cash Flow Score: Very unfavorable at 1, suggesting potential overvaluation risk.
- ROE Score: Moderate at 3, indicating average efficiency in profit generation.
- ROA Score: Moderate at 3, similar average asset utilization.
- Debt To Equity Score: Moderate at 2, suggesting better financial stability.
- Overall Score: Moderate at 2.
Which one is the best rated?
Based strictly on the provided data, The Southern Company holds a higher overall score (3 vs. 2) and a stronger ROE score (4 vs. 3), despite weaker debt-to-equity. Consolidated Edison has a lower discounted cash flow score and overall score.
Scores Comparison
Here is a comparison of The Southern Company and Consolidated Edison, Inc. based on their financial scores:
SO Scores
- Altman Z-Score: 0.98, in the distress zone, indicating high bankruptcy risk.
- Piotroski Score: 6, categorized as average financial strength.
ED Scores
- Altman Z-Score: 1.19, also in the distress zone, indicating high bankruptcy risk.
- Piotroski Score: 7, categorized as strong financial strength.
Which company has the best scores?
Consolidated Edison, Inc. has slightly better scores with a higher Altman Z-Score (1.19 vs. 0.98) and a stronger Piotroski Score (7 vs. 6) compared to The Southern Company. Both remain in the distress zone for bankruptcy risk.
Grades Comparison
The following presents a detailed comparison of the recent grades assigned to The Southern Company and Consolidated Edison, Inc.:
The Southern Company Grades
This table summarizes the latest grades and actions from reliable grading companies for The Southern Company.
| Grading Company | Action | New Grade | Date |
|---|---|---|---|
| UBS | Maintain | Neutral | 2025-12-17 |
| JP Morgan | Maintain | Neutral | 2025-12-15 |
| Jefferies | Maintain | Neutral | 2025-12-15 |
| RBC Capital | Maintain | Sector Perform | 2025-12-12 |
| Keybanc | Maintain | Underweight | 2025-12-12 |
| Mizuho | Maintain | Neutral | 2025-12-11 |
| Barclays | Maintain | Equal Weight | 2025-11-20 |
| Jefferies | Downgrade | Neutral | 2025-11-05 |
| Ladenburg Thalmann | Downgrade | Neutral | 2025-10-17 |
| Keybanc | Maintain | Underweight | 2025-10-15 |
The Southern Company’s grades predominantly reflect a neutral or hold stance, with no recent upgrades and some downgrades from buy ratings.
Consolidated Edison, Inc. Grades
This table lists the recent grades and actions from credible grading companies for Consolidated Edison, Inc.
| Grading Company | Action | New Grade | Date |
|---|---|---|---|
| UBS | Maintain | Neutral | 2026-01-07 |
| UBS | Maintain | Neutral | 2025-12-17 |
| Keybanc | Maintain | Underweight | 2025-12-12 |
| JP Morgan | Maintain | Underweight | 2025-12-12 |
| Barclays | Maintain | Underweight | 2025-11-10 |
| Barclays | Maintain | Underweight | 2025-10-22 |
| Morgan Stanley | Maintain | Underweight | 2025-10-22 |
| Barclays | Maintain | Underweight | 2025-10-21 |
| Keybanc | Maintain | Underweight | 2025-10-15 |
| Morgan Stanley | Maintain | Underweight | 2025-09-25 |
Consolidated Edison’s grades consistently indicate an underweight rating, with no upgrades or changes over recent months.
Which company has the best grades?
The Southern Company holds predominantly neutral and hold ratings with some previous buy downgrades, while Consolidated Edison consistently carries underweight grades. This suggests The Southern Company has received comparatively better grades, potentially indicating a more favorable market perception among analysts, which investors might consider when assessing risk and opportunity.
Strengths and Weaknesses
Below is a comparison of key strengths and weaknesses of The Southern Company (SO) and Consolidated Edison, Inc. (ED) based on their latest financial data and market positions.
| Criterion | The Southern Company (SO) | Consolidated Edison, Inc. (ED) |
|---|---|---|
| Diversification | Moderate: Focused on gas distribution and electric utilities with some exposure to gas marketing and pipelines. | Moderate: Primarily electricity with significant oil and gas purchased and steam services. |
| Profitability | Moderate profitability with net margin at 16.47%, but ROIC (4.25%) below WACC (4.96%), indicating value destruction. | Lower profitability: net margin 11.93%, ROIC (3.48%) below WACC (4.72%), with declining profitability trend. |
| Innovation | Limited innovation focus; steady growth in ROIC but overall slightly unfavorable moat status. | Limited innovation; ROIC declining, very unfavorable moat status. |
| Global presence | Primarily US-focused with strong regional market share in Southeast. | US-focused, mainly New York and surrounding areas; no significant global footprint. |
| Market Share | Strong regional market share in gas and electricity distribution. | Strong local market share in electricity and steam in New York region. |
Key takeaways: Both SO and ED face challenges with profitability as their ROIC lags behind cost of capital, indicating value destruction. SO shows improving profitability trends, while ED’s profitability is declining. Both companies have moderate diversification and strong regional market shares but limited innovation and global presence. Caution and rigorous risk management are advised when considering investments in these utilities.
Risk Analysis
Below is a comparison of key risks for The Southern Company (SO) and Consolidated Edison, Inc. (ED) based on the most recent data from 2024:
| Metric | The Southern Company (SO) | Consolidated Edison, Inc. (ED) |
|---|---|---|
| Market Risk | Moderate (Beta 0.447) | Moderate (Beta 0.379) |
| Debt level | High (Debt-to-Equity 2.0, Very Unfavorable) | Elevated (Debt-to-Equity 1.27, Unfavorable) |
| Regulatory Risk | Moderate (Utilities sector, regulated environment) | Moderate (Regulated utility, NYC area) |
| Operational Risk | Moderate (Large asset base with varied facilities) | Moderate (Extensive infrastructure in urban area) |
| Environmental Risk | Moderate (Mixed fuel sources including fossil fuels and renewables) | Moderate (Urban infrastructure, renewable investments) |
| Geopolitical Risk | Low (US-based operations) | Low (US-based operations) |
The most impactful risk for both companies is their elevated debt levels, with Southern Company showing a particularly high debt-to-equity ratio, increasing financial vulnerability. Both firms operate in heavily regulated markets, posing ongoing compliance and policy risks. Market risk remains moderate given their low beta values, indicating less volatility relative to the market. Operational and environmental risks are manageable but require attention due to infrastructure complexity and energy transition pressures.
Which Stock to Choose?
The Southern Company (SO) shows a favorable income statement with steady revenue and net income growth over 2020–2024, supported by a moderate ROE of 13.25% and a favorable dividend yield of 3.27%. However, it faces challenges with high debt levels and several unfavorable financial ratios, resulting in a slightly unfavorable overall ratio evaluation and a very favorable B- rating.
Consolidated Edison, Inc. (ED) presents a favorable income statement overall, though recent profitability metrics show declines. It has a lower ROE of 8.29%, a slightly better debt profile, and more favorable valuation ratios such as P/B at 1.41. ED’s financial ratios are slightly unfavorable overall, paired with a very favorable B- rating but a very unfavorable discounted cash flow score.
For risk-averse investors seeking stable dividend income and steady growth, SO’s improving profitability and dividend yield might appear more attractive despite higher leverage. Conversely, investors focused on value investing or those with tolerance for earnings volatility might see ED’s stronger balance sheet metrics and valuation ratios as potentially favorable. The contrasting trends in ROIC and profitability suggest differing risk and return profiles aligned with investor priorities.
Disclaimer: Investment carries a risk of loss of initial capital. The past performance is not a reliable indicator of future results. Be sure to understand risks before making an investment decision.
Go Further
I encourage you to read the complete analyses of The Southern Company and Consolidated Edison, Inc. to enhance your investment decisions: