Investors looking into the regulated electric utility sector will find Public Service Enterprise Group Incorporated (PEG) and Consolidated Edison, Inc. (ED) two compelling contenders. Both companies operate primarily in the Northeastern U.S., providing essential electricity and gas services while advancing renewable energy initiatives. Their overlapping markets and innovation strategies make them ideal for comparison. In this article, I will analyze which company offers the most attractive investment opportunity for your portfolio.
Table of contents
Companies Overview
I will begin the comparison between Public Service Enterprise Group Incorporated and Consolidated Edison, Inc. by providing an overview of these two companies and their main differences.
Public Service Enterprise Group Incorporated Overview
Public Service Enterprise Group Incorporated (PEG) operates as an energy company primarily in the Northeastern and Mid-Atlantic United States. Its mission includes transmitting and distributing electricity and gas, investing in solar generation projects, and promoting energy efficiency. The company manages extensive electric and gas infrastructure, serving residential, commercial, and industrial customers, positioning itself as a key player in regulated electric utilities.
Consolidated Edison, Inc. Overview
Consolidated Edison, Inc. (ED) provides regulated electric, gas, and steam delivery services mainly in New York City and surrounding areas. It serves millions of customers across electric, gas, and steam segments, emphasizing the operation and development of renewable and energy infrastructure projects. ED’s broad customer base includes industrial, commercial, residential, and government clients, underscoring its integral role in regional energy supply.
Key similarities and differences
Both PEG and ED operate in the regulated electric utility industry within the US, focusing on electricity and gas distribution to residential and commercial customers. While PEG emphasizes solar projects and energy efficiency programs in the Northeastern and Mid-Atlantic regions, ED has a broader service offering including steam delivery and a significant presence in New York City with investments in renewable infrastructure. Both companies manage vast transmission and distribution networks but differ in geographic focus and service scope.
Income Statement Comparison
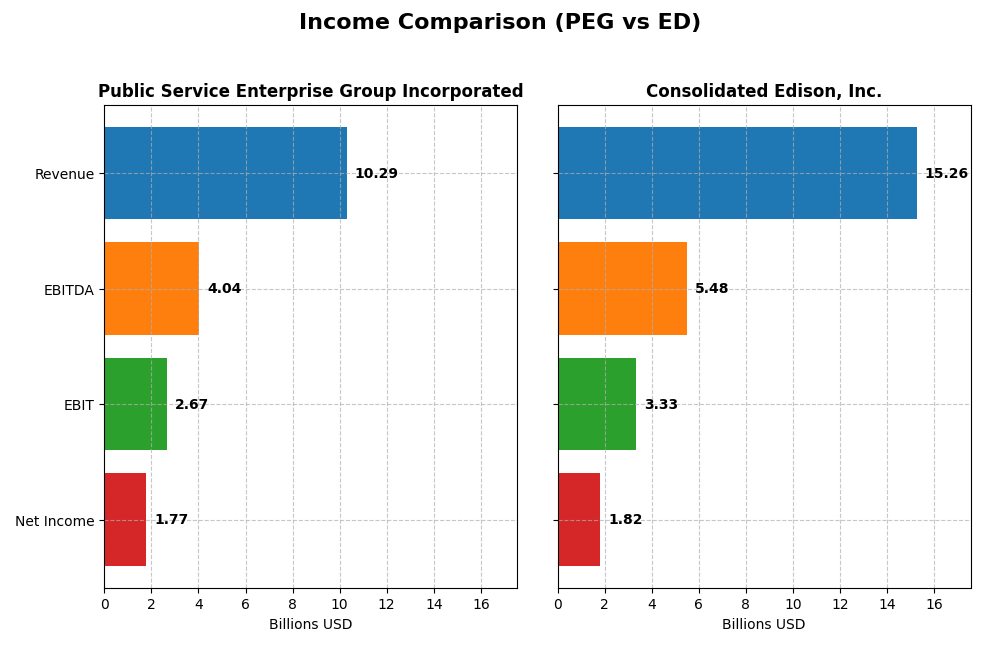
The table below compares the key income statement metrics for Public Service Enterprise Group Incorporated (PEG) and Consolidated Edison, Inc. (ED) for the fiscal year 2024.
| Metric | Public Service Enterprise Group Incorporated (PEG) | Consolidated Edison, Inc. (ED) |
|---|---|---|
| Market Cap | 39.3B | 35.8B |
| Revenue | 10.3B | 15.3B |
| EBITDA | 4.04B | 5.48B |
| EBIT | 2.67B | 3.33B |
| Net Income | 1.77B | 1.82B |
| EPS | 3.56 | 5.26 |
| Fiscal Year | 2024 | 2024 |
Income Statement Interpretations
Public Service Enterprise Group Incorporated
Public Service Enterprise Group (PEG) showed a modest overall revenue growth of 7.15% from 2020 to 2024, but net income declined by nearly 7%. Margins deteriorated, with net margin shrinking by 13.19%. The 2024 fiscal year saw revenue drop 8.43% and net income fall 30.99%, reflecting weakening profitability and margin compression.
Consolidated Edison, Inc.
Consolidated Edison (ED) demonstrated stronger fundamentals with a 24.65% revenue increase and a 65.3% net income growth over the 2020-2024 period. Margins improved significantly, including a 32.61% rise in net margin. However, in 2024, growth slowed slightly as revenue rose 4.16% but net margin and EPS declined sharply by over 27%.
Which one has the stronger fundamentals?
Consolidated Edison exhibits stronger fundamentals, supported by higher revenue and net income growth alongside improved margins over the period. Conversely, Public Service Enterprise Group faces unfavorable trends, with declining profitability and shrinking margins. Despite recent setbacks for ED, its overall financial trajectory is more positive than PEG’s.
Financial Ratios Comparison
This table presents a side-by-side comparison of key financial ratios for Public Service Enterprise Group Incorporated (PEG) and Consolidated Edison, Inc. (ED) based on their most recent fiscal year data for 2024.
| Ratios | Public Service Enterprise Group Inc. (PEG) | Consolidated Edison, Inc. (ED) |
|---|---|---|
| ROE | 10.99% | 8.29% |
| ROIC | 4.40% | 3.48% |
| P/E | 23.74 | 16.96 |
| P/B | 2.61 | 1.41 |
| Current Ratio | 0.65 | 1.04 |
| Quick Ratio | 0.48 | 0.96 |
| D/E (Debt-to-Equity) | 1.42 | 1.27 |
| Debt-to-Assets | 41.89% | 39.43% |
| Interest Coverage | 2.80 | 2.30 |
| Asset Turnover | 0.19 | 0.22 |
| Fixed Asset Turnover | 0.26 | 0.29 |
| Payout Ratio | 67.49% | 60.44% |
| Dividend Yield | 2.84% | 3.56% |
Interpretation of the Ratios
Public Service Enterprise Group Incorporated
Public Service Enterprise Group shows a mixed ratio profile with strong net margin (17.22%, favorable) but weak liquidity (current ratio 0.65, unfavorable) and leverage (debt-to-equity 1.42, unfavorable). Return on equity is neutral at 11%, while return on invested capital is low at 4.4%. The dividend yield is favorable at 2.84%, reflecting consistent payouts supported by moderate free cash flow, though capital structure risks persist.
Consolidated Edison, Inc.
Consolidated Edison displays a balanced ratio set with a favorable net margin of 11.93% and solid dividend yield of 3.56%. Liquidity ratios are neutral (current ratio 1.04), though debt metrics show some concerns with debt-to-equity at 1.27 (unfavorable). Returns on equity and capital employed are slightly weak, and asset turnover ratios are also unfavorable, indicating room for operational efficiency improvements.
Which one has the best ratios?
Between the two, Consolidated Edison has a slightly more favorable ratio distribution, with higher dividend yield and better liquidity, despite some leverage concerns. Public Service Enterprise Group faces greater liquidity and leverage challenges but offers a stronger net margin. Both companies have slightly unfavorable global ratio opinions, reflecting balanced strengths and weaknesses.
Strategic Positioning
This section compares the strategic positioning of PEG and ED, including their market position, key segments, and exposure to technological disruption:
Public Service Enterprise Group Incorporated (PEG)
- Strong regional presence in Northeastern and Mid-Atlantic US with regulated electric industry focus; moderate competitive pressure.
- Key segments include electric and gas distribution, transmission, and solar generation investments; major revenue from Public Service Electric and Gas Company.
- Invests in solar generation projects and energy efficiency programs, showing some adaptation to technological shifts in energy.
Consolidated Edison, Inc. (ED)
- Serves New York City area with regulated electric, gas, and steam businesses; faces competitive pressure typical of regulated utilities.
- Key segments cover electricity, oil and gas purchasing, steam, and non-utility products and services; large customer base in NYC and Westchester.
- Owns and develops renewable energy and energy infrastructure projects; invests in electric and gas transmission projects but exposed to traditional energy delivery.
PEG vs ED Positioning
PEG demonstrates a diversified revenue base with focus on electric, gas, and renewable segments, while ED concentrates on electric, gas, and steam delivery with additional non-utility products. PEG’s approach offers broader segment exposure; ED’s is more regionally concentrated.
Which has the best competitive advantage?
Both PEG and ED are currently shedding value with ROIC below WACC; however, PEG’s profitability shows improvement, whereas ED’s profitability is declining, indicating PEG’s competitive advantage is slightly stronger despite challenges.
Stock Comparison
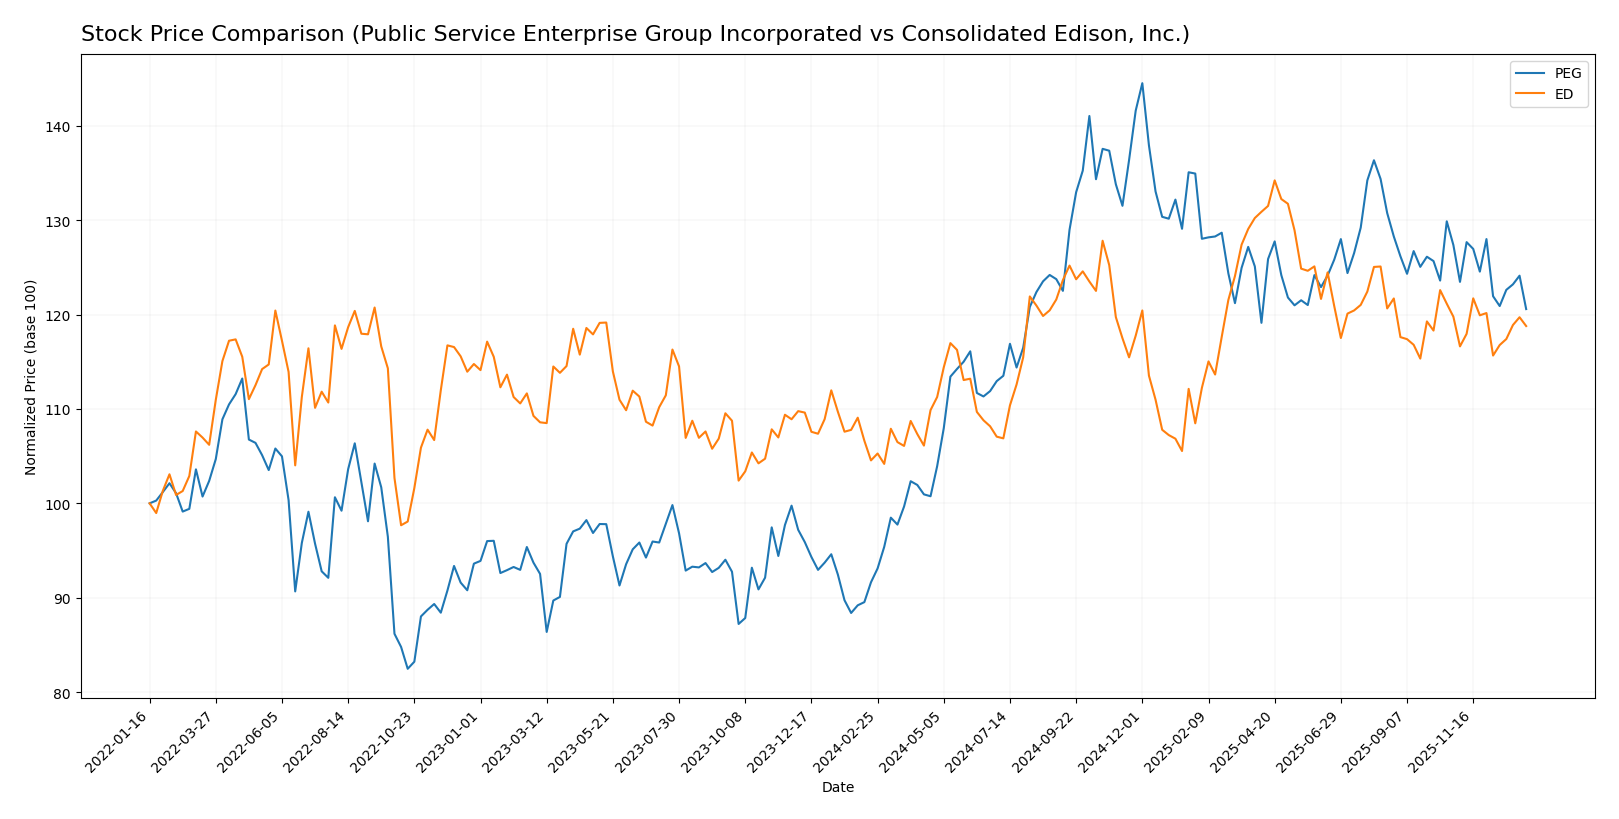
The stock price movements of Public Service Enterprise Group Incorporated (PEG) and Consolidated Edison, Inc. (ED) over the past year reveal significant bullish trends with decelerating momentum, alongside contrasting buyer-seller dynamics in recent trading sessions.
Trend Analysis
Public Service Enterprise Group Incorporated (PEG) experienced a 31.59% price increase over the past 12 months, marking a bullish trend with deceleration and notable volatility (7.17 std deviation). The stock peaked at 94.3 and bottomed at 59.79.
Consolidated Edison, Inc. (ED) showed a 13.62% price rise over the same period, also bullish with deceleration and moderate volatility (6.0 std deviation). Its highest and lowest prices were 112.1 and 87.01 respectively.
Comparing both, PEG delivered the highest market performance, outperforming ED by a substantial margin in annual price appreciation.
Target Prices
Analysts present a confident target price consensus for both Public Service Enterprise Group Incorporated and Consolidated Edison, Inc.
| Company | Target High | Target Low | Consensus |
|---|---|---|---|
| Public Service Enterprise Group Incorporated | 98 | 83 | 89 |
| Consolidated Edison, Inc. | 106 | 86 | 99.86 |
The target consensus prices suggest moderate upside potential from current prices of $78.68 for PEG and $99.21 for ED, reflecting generally positive analyst expectations.
Analyst Opinions Comparison
This section compares analysts’ ratings and grades for Public Service Enterprise Group Incorporated (PEG) and Consolidated Edison, Inc. (ED):
Rating Comparison
PEG Rating
- Rating: B-, considered very favorable by analysts.
- Discounted Cash Flow Score: 1, indicating a very unfavorable assessment.
- ROE Score: 4, a favorable score showing strong profit generation efficiency.
- ROA Score: 4, favorable, indicating good asset utilization.
- Debt To Equity Score: 2, moderate level of financial risk.
- Overall Score: 3, moderate overall financial standing.
ED Rating
- Rating: B-, also rated very favorable by analysts.
- Discounted Cash Flow Score: 1, similarly very unfavorable.
- ROE Score: 3, moderate score reflecting average profit generation efficiency.
- ROA Score: 3, moderate, showing average asset utilization.
- Debt To Equity Score: 2, also moderate financial risk.
- Overall Score: 2, moderate but lower than PEG’s overall score.
Which one is the best rated?
Based strictly on the provided data, PEG holds a higher overall score of 3 compared to ED’s 2, with stronger ROE and ROA scores, indicating PEG is rated better in terms of profitability and asset use, despite both sharing the same rating grade.
Scores Comparison
Here is a comparison of the Altman Z-Score and Piotroski Score for both companies:
PEG Scores
- Altman Z-Score: 1.32, indicating financial distress risk.
- Piotroski Score: 7, showing strong financial health.
ED Scores
- Altman Z-Score: 1.19, indicating financial distress risk.
- Piotroski Score: 7, showing strong financial health.
Which company has the best scores?
Both PEG and ED have identical Piotroski Scores of 7, signaling strong financial health. Their Altman Z-Scores are close but both fall in the distress zone, indicating elevated bankruptcy risk for each.
Grades Comparison
The following is a comparison of the latest available grades from reputable sources for both companies:
Public Service Enterprise Group Incorporated Grades
Below are the recent grades assigned by recognized financial institutions for Public Service Enterprise Group Incorporated:
| Grading Company | Action | New Grade | Date |
|---|---|---|---|
| Ladenburg Thalmann | Buy | Buy | 2026-01-07 |
| UBS | Maintain | Buy | 2025-12-17 |
| JP Morgan | Maintain | Overweight | 2025-12-12 |
| Jefferies | Upgrade | Buy | 2025-11-06 |
| TD Cowen | Maintain | Buy | 2025-11-05 |
| BMO Capital | Maintain | Market Perform | 2025-11-04 |
| Barclays | Maintain | Equal Weight | 2025-10-21 |
| BMO Capital | Maintain | Market Perform | 2025-10-20 |
| Morgan Stanley | Maintain | Overweight | 2025-09-25 |
| BMO Capital | Maintain | Market Perform | 2025-08-06 |
The overall grade trend for Public Service Enterprise Group Incorporated shows a predominance of “Buy” and “Overweight” ratings, indicating a generally positive outlook from analysts.
Consolidated Edison, Inc. Grades
Below are the recent grades assigned by reputable grading firms for Consolidated Edison, Inc.:
| Grading Company | Action | New Grade | Date |
|---|---|---|---|
| UBS | Maintain | Neutral | 2026-01-07 |
| UBS | Maintain | Neutral | 2025-12-17 |
| Keybanc | Maintain | Underweight | 2025-12-12 |
| JP Morgan | Maintain | Underweight | 2025-12-12 |
| Barclays | Maintain | Underweight | 2025-11-10 |
| Barclays | Maintain | Underweight | 2025-10-22 |
| Morgan Stanley | Maintain | Underweight | 2025-10-22 |
| Barclays | Maintain | Underweight | 2025-10-21 |
| Keybanc | Maintain | Underweight | 2025-10-15 |
| Morgan Stanley | Maintain | Underweight | 2025-09-25 |
Consolidated Edison, Inc. exhibits a consistent “Underweight” and “Neutral” rating pattern, reflecting a cautious or less optimistic stance by analysts.
Which company has the best grades?
Public Service Enterprise Group Incorporated has received significantly stronger grades, mostly “Buy” and “Overweight,” compared to Consolidated Edison, Inc.’s “Underweight” and “Neutral” ratings. This difference suggests that investors may view Public Service Enterprise Group as having better growth or value potential relative to Consolidated Edison.
Strengths and Weaknesses
The table below summarizes key strengths and weaknesses of Public Service Enterprise Group Incorporated (PEG) and Consolidated Edison, Inc. (ED) based on their latest financial and operational data.
| Criterion | Public Service Enterprise Group (PEG) | Consolidated Edison (ED) |
|---|---|---|
| Diversification | Moderate: Revenue primarily from electric and gas distribution with some contract revenues and transmission segments | Moderate: Revenue mainly from electricity, oil & gas purchased, steam, and non-utility services |
| Profitability | Moderate net margin at 17.22%, ROIC 4.4% (unfavorable vs WACC 5.37%), trend improving but still value shedding | Lower net margin at 11.93%, ROIC 3.48% (unfavorable vs WACC 4.72%), declining profitability and value destruction |
| Innovation | Limited disclosed innovation focus, steady ROIC growth suggests operational improvements | Limited innovation evidence, declining ROIC implies challenges in efficiency or market adaptation |
| Global presence | Primarily US-focused with strong regional utility operations | Also US-centric, focused on New York area utilities, limited global footprint |
| Market Share | Strong regional presence in New Jersey and Pennsylvania utilities | Leading utility in New York metro area, solid market position |
Key takeaways: PEG shows signs of improving profitability despite current value destruction, benefiting from a growing ROIC trend. ED faces more pronounced challenges with declining profitability and value loss. Both companies have moderate diversification and strong regional market positions but limited innovation and global exposure. Careful risk management is advised given current financial trends.
Risk Analysis
Below is a comparison of key risks for Public Service Enterprise Group Incorporated (PEG) and Consolidated Edison, Inc. (ED) based on the latest data from 2024.
| Metric | Public Service Enterprise Group (PEG) | Consolidated Edison (ED) |
|---|---|---|
| Market Risk | Beta 0.61 (moderate market sensitivity) | Beta 0.38 (low market sensitivity) |
| Debt level | Debt-to-Equity 1.42 (unfavorable) | Debt-to-Equity 1.27 (unfavorable) |
| Regulatory Risk | High, due to regulated electric utility sector | High, similar regulated utilities exposure |
| Operational Risk | Moderate, with extensive infrastructure to maintain | Moderate, large network with aging assets |
| Environmental Risk | Medium, investing in solar but exposed to fossil fuel transition risks | Medium, also investing in renewables but facing stricter local regulations |
| Geopolitical Risk | Low, primarily domestic US operations | Low, primarily domestic US operations |
The most impactful risks for both PEG and ED stem from their high regulatory exposure in the utility sector and elevated debt levels, which may constrain financial flexibility. PEG’s slightly higher beta suggests a bit more market risk, while both companies show signs of financial stress with Altman Z-Scores in the distress zone, indicating vulnerability to adverse economic conditions. Investors should weigh these risks carefully against stable dividend yields and strong operational footprints.
Which Stock to Choose?
Public Service Enterprise Group Incorporated (PEG) shows a mixed financial profile with declining income growth and profitability over recent years. Its financial ratios reveal several unfavorable metrics such as a low current ratio (0.65) and high net debt to EBITDA ratio (5.64), though it maintains a favorable net margin (17.22%) and dividend yield (2.84%). The company’s rating is very favorable (B-), but overall ratios and income statement evaluations are slightly to clearly unfavorable, with a moat status indicating value destruction despite improving profitability.
Consolidated Edison, Inc. (ED) demonstrates more stable income growth with favorable overall income statement metrics, including a strong gross margin (63.99%) and positive long-term net income growth. Financial ratios are slightly more favorable than PEG’s, with a neutral current ratio (1.04) and moderate debt levels, alongside a very favorable rating (B-). However, its moat evaluation is very unfavorable, reflecting declining profitability and value destruction, although it maintains a strong Piotroski score.
Considering these factors, investors focused on growth and income quality might find ED’s consistent profitability and favorable income statements more appealing, while those willing to tolerate some financial risks might view PEG’s improving profitability and higher net margin as potential opportunities. Risk-averse investors may prefer companies with more stable liquidity ratios, which currently favors ED.
Disclaimer: Investment carries a risk of loss of initial capital. The past performance is not a reliable indicator of future results. Be sure to understand risks before making an investment decision.
Go Further
I encourage you to read the complete analyses of Public Service Enterprise Group Incorporated and Consolidated Edison, Inc. to enhance your investment decisions: