Consolidated Edison, Inc. (ED) and PPL Corporation (PPL) are two prominent players in the regulated electric utility sector, each serving millions of customers across key U.S. regions. Both companies emphasize innovation in energy infrastructure and sustainable power solutions, making them direct competitors with overlapping market footprints. This article will analyze their strengths and risks to help you decide which company offers the most compelling investment opportunity in 2026.
Table of contents
Companies Overview
I will begin the comparison between Consolidated Edison, Inc. and PPL Corporation by providing an overview of these two companies and their main differences.
Consolidated Edison, Inc. Overview
Consolidated Edison, Inc. operates in the regulated electric, gas, and steam delivery sectors in the US. It provides electric services to about 3.5M customers in New York City and Westchester County, and gas to 1.1M customers in parts of New York. The company also manages extensive transmission and distribution infrastructure, and invests in renewable and energy projects. Founded in 1823, it is headquartered in New York City.
PPL Corporation Overview
PPL Corporation is a utility holding company delivering electricity and natural gas in the US and UK. It serves over 2.7M electric and gas customers across Kentucky, Pennsylvania, and parts of Virginia. The company generates electricity from coal, gas, hydro, and solar sources and sells wholesale electricity to municipalities. Founded in 1920, PPL is based in Allentown, Pennsylvania.
Key similarities and differences
Both companies operate in the regulated electric utility industry, serving millions of customers primarily in the US. Consolidated Edison focuses on electric, gas, and steam services with a strong presence in New York, while PPL has a broader geographic footprint including the UK and diverse power generation methods. Consolidated Edison manages more extensive infrastructure, whereas PPL emphasizes electricity generation from multiple sources.
Income Statement Comparison
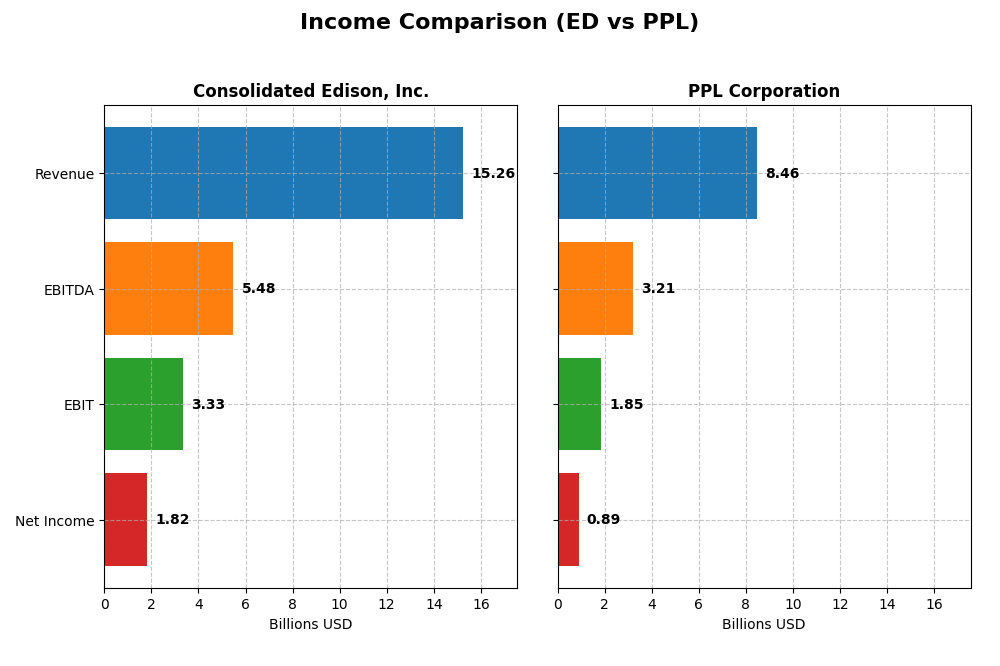
The table below compares the key income statement metrics of Consolidated Edison, Inc. and PPL Corporation for the fiscal year 2024, providing a snapshot of their financial performance.
| Metric | Consolidated Edison, Inc. | PPL Corporation |
|---|---|---|
| Market Cap | 35.8B | 25.6B |
| Revenue | 15.3B | 8.5B |
| EBITDA | 5.48B | 3.21B |
| EBIT | 3.33B | 1.85B |
| Net Income | 1.82B | 888M |
| EPS | 5.26 | 1.20 |
| Fiscal Year | 2024 | 2024 |
Income Statement Interpretations
Consolidated Edison, Inc.
Consolidated Edison’s revenue showed a favorable 24.65% growth over 2020-2024, reaching $15.26B in 2024. Net income followed a positive trend, increasing by 65.3% overall, though it declined by 27.32% in the latest year to $1.82B. Margins remain generally strong, with a gross margin near 64%, but EBIT and net margin contracted in 2024, signaling pressure on profitability.
PPL Corporation
PPL’s revenue expanded by 54.59% over the five-year span, reaching $8.46B in 2024, but net income decreased sharply by 39.55%, falling to $886M. Despite this, margins remain stable, with a gross margin around 40% and EBIT margin about 22%. The recent year showed improvements in EBIT and net margin, indicating some operational recovery despite overall net income challenges.
Which one has the stronger fundamentals?
Consolidated Edison exhibits stronger fundamentals with higher revenue, net income, and gross margin levels, alongside favorable long-term growth in income and margins. PPL’s revenue growth is more pronounced, but its net income and margin trends are less favorable. Both companies share a generally favorable income statement profile, yet Consolidated Edison’s overall profitability and margin stability are comparatively stronger.
Financial Ratios Comparison
Below is a comparative table of key financial ratios for Consolidated Edison, Inc. (ED) and PPL Corporation (PPL) based on their most recent fiscal year 2024 data. These ratios provide insights into profitability, valuation, liquidity, leverage, efficiency, and dividend metrics.
| Ratios | Consolidated Edison, Inc. (ED) | PPL Corporation (PPL) |
|---|---|---|
| ROE | 8.29% | 6.31% |
| ROIC | 3.48% | 3.59% |
| P/E | 16.96 | 26.97 |
| P/B | 1.41 | 1.70 |
| Current Ratio | 1.04 | 0.86 |
| Quick Ratio | 0.96 | 0.71 |
| D/E (Debt to Equity) | 1.27 | 1.19 |
| Debt-to-Assets | 39.43% | 40.92% |
| Interest Coverage | 2.30 | 2.36 |
| Asset Turnover | 0.22 | 0.21 |
| Fixed Asset Turnover | 0.29 | 0.26 |
| Payout Ratio | 60.44% | 84.12% |
| Dividend Yield | 3.56% | 3.12% |
Interpretation of the Ratios
Consolidated Edison, Inc.
Consolidated Edison shows a mixed ratio profile with favorable net margin (11.93%) and dividend yield (3.56%), supported by a reasonable payout. However, its return on equity (8.29%) and return on invested capital (3.48%) are unfavorable, alongside a concerning debt-to-equity ratio of 1.27. Dividend payments appear sustainable, though leverage warrants caution.
PPL Corporation
PPL Corporation’s ratios present more weaknesses, including an unfavorable return on equity (6.31%) and a high price-to-earnings ratio (26.97), indicating potential overvaluation. Liquidity ratios such as the current ratio (0.86) and quick ratio (0.71) are also unfavorable. The company maintains a dividend yield of 3.12%, yet the high leverage and liquidity concerns may affect sustainability.
Which one has the best ratios?
Consolidated Edison has a slightly more favorable ratio profile with stronger margins and dividend yield, despite some leverage and efficiency concerns. PPL exhibits more unfavorable metrics, including weaker profitability, liquidity, and higher valuation multiples, resulting in a less favorable overall ratio assessment.
Strategic Positioning
This section compares the strategic positioning of Consolidated Edison, Inc. (ED) and PPL Corporation (PPL), focusing on market position, key segments, and exposure to technological disruption:
Consolidated Edison, Inc. (ED)
- Leading regulated electric and gas utility in New York with significant transmission infrastructure.
- Diverse business driven by electricity, oil and gas purchases, steam, and non-utility products.
- No explicit details on technological disruption exposure provided.
PPL Corporation (PPL)
- Utility holding company operating in U.S. and U.K. with regional regulated segments.
- Revenue mainly from regulated electric segments in Kentucky, Pennsylvania, and Rhode Island.
- No explicit details on technological disruption exposure provided.
ED vs PPL Positioning
ED has a geographically concentrated but diversified utility business with multiple energy service lines, while PPL operates a more regionally segmented utility portfolio with a focus on regulated electricity. ED’s broader product mix contrasts with PPL’s focused regional segments, reflecting differing strategic models.
Which has the best competitive advantage?
Both companies are shedding value as ROIC remains below WACC; however, PPL shows improving profitability trends while ED’s returns decline, indicating PPL’s moat status is slightly less unfavorable than ED’s very unfavorable position.
Stock Comparison
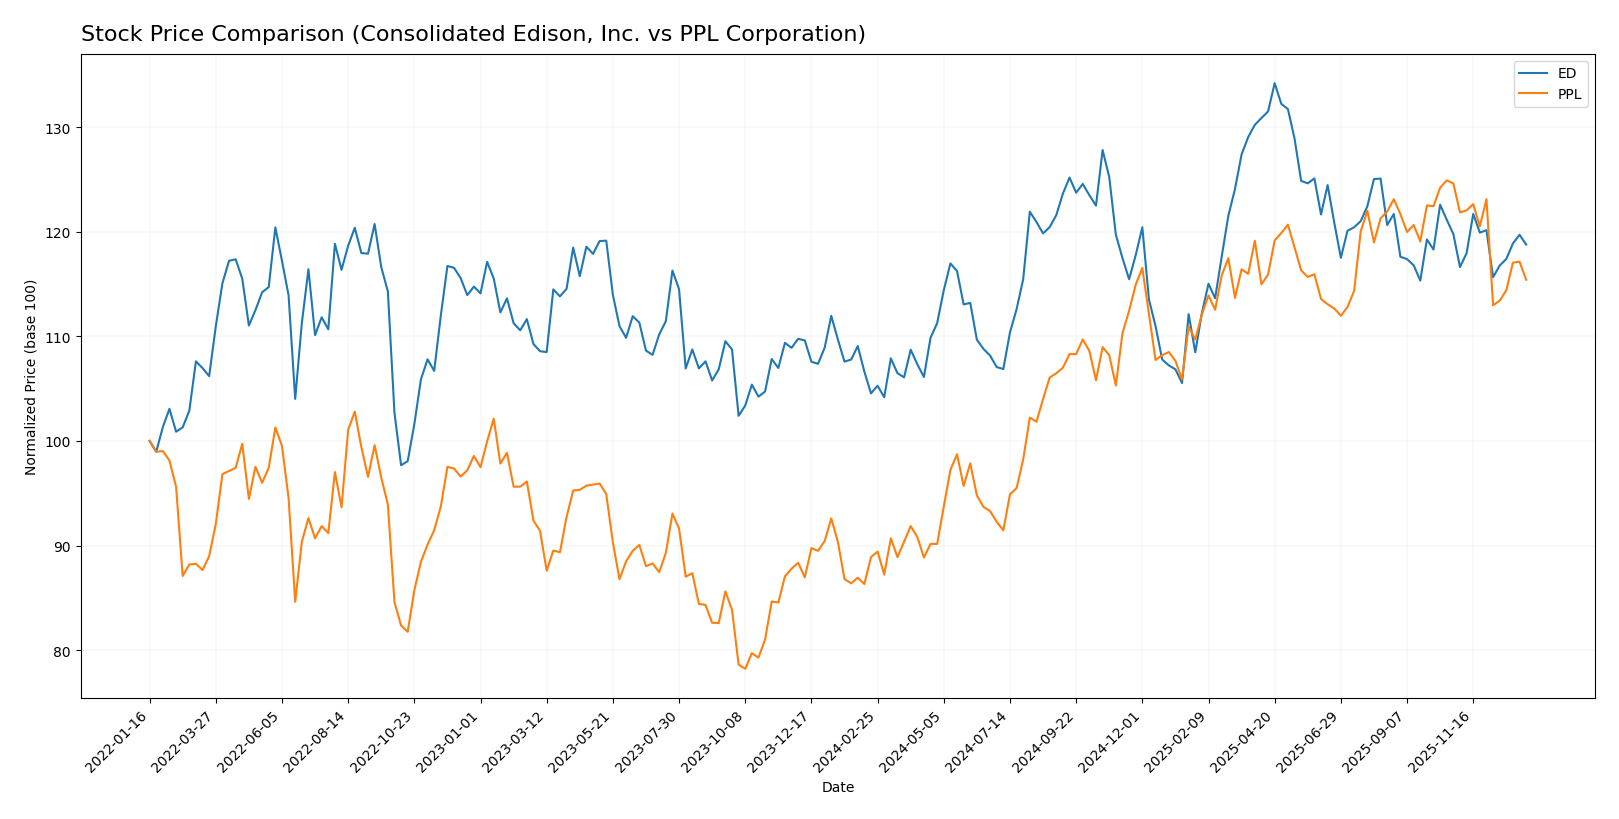
The stock prices of Consolidated Edison, Inc. (ED) and PPL Corporation (PPL) have shown notable bullish trends over the past 12 months, with both experiencing deceleration in momentum and varying recent declines in price.
Trend Analysis
Consolidated Edison, Inc. (ED) exhibited a 13.62% price increase over the past year, indicating a bullish trend with deceleration. The stock ranged from a low of 87.01 to a high of 112.1, showing moderate volatility (6.0 std deviation). Recent weeks show a slight negative slope (-0.04) and a small -0.83% price decline.
PPL Corporation (PPL) recorded a stronger bullish trend with a 29.84% gain over the same period, also with deceleration. Its price fluctuated between 26.14 and 37.44, with lower volatility (3.24 std deviation). However, recent activity reveals a sharper -7.39% drop and a steeper negative slope (-0.26).
Comparing the two, PPL delivered the higher market performance over the past 12 months despite a more pronounced recent decline, while ED showed a smaller overall gain with more stable recent price behavior.
Target Prices
Analysts present a clear target price consensus for Consolidated Edison, Inc. and PPL Corporation.
| Company | Target High | Target Low | Consensus |
|---|---|---|---|
| Consolidated Edison, Inc. | 106 | 86 | 99.86 |
| PPL Corporation | 45 | 36 | 41.29 |
The target consensus for Consolidated Edison, Inc. is slightly above its current price of 99.21 USD, indicating moderate upside potential. PPL Corporation’s consensus target of 41.29 USD is notably higher than its current price of 34.59 USD, suggesting a more optimistic outlook from analysts.
Analyst Opinions Comparison
This section compares analysts’ ratings and grades for Consolidated Edison, Inc. (ED) and PPL Corporation (PPL):
Rating Comparison
ED Rating
- Rating: B-, considered very favorable by analysts.
- Discounted Cash Flow Score: 1, indicating a very unfavorable valuation based on future cash flow.
- ROE Score: 3, a moderate score reflecting average efficiency in generating profit from equity.
- ROA Score: 3, moderate, indicating average asset utilization for earnings.
- Debt To Equity Score: 2, moderate, suggesting average financial risk from debt levels.
- Overall Score: 2, moderate overall financial standing.
PPL Rating
- Rating: C+, also considered very favorable by analysts.
- Discounted Cash Flow Score: 1, similarly very unfavorable valuation based on future cash flow.
- ROE Score: 3, also moderate, showing comparable profit efficiency from equity.
- ROA Score: 3, moderate, similar asset utilization effectiveness.
- Debt To Equity Score: 2, moderate, indicating comparable financial risk from debt.
- Overall Score: 2, moderate overall financial standing as well.
Which one is the best rated?
Based strictly on the provided data, ED holds a slightly better rating (B-) compared to PPL’s C+, though both share identical scores across key financial metrics and overall scores, reflecting similar moderate assessments.
Scores Comparison
Here is a comparison of the Altman Z-Score and Piotroski Score for both companies:
ED Scores
- Altman Z-Score: 1.19, indicating financial distress zone.
- Piotroski Score: 7, classified as strong financial health.
PPL Scores
- Altman Z-Score: 0.97, indicating financial distress zone.
- Piotroski Score: 6, classified as average financial health.
Which company has the best scores?
Based on the data, ED has a higher Piotroski Score (7 vs. 6) indicating stronger financial health, while both are in the Altman Z-Score distress zone. ED’s scores suggest relatively better financial strength than PPL.
Grades Comparison
Here is the detailed comparison of recent grades and ratings for Consolidated Edison, Inc. and PPL Corporation:
Consolidated Edison, Inc. Grades
This table shows recent grades assigned by reputable financial institutions for Consolidated Edison, Inc.
| Grading Company | Action | New Grade | Date |
|---|---|---|---|
| UBS | Maintain | Neutral | 2026-01-07 |
| UBS | Maintain | Neutral | 2025-12-17 |
| Keybanc | Maintain | Underweight | 2025-12-12 |
| JP Morgan | Maintain | Underweight | 2025-12-12 |
| Barclays | Maintain | Underweight | 2025-11-10 |
| Barclays | Maintain | Underweight | 2025-10-22 |
| Morgan Stanley | Maintain | Underweight | 2025-10-22 |
| Barclays | Maintain | Underweight | 2025-10-21 |
| Keybanc | Maintain | Underweight | 2025-10-15 |
| Morgan Stanley | Maintain | Underweight | 2025-09-25 |
Overall, Consolidated Edison, Inc. has consistently received neutral to underweight grades, indicating a cautious stance by analysts.
PPL Corporation Grades
Below is a summary of recent grades given by leading grading firms for PPL Corporation.
| Grading Company | Action | New Grade | Date |
|---|---|---|---|
| UBS | Maintain | Neutral | 2025-12-17 |
| Wells Fargo | Maintain | Overweight | 2025-12-12 |
| JP Morgan | Maintain | Overweight | 2025-12-11 |
| BMO Capital | Maintain | Outperform | 2025-10-21 |
| B of A Securities | Maintain | Buy | 2025-10-16 |
| Barclays | Maintain | Equal Weight | 2025-10-14 |
| UBS | Maintain | Neutral | 2025-10-10 |
| Morgan Stanley | Maintain | Overweight | 2025-09-25 |
| Barclays | Maintain | Equal Weight | 2025-07-01 |
| Morgan Stanley | Maintain | Overweight | 2025-06-18 |
PPL Corporation enjoys a generally positive consensus with many overweight, buy, and outperform ratings from respected analysts.
Which company has the best grades?
PPL Corporation has received notably better grades than Consolidated Edison, Inc., with a consensus rating of “Buy” versus “Hold” for Consolidated Edison. This reflects stronger analyst confidence in PPL, potentially indicating better growth or risk-return prospects for investors.
Strengths and Weaknesses
Below is a comparative table summarizing key strengths and weaknesses of Consolidated Edison, Inc. (ED) and PPL Corporation (PPL) based on recent financial and operational data.
| Criterion | Consolidated Edison, Inc. (ED) | PPL Corporation (PPL) |
|---|---|---|
| Diversification | Moderate: Revenue mainly from electricity (10.8B), plus oil & gas and steam segments | Moderate: Focused on regulated utilities in Kentucky, Pennsylvania, and Rhode Island |
| Profitability | Mixed: Net margin favorable at 11.93%, but ROIC (3.48%) below WACC (4.72%) indicates value destruction | Mixed: Net margin favorable at 10.49%, ROIC (3.59%) below WACC (5.5%) but improving trend |
| Innovation | Limited evidence of strong innovation or asset turnover (unfavorable fixed asset turnover 0.29) | Limited innovation, asset turnover also low (0.26) |
| Global presence | Primarily US-based with no significant international exposure | Regional US focus, recently exited UK market |
| Market Share | Strong in New York region with stable electricity sales (~10.8B USD) | Strong presence in specific US states but with less geographic reach |
Key takeaways: Both companies operate in regulated utility sectors with moderate diversification and regional market focus. ED shows slightly better profitability ratios but is currently destroying value with declining returns, while PPL’s profitability is improving despite still shedding value. Innovation and asset efficiency remain challenges for both players.
Risk Analysis
Below is a comparison of key risks for Consolidated Edison, Inc. (ED) and PPL Corporation (PPL) based on the most recent available data for 2024.
| Metric | Consolidated Edison, Inc. (ED) | PPL Corporation (PPL) |
|---|---|---|
| Market Risk | Low beta (0.38) suggests lower volatility versus market | Moderate beta (0.72), higher volatility than ED |
| Debt level | Debt-to-equity 1.27 (unfavorable), interest coverage moderate (2.8) | Debt-to-equity 1.19 (unfavorable), lower interest coverage (2.5) |
| Regulatory Risk | High, operates in heavily regulated New York utility market | High, regulated in multiple US states and UK markets |
| Operational Risk | Extensive infrastructure, risk of outages and maintenance costs | Diverse operations but smaller scale, risk in generation mix and maintenance |
| Environmental Risk | Exposure to transition risks; invests in renewables but still reliant on fossil fuels | Mix of coal, gas, hydro, solar; environmental regulations pose risk |
| Geopolitical Risk | Moderate, mostly US-focused operations | Moderate, exposure to UK adds some geopolitical uncertainty |
Synthesizing these risks, both companies face significant regulatory and environmental risks typical of utilities. ED’s lower market volatility and stronger operational scale provide some cushion. However, both show unfavorable debt levels and moderate interest coverage, increasing financial risk. ED’s Altman Z-score in the distress zone signals caution on bankruptcy risk despite a strong Piotroski score. PPL’s even lower Z-score and average Piotroski indicate higher financial vulnerability. Investors should carefully weigh regulatory and financial risks before investing.
Which Stock to Choose?
Consolidated Edison, Inc. (ED) shows a favorable income statement with solid gross and net margins, though recent profitability growth is negative. Its financial ratios are slightly unfavorable overall, reflecting moderate profitability and a moderately high debt load. The company holds a very favorable rating but suffers from a very unfavorable moat due to declining ROIC below WACC.
PPL Corporation (PPL) presents a favorable income statement with improving recent profitability and revenue growth, despite overall negative net income trends over five years. Its financial ratios are generally unfavorable, with a higher debt burden and weaker liquidity. PPL’s rating is very favorable, while its moat is slightly unfavorable but features an improving ROIC trend.
For investors, ED might appear more suitable for those prioritizing stability given its consistent income performance and strong rating despite value erosion. Conversely, PPL could be more appealing to investors seeking growth potential, as indicated by improving profitability and ROIC, despite higher financial risk. Thus, the choice could depend on the investor’s risk tolerance and strategy focus.
Disclaimer: Investment carries a risk of loss of initial capital. The past performance is not a reliable indicator of future results. Be sure to understand risks before making an investment decision.
Go Further
I encourage you to read the complete analyses of Consolidated Edison, Inc. and PPL Corporation to enhance your investment decisions: