In the evolving landscape of regulated electric utilities, Consolidated Edison, Inc. (ED) and Pinnacle West Capital Corporation (PNW) stand out as key players with significant regional footprints and innovation strategies. Both companies serve millions of customers and invest in diverse energy sources, including renewables, making them strong contenders in the utilities sector. This article will help you decide which company presents the most compelling opportunity for your investment portfolio.
Table of contents
Companies Overview
I will begin the comparison between Consolidated Edison, Inc. and Pinnacle West Capital Corporation by providing an overview of these two companies and their main differences.
Consolidated Edison, Inc. Overview
Consolidated Edison, Inc. operates primarily in regulated electric, gas, and steam delivery businesses across New York City and surrounding areas. Serving millions of customers, it manages extensive transmission and distribution infrastructure and invests in renewable energy projects. Founded in 1823, the company maintains a strong foothold in the utilities sector with a focus on delivering reliable energy services to residential, commercial, industrial, and government clients.
Pinnacle West Capital Corporation Overview
Pinnacle West Capital Corporation provides retail and wholesale electric services mainly in Arizona through its subsidiary, Arizona Public Service Company. It operates a diverse mix of generation facilities including coal, nuclear, gas, oil, and solar, along with extensive transmission and distribution networks. Incorporated in 1985, Pinnacle West serves approximately 1.3 million customers and manages over 6,300 megawatts of regulated generation capacity, focusing on reliable electricity provision within a regulated market.
Key similarities and differences
Both companies operate in the regulated electric utility sector and focus on transmission, distribution, and generation of electricity to serve residential and commercial customers. Consolidated Edison has a broader geographic footprint including gas and steam services, while Pinnacle West concentrates on electric services in Arizona with a more diversified energy generation mix. Pinnacle West is smaller by market capitalization and employee count but manages a significant generation capacity compared to Con Edison’s larger customer base and infrastructure scale.
Income Statement Comparison
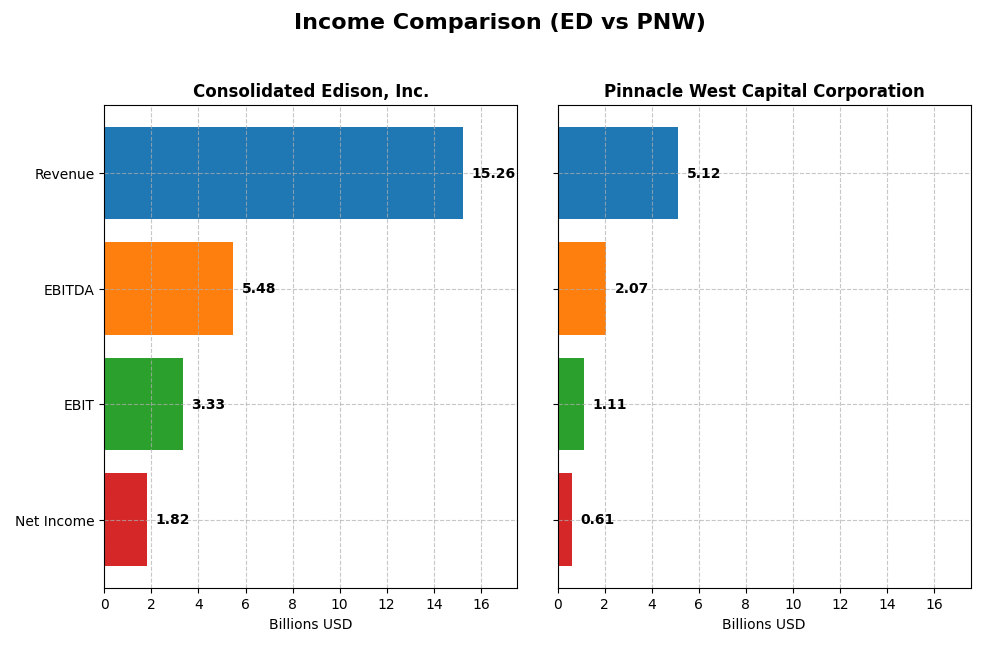
Below is a comparison of key income statement metrics for Consolidated Edison, Inc. and Pinnacle West Capital Corporation for the fiscal year 2024.
| Metric | Consolidated Edison, Inc. (ED) | Pinnacle West Capital Corporation (PNW) |
|---|---|---|
| Market Cap | 35.8B | 10.7B |
| Revenue | 15.3B | 5.1B |
| EBITDA | 5.5B | 2.1B |
| EBIT | 3.3B | 1.1B |
| Net Income | 1.8B | 609M |
| EPS | 5.26 | 5.35 |
| Fiscal Year | 2024 | 2024 |
Income Statement Interpretations
Consolidated Edison, Inc.
Consolidated Edison showed a 24.65% revenue increase and a 65.3% net income growth from 2020 to 2024, with generally favorable margin trends. Gross margin stood strong at 63.99%, and net margin improved by 32.61% overall. However, in 2024, revenue growth slowed to 4.16%, and net margin, EBIT, and EPS declined, indicating recent profitability pressures.
Pinnacle West Capital Corporation
Pinnacle West exhibited a 42.88% revenue growth and a 10.58% net income rise over the five-year period. Margins remained favorable, with gross margin at 41.7% and EBIT margin near 21.74%. The 2024 fiscal year showed robust momentum, with 9.13% revenue growth, 20.17% EBIT increase, and positive net margin and EPS expansions, reflecting operational improvements.
Which one has the stronger fundamentals?
Both companies present favorable fundamentals, but Pinnacle West leads in recent growth metrics with stronger one-year revenue, EBIT, net margin, and EPS improvements. Consolidated Edison demonstrates higher long-term net income and margin growth but faces short-term margin contractions. Pinnacle West’s greater consistency in recent profitability gains may indicate comparatively stronger near-term fundamentals.
Financial Ratios Comparison
The table below compares key financial ratios for Consolidated Edison, Inc. (ED) and Pinnacle West Capital Corporation (PNW) based on the most recent fiscal year 2024 data.
| Ratios | Consolidated Edison, Inc. (ED) | Pinnacle West Capital Corporation (PNW) |
|---|---|---|
| ROE | 8.29% | 9.01% |
| ROIC | 3.48% | 3.48% |
| P/E | 16.96 | 15.85 |
| P/B | 1.41 | 1.43 |
| Current Ratio | 1.04 | 0.59 |
| Quick Ratio | 0.96 | 0.42 |
| D/E (Debt-to-Equity) | 1.27 | 1.64 |
| Debt-to-Assets | 39.4% | 42.3% |
| Interest Coverage | 2.30 | 2.68 |
| Asset Turnover | 0.22 | 0.20 |
| Fixed Asset Turnover | 0.29 | 0.25 |
| Payout ratio | 60.4% | 64.8% |
| Dividend yield | 3.56% | 4.09% |
Interpretation of the Ratios
Consolidated Edison, Inc. (ED)
The financial ratios for Consolidated Edison show a mixed profile with a net margin of 11.93% marked favorable, while return on equity (8.29%) and return on invested capital (3.48%) are unfavorable. The company maintains a neutral current ratio around 1.04 but a slightly high debt-to-equity ratio of 1.27 presents some risk. Dividend yield stands at 3.56%, supported by consistent payouts, though free cash flow coverage is negative, indicating potential sustainability concerns.
Pinnacle West Capital Corporation (PNW)
Pinnacle West exhibits similar strengths with a favorable net margin of 11.88% but also unfavorable returns on equity (9.01%) and invested capital (3.48%). Liquidity ratios are weaker, with current and quick ratios below 1, reflecting potential short-term liquidity constraints. Debt levels are elevated with a debt-to-equity ratio of 1.64. The dividend yield is higher at 4.09%, yet free cash flow trends suggest caution on the sustainability of distributions and buybacks.
Which one has the best ratios?
Both companies share comparable strengths and weaknesses, with favorable net margins and dividend yields but unfavorable returns and liquidity ratios. Pinnacle West shows slightly more unfavorable ratios overall, especially in liquidity and leverage. Consolidated Edison, while still slightly unfavorable overall, has somewhat better liquidity and a lower debt-to-equity ratio, suggesting a marginally stronger financial ratio profile.
Strategic Positioning
This section compares the strategic positioning of Consolidated Edison, Inc. (ED) and Pinnacle West Capital Corporation (PNW), focusing on Market position, Key segments, and Exposure to technological disruption:
Consolidated Edison, Inc.
- Leading regulated electric utility in NY metro area facing moderate competition
- Diverse revenue from electricity, oil and gas purchasing, steam, and non-utility services
- Operates renewable and energy infrastructure projects, invests in transmission, moderate disruption exposure
Pinnacle West Capital Corporation
- Regional regulated electric utility primarily serving Arizona with local competition
- Concentrated revenue mainly from electric service, transmission, and wholesale energy
- Uses coal, nuclear, gas, oil, solar generation; exposed to energy transition pressures
Consolidated Edison, Inc. vs Pinnacle West Capital Corporation Positioning
ED maintains a diversified business across multiple energy segments and regions, offering a broad customer base but complexity. PNW focuses on electric generation and distribution in Arizona, concentrating risks but simplifying operations. Each approach carries inherent advantages and challenges based on scale and market focus.
Which has the best competitive advantage?
Both companies exhibit very unfavorable MOATs with declining ROIC trends, indicating value destruction and limited competitive advantage in efficiently using invested capital over recent years. Neither currently shows a strong economic moat.
Stock Comparison
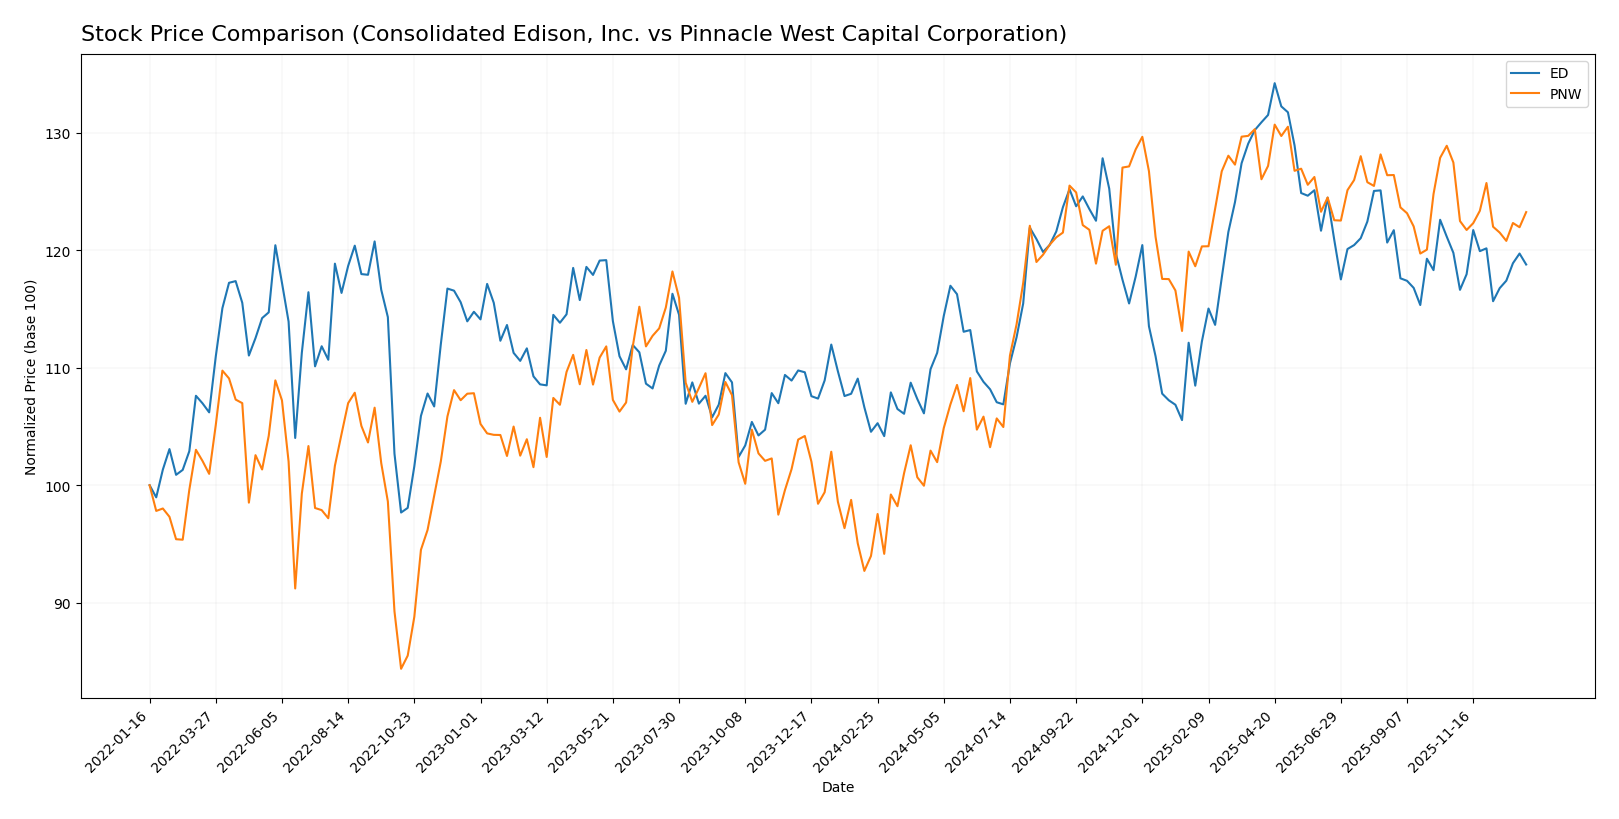
The stock price movements of Consolidated Edison, Inc. (ED) and Pinnacle West Capital Corporation (PNW) over the past 12 months reveal distinct bullish trends with decelerating momentum, highlighted by notable highs and recent slight declines in price.
Trend Analysis
Consolidated Edison, Inc. (ED) experienced a bullish trend over the last year, with a 13.62% price increase and decelerating momentum. Its price ranged from a low of 87.01 to a high of 112.1, with moderate volatility (6.0 std deviation).
Pinnacle West Capital Corporation (PNW) showed a stronger bullish trend with a 31.14% price rise over the same period, also decelerating. The stock fluctuated between 67.92 and 94.45, exhibiting slightly higher volatility (6.87 std deviation).
Comparing the two, PNW delivered the highest market performance with a 31.14% gain versus ED’s 13.62%, despite both showing recent short-term price declines.
Target Prices
Analyst consensus shows moderate upside potential for both Consolidated Edison, Inc. and Pinnacle West Capital Corporation.
| Company | Target High | Target Low | Consensus |
|---|---|---|---|
| Consolidated Edison, Inc. | 106 | 86 | 99.86 |
| Pinnacle West Capital Corporation | 115 | 85 | 96.33 |
The target consensus for Consolidated Edison slightly exceeds its current price of 99.21 USD, indicating cautious optimism. Pinnacle West’s consensus at 96.33 USD also suggests potential price appreciation from its current 89.07 USD trading level.
Analyst Opinions Comparison
This section compares analysts’ ratings and grades for Consolidated Edison, Inc. (ED) and Pinnacle West Capital Corporation (PNW):
Rating Comparison
ED Rating
- Rating: B-, considered very favorable overall.
- Discounted Cash Flow Score: 1, marked as very unfavorable.
- ROE Score: 3, indicating moderate performance.
- ROA Score: 3, showing moderate asset utilization.
- Debt To Equity Score: 2, moderate financial risk.
- Overall Score: 2, reflecting a moderate overall rating.
PNW Rating
- Rating: C+, also very favorable overall.
- Discounted Cash Flow Score: 1, marked as very unfavorable.
- ROE Score: 3, indicating moderate performance.
- ROA Score: 3, showing moderate asset utilization.
- Debt To Equity Score: 1, very unfavorable financial risk.
- Overall Score: 2, reflecting a moderate overall rating.
Which one is the best rated?
Both companies share the same overall score of 2 and have very unfavorable discounted cash flow scores. ED has a better debt-to-equity score, indicating lower financial risk, while PNW’s rating is slightly lower at C+ versus ED’s B-.
Scores Comparison
Here is a comparison of the Altman Z-Score and Piotroski Score for the two companies:
ED Scores
- Altman Z-Score: 1.19, indicating financial distress.
- Piotroski Score: 7, reflecting strong financial health.
PNW Scores
- Altman Z-Score: 0.73, indicating financial distress.
- Piotroski Score: 4, reflecting average financial health.
Which company has the best scores?
Based on the provided data, ED has a higher Piotroski Score indicating stronger financial health, while both firms are in the Altman Z-Score distress zone, with PNW scoring lower on this measure.
Grades Comparison
Here is a comparison of the latest reliable grades from recognized grading companies for Consolidated Edison, Inc. and Pinnacle West Capital Corporation:
Consolidated Edison, Inc. Grades
The recent grades from leading financial analysts for Consolidated Edison, Inc. are listed below:
| Grading Company | Action | New Grade | Date |
|---|---|---|---|
| UBS | Maintain | Neutral | 2026-01-07 |
| UBS | Maintain | Neutral | 2025-12-17 |
| Keybanc | Maintain | Underweight | 2025-12-12 |
| JP Morgan | Maintain | Underweight | 2025-12-12 |
| Barclays | Maintain | Underweight | 2025-11-10 |
| Barclays | Maintain | Underweight | 2025-10-22 |
| Morgan Stanley | Maintain | Underweight | 2025-10-22 |
| Barclays | Maintain | Underweight | 2025-10-21 |
| Keybanc | Maintain | Underweight | 2025-10-15 |
| Morgan Stanley | Maintain | Underweight | 2025-09-25 |
Overall, Consolidated Edison, Inc. has consistently received underweight and neutral grades, indicating a cautious outlook from analysts.
Pinnacle West Capital Corporation Grades
The recent grades from leading financial analysts for Pinnacle West Capital Corporation are presented below:
| Grading Company | Action | New Grade | Date |
|---|---|---|---|
| UBS | Maintain | Neutral | 2025-12-17 |
| Keybanc | Downgrade | Sector Weight | 2025-12-12 |
| Keybanc | Maintain | Overweight | 2025-10-15 |
| UBS | Maintain | Neutral | 2025-10-10 |
| Barclays | Maintain | Equal Weight | 2025-10-07 |
| Argus Research | Maintain | Buy | 2025-09-30 |
| Morgan Stanley | Maintain | Equal Weight | 2025-09-25 |
| UBS | Maintain | Neutral | 2025-09-12 |
| Mizuho | Downgrade | Neutral | 2025-09-09 |
| Barclays | Maintain | Equal Weight | 2025-08-13 |
The grades for Pinnacle West Capital Corporation range from buy to neutral, showing a mix of moderate optimism and caution among analysts.
Which company has the best grades?
Pinnacle West Capital Corporation generally has better grades, including buy and overweight ratings, compared to Consolidated Edison, Inc.’s mostly underweight and neutral grades. This difference might affect investor sentiment and portfolio positioning by reflecting relatively higher confidence in Pinnacle West’s prospects.
Strengths and Weaknesses
Below is a comparison of key strengths and weaknesses for Consolidated Edison, Inc. (ED) and Pinnacle West Capital Corporation (PNW) based on the latest financial and operational data.
| Criterion | Consolidated Edison, Inc. (ED) | Pinnacle West Capital Corporation (PNW) |
|---|---|---|
| Diversification | Moderate diversification with electricity, oil & gas, steam, and non-utility products | Limited diversification focused mainly on electric and transmission services |
| Profitability | Net margin 11.93% (favorable); ROIC 3.48% (unfavorable); declining ROIC trend | Net margin 11.88% (favorable); ROIC 3.48% (unfavorable); declining ROIC trend |
| Innovation | Limited innovation indicated by stagnant asset turnover and declining ROIC | Similar limited innovation with low asset turnover and declining ROIC |
| Global presence | Primarily US-focused utility operations with no significant global footprint | Primarily US-focused, regional utility provider |
| Market Share | Strong presence in New York utility market with significant electricity revenue (~$10.8B in 2023) | Regional market leader in Arizona with growing electric service revenue (~$2.56B in 2024) |
Key takeaways: Both companies operate primarily in regulated US utility markets with stable but limited diversification. Profitability is under pressure as both show declining ROIC trends and value destruction. ED benefits from larger scale and more diversified segments, while PNW has a more concentrated regional focus. Investors should weigh the stable income profiles against the challenges in growth and innovation.
Risk Analysis
Below is a comparative table highlighting key risks for Consolidated Edison, Inc. (ED) and Pinnacle West Capital Corporation (PNW) based on their most recent financial and operational data from 2024.
| Metric | Consolidated Edison, Inc. (ED) | Pinnacle West Capital Corporation (PNW) |
|---|---|---|
| Market Risk | Low beta (0.38) indicates lower volatility, but utility sector sensitivity remains | Moderate beta (0.54), moderate volatility risk in utility sector |
| Debt level | Debt-to-equity ratio 1.27 (unfavorable), interest coverage moderate (2.8) | Higher debt-to-equity 1.64 (unfavorable), interest coverage moderate (2.95) |
| Regulatory Risk | High due to regulated electric and gas services in NY area | High, regulated electric utility in Arizona with diverse energy mix |
| Operational Risk | Extensive infrastructure (transmission and distribution lines) heightens maintenance risk | Large infrastructure with coal, nuclear, and solar exposure adds complexity |
| Environmental Risk | Transition to renewables ongoing; legacy fossil fuel assets pose risk | Exposure to coal and nuclear generation increases environmental compliance risk |
| Geopolitical Risk | Low, primarily local NY and NJ operations | Low, operations focused in Arizona, limited geopolitical exposure |
In synthesis, both companies face significant regulatory and environmental risks inherent to the regulated electric utility sector, with PNW carrying higher financial leverage and operational complexity. ED’s slightly lower market risk and stronger Piotroski score suggest marginally better financial resilience, but its Altman Z-score in the distress zone signals caution. Investors should weigh these risks carefully, with regulatory changes and debt management being the most impactful factors in 2026.
Which Stock to Choose?
Consolidated Edison, Inc. (ED) shows favorable income statement metrics with a 24.65% revenue growth over five years and a solid net margin of 11.93%. Its financial ratios reveal a slightly unfavorable profile due to moderate leverage (D/E 1.27) and low asset turnover, while its overall rating is very favorable (B-). The company exhibits declining profitability and is classified as a value destroyer based on its ROIC versus WACC analysis.
Pinnacle West Capital Corporation (PNW) demonstrates favorable income growth with 42.88% revenue increase over five years and comparable net margin at 11.88%. Financial ratios indicate a slightly more unfavorable profile, notably weaker liquidity (current ratio 0.59) and higher leverage (D/E 1.64), despite a very favorable rating (C+). Its ROIC trend also declines, signaling value destruction similar to ED.
For investors prioritizing growth potential and stable income, PNW’s stronger revenue growth and recent positive earnings momentum might appear attractive. Conversely, those focused on dividend yield and slightly better financial stability metrics could see ED as more aligned with conservative strategies. Both companies face challenges in profitability sustainability and capital efficiency, suggesting caution.
Disclaimer: Investment carries a risk of loss of initial capital. The past performance is not a reliable indicator of future results. Be sure to understand risks before making an investment decision.
Go Further
I encourage you to read the complete analyses of Consolidated Edison, Inc. and Pinnacle West Capital Corporation to enhance your investment decisions: