In today’s evolving energy landscape, choosing the right utility stock is crucial for investors seeking stability and growth. Consolidated Edison, Inc. (ED) and Oklo Inc. (OKLO) both operate in the regulated electric sector but diverge in scale, innovation, and market approach. While Con Edison boasts a long-established presence in traditional utilities, Oklo pioneers advanced nuclear technology. This article will help you decide which company aligns best with your investment goals.
Table of contents
Companies Overview
I will begin the comparison between Consolidated Edison, Inc. and Oklo Inc. by providing an overview of these two companies and their main differences.
Consolidated Edison, Inc. Overview
Consolidated Edison, Inc. operates in the regulated electric sector, delivering electric, gas, and steam services primarily in New York City and Westchester County. It serves millions of customers and manages extensive transmission and distribution infrastructure. Founded in 1823, the company also invests in renewable energy projects and energy-related products, positioning itself as a longstanding utility provider in the US market.
Oklo Inc. Overview
Oklo Inc. focuses on designing and developing fission power plants to supply reliable, commercial-scale energy in the United States. Additionally, it offers used nuclear fuel recycling services. Founded in 2013 and based in Santa Clara, California, Oklo operates in the regulated electric sector but with a niche in advanced nuclear technology, distinguishing itself as a newer, innovative player in the utilities industry.
Key similarities and differences
Both companies operate within the regulated electric sector and serve US markets, but their business models differ significantly. Consolidated Edison emphasizes traditional electric, gas, and steam delivery with a broad customer base and infrastructure, while Oklo targets advanced nuclear power solutions and fuel recycling with a smaller workforce and a focus on innovation. These differences reflect their contrasting approaches to energy production and service delivery.
Income Statement Comparison
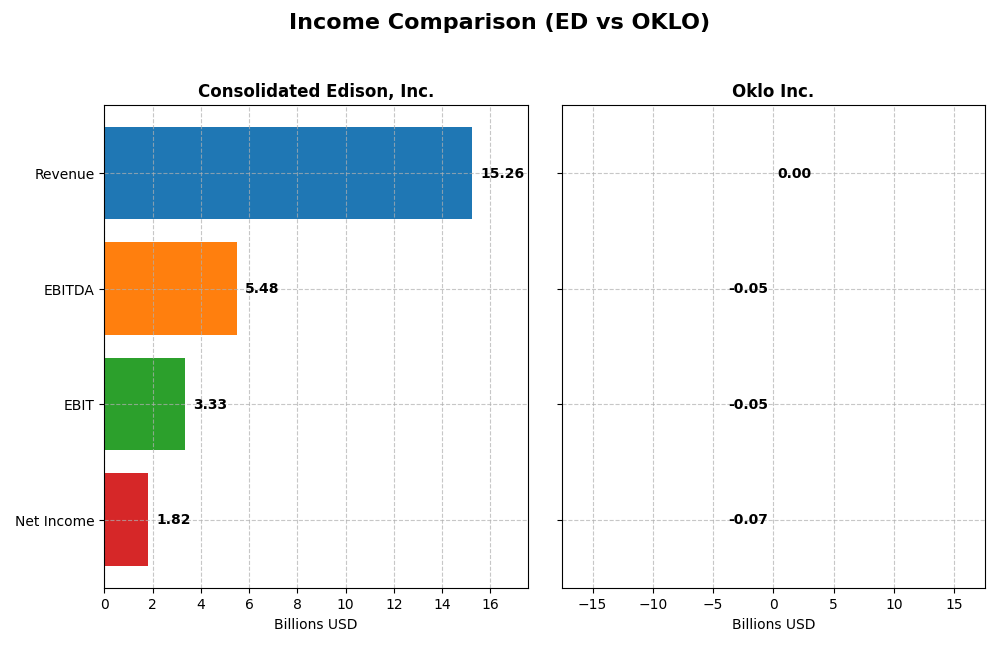
The table below presents a side-by-side comparison of the key income statement metrics for Consolidated Edison, Inc. and Oklo Inc. for the fiscal year 2024.
| Metric | Consolidated Edison, Inc. (ED) | Oklo Inc. (OKLO) |
|---|---|---|
| Market Cap | 35.8B | 16.5B |
| Revenue | 15.3B | 0 |
| EBITDA | 5.48B | -52.5M |
| EBIT | 3.33B | -52.8M |
| Net Income | 1.82B | -73.6M |
| EPS | 5.26 | -0.74 |
| Fiscal Year | 2024 | 2024 |
Income Statement Interpretations
Consolidated Edison, Inc.
From 2020 to 2024, Consolidated Edison, Inc. showed a steady revenue increase of 24.65% and a net income growth of 65.3%, with gross and net margins improving overall. However, in 2024, revenue growth slightly slowed to 4.16%, while EBIT and net income margins declined, indicating some pressure on profitability despite favorable margins.
Oklo Inc.
Oklo Inc. recorded zero revenue from 2021 to 2024, reflecting its early-stage development status. Net income remained negative, worsening to -$73.6M in 2024, with no gross or EBIT margins reported. Operating expenses increased substantially, causing a steep decline in earnings per share and overall unfavorable income statement performance.
Which one has the stronger fundamentals?
Consolidated Edison exhibits stronger fundamentals, with consistent revenue and net income growth, positive margins, and a favorable income statement evaluation. In contrast, Oklo faces significant losses and lacks revenue generation, resulting in an unfavorable income statement profile. These contrasting results highlight the maturity and profitability of Consolidated Edison versus Oklo’s developmental challenges.
Financial Ratios Comparison
This table compares key financial ratios for Consolidated Edison, Inc. (ED) and Oklo Inc. (OKLO) based on their latest fiscal year data available for 2024.
| Ratios | Consolidated Edison, Inc. (ED) | Oklo Inc. (OKLO) |
|---|---|---|
| ROE | 8.29% | -29.35% |
| ROIC | 3.48% | -19.23% |
| P/E | 16.96 | -28.52 |
| P/B | 1.41 | 8.37 |
| Current Ratio | 1.04 | 43.47 |
| Quick Ratio | 0.96 | 43.47 |
| D/E (Debt-to-Equity) | 1.27 | 0.01 |
| Debt-to-Assets | 39.43% | 0.46% |
| Interest Coverage | 2.30 | 0 |
| Asset Turnover | 0.22 | 0 |
| Fixed Asset Turnover | 0.29 | 0 |
| Payout Ratio | 60.44% | 0 |
| Dividend Yield | 3.56% | 0 |
Interpretation of the Ratios
Consolidated Edison, Inc.
Consolidated Edison shows a mix of favorable and unfavorable ratios, with a net margin of 11.93% considered strong, but return on equity (8.29%) and return on invested capital (3.48%) marked as weak. The company maintains a dividend yield of 3.56%, supported by a stable payout, though some leverage and asset turnover metrics raise potential concerns about efficiency and debt levels.
Oklo Inc.
Oklo Inc. displays predominantly unfavorable ratios, including negative returns on equity (-29.35%) and invested capital (-19.23%), reflecting operational challenges. The firm does not pay dividends, consistent with its negative net margin and reinvestment focus in a high-growth phase. While its low debt and strong quick ratio are favorable, lack of profitability and zero dividend yield indicate risk.
Which one has the best ratios?
Consolidated Edison presents a more balanced profile with several favorable ratios and a sustainable dividend yield, despite some weaknesses in returns and efficiency. Oklo’s ratios are mostly unfavorable, reflecting its early development stage and lack of profitability. Overall, Consolidated Edison’s ratios are comparatively stronger and less risky based on the data provided.
Strategic Positioning
This section compares the strategic positioning of Consolidated Edison, Inc. and Oklo Inc., including market position, key segments, and exposure to technological disruption:
Consolidated Edison, Inc.
- Established utility with a 35B market cap, serving regulated electric, gas, and steam markets in New York and New Jersey.
- Key segments include electricity, oil and gas purchased, steam, plus non-utility products and services.
- Operates in a traditional regulated utility space with limited exposure to disruptive technologies.
Oklo Inc.
- Emerging nuclear energy company with a 16.5B market cap focused on designing fission power plants.
- Focused on fission power plants and used nuclear fuel recycling services.
- Engages in nuclear technology development, indicating higher exposure to technological innovation.
Consolidated Edison, Inc. vs Oklo Inc. Positioning
Consolidated Edison has a diversified utility portfolio serving multiple energy segments, leveraging a large, established infrastructure. Oklo is more concentrated on nuclear technology innovation. Consolidated Edison’s scale offers market stability, while Oklo’s focus targets emerging energy solutions with higher technological risk.
Which has the best competitive advantage?
Both companies show a very unfavorable MOAT status with declining ROIC and value destruction. Neither currently demonstrates a sustainable competitive advantage based on their return on invested capital versus cost of capital.
Stock Comparison
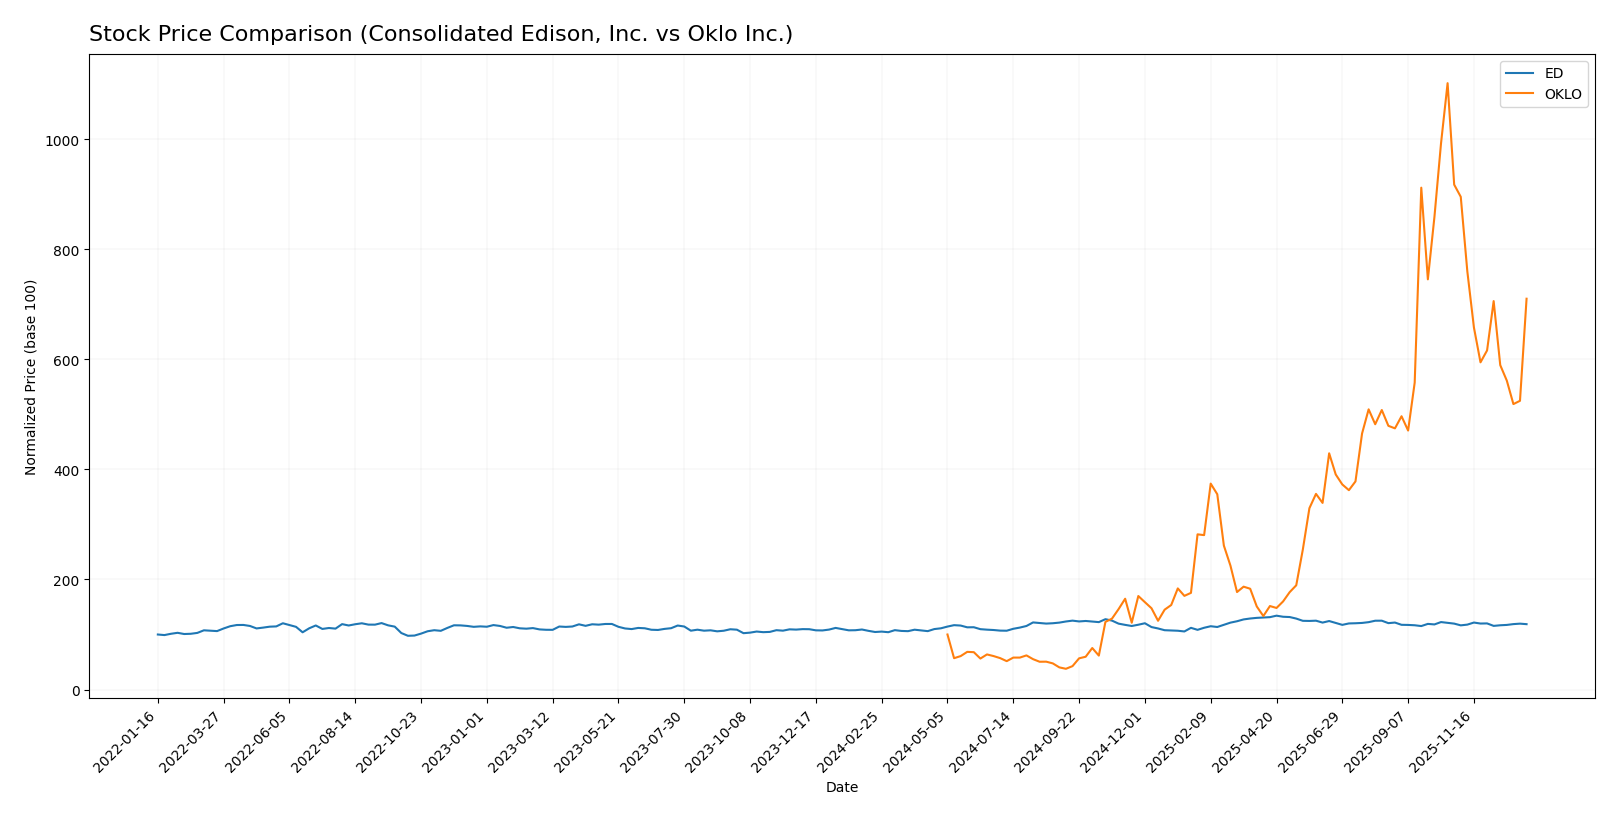
The stock price movements of Consolidated Edison, Inc. (ED) and Oklo Inc. (OKLO) over the past year reveal significant bullish trends with notable deceleration phases, alongside contrasting recent declines in trading dynamics.
Trend Analysis
Consolidated Edison, Inc. (ED) experienced a 13.62% price increase over the past 12 months, indicating a bullish trend with deceleration. The stock’s price ranged from a low of 87.01 to a high of 112.1, with moderate volatility (6.0 std deviation). Recently, the trend slightly reversed, showing a -0.83% decline.
Oklo Inc. (OKLO) posted a strong 610.11% price surge over the last year, marking a bullish trend with deceleration despite high volatility (39.02 std deviation). The price moved between 5.59 and 163.39. However, recent trading showed a sharp -22.59% drop and seller dominance.
Comparing both stocks, Oklo Inc. delivered the highest market performance with a substantially larger yearly gain, although its recent steep decline contrasts with Consolidated Edison’s more stable trend.
Target Prices
The current analyst consensus presents a positive outlook for both Consolidated Edison, Inc. and Oklo Inc.
| Company | Target High | Target Low | Consensus |
|---|---|---|---|
| Consolidated Edison, Inc. | 106 | 86 | 99.86 |
| Oklo Inc. | 150 | 95 | 125.67 |
Analysts expect Consolidated Edison’s price to stay near its current level of $99.21, while Oklo’s consensus target of $125.67 suggests upside potential from its current price of $105.31.
Analyst Opinions Comparison
This section compares analysts’ ratings and grades for Consolidated Edison, Inc. (ED) and Oklo Inc. (OKLO):
Rating Comparison
ED Rating
- Rating: B- with a very favorable status.
- Discounted Cash Flow Score: 1, indicating a very unfavorable outlook on future cash flows.
- ROE Score: 3, considered moderate efficiency in generating profits from equity.
- ROA Score: 3, moderate effectiveness in utilizing assets to generate earnings.
- Debt To Equity Score: 2, moderate financial risk with relatively balanced debt and equity.
- Overall Score: 2, moderate overall financial standing.
OKLO Rating
- Rating: C+ with a very favorable status.
- Discounted Cash Flow Score: 3, showing a moderate positive outlook on future cash flows.
- ROE Score: 1, reflecting very unfavorable efficiency in generating profits from equity.
- ROA Score: 1, very unfavorable in asset utilization for earnings.
- Debt To Equity Score: 5, very favorable with low financial risk from debt levels.
- Overall Score: 2, moderate overall financial standing.
Which one is the best rated?
Both companies have a moderate overall score of 2, but ED has a better rating grade (B- vs. C+) and stronger ROE and ROA scores. OKLO, however, excels in debt management with a top debt-to-equity score.
Scores Comparison
Here is a comparison of the Altman Z-Score and Piotroski Score for both companies:
ED Scores
- Altman Z-Score: 1.19 indicates financial distress with a high bankruptcy risk.
- Piotroski Score: 7 shows strong financial health and a good investment potential.
OKLO Scores
- Altman Z-Score: 339.43 indicates a very safe financial position.
- Piotroski Score: 2 indicates very weak financial strength and poor investment potential.
Which company has the best scores?
Based solely on the provided data, OKLO has a far superior Altman Z-Score, indicating very strong financial safety, while ED has a stronger Piotroski Score, reflecting better financial health. Each company excels in one score distinctly.
Grades Comparison
The following section compares the recent grades assigned to Consolidated Edison, Inc. and Oklo Inc. by recognized financial institutions:
Consolidated Edison, Inc. Grades
Below is a summary of recent grades from reputable grading companies for Consolidated Edison, Inc.:
| Grading Company | Action | New Grade | Date |
|---|---|---|---|
| UBS | Maintain | Neutral | 2026-01-07 |
| UBS | Maintain | Neutral | 2025-12-17 |
| Keybanc | Maintain | Underweight | 2025-12-12 |
| JP Morgan | Maintain | Underweight | 2025-12-12 |
| Barclays | Maintain | Underweight | 2025-11-10 |
| Barclays | Maintain | Underweight | 2025-10-22 |
| Morgan Stanley | Maintain | Underweight | 2025-10-22 |
| Barclays | Maintain | Underweight | 2025-10-21 |
| Keybanc | Maintain | Underweight | 2025-10-15 |
| Morgan Stanley | Maintain | Underweight | 2025-09-25 |
The overall trend for Consolidated Edison, Inc. reflects a predominance of underweight and neutral ratings, indicating cautious sentiment among analysts.
Oklo Inc. Grades
Below is a summary of recent grades from reputable grading companies for Oklo Inc.:
| Grading Company | Action | New Grade | Date |
|---|---|---|---|
| Seaport Global | Upgrade | Buy | 2025-12-08 |
| UBS | Maintain | Neutral | 2025-12-03 |
| B of A Securities | Maintain | Neutral | 2025-11-12 |
| B. Riley Securities | Maintain | Buy | 2025-11-12 |
| Wedbush | Maintain | Outperform | 2025-11-12 |
| B of A Securities | Downgrade | Neutral | 2025-09-30 |
| Seaport Global | Downgrade | Neutral | 2025-09-23 |
| Wedbush | Maintain | Outperform | 2025-09-22 |
| Wedbush | Maintain | Outperform | 2025-08-14 |
| Wedbush | Maintain | Outperform | 2025-08-12 |
Grades for Oklo Inc. show an overall positive consensus with multiple buy and outperform ratings, despite some recent neutral downgrades.
Which company has the best grades?
Oklo Inc. holds a stronger grading profile than Consolidated Edison, with more buy and outperform ratings versus Consolidated Edison’s mainly neutral and underweight grades. This difference suggests investors might perceive Oklo as having higher growth potential or favorable prospects.
Strengths and Weaknesses
The table below summarizes the key strengths and weaknesses of Consolidated Edison, Inc. (ED) and Oklo Inc. (OKLO) based on their recent financial performance, diversification, innovation, and market positioning.
| Criterion | Consolidated Edison, Inc. (ED) | Oklo Inc. (OKLO) |
|---|---|---|
| Diversification | Moderate diversification with stable electricity revenues (~$10.8B in 2023) plus oil, gas, steam, and non-utility services | Limited diversification; primarily focused on nuclear innovation, no significant revenue yet |
| Profitability | Positive net margin (11.93%), but ROIC (3.48%) below WACC (4.72%), indicating value destruction | Negative margins and ROIC; unprofitable with declining returns, no dividend yield |
| Innovation | Traditional utility model; limited recent innovation; steady but declining ROIC trend (-15.9%) | High innovation potential in nuclear tech but currently value-destroying with steep ROIC decline (-75.5%) |
| Global presence | Regional U.S. utility focus, limited global footprint | Emerging company with no significant global presence yet |
| Market Share | Established market position in U.S. utility sector | Small market share, early-stage company with high risk |
Consolidated Edison exhibits stable but declining profitability, with a solid revenue base primarily from electricity. Oklo, as a newer and innovative player in nuclear technology, carries significant risk with negative profitability and no current revenue. Investors should weigh ED’s steady cash flows against OKLO’s high-risk, high-reward profile.
Risk Analysis
Below is a comparative overview of key risks for Consolidated Edison, Inc. (ED) and Oklo Inc. (OKLO) based on the most recent data from 2024.
| Metric | Consolidated Edison, Inc. (ED) | Oklo Inc. (OKLO) |
|---|---|---|
| Market Risk | Low beta (0.38) indicates limited volatility versus market | Moderate beta (0.77) suggests higher sensitivity to market fluctuations |
| Debt level | Debt-to-equity 1.27 (unfavorable), debt-to-assets 39.4% (neutral) | Very low debt-to-equity 0.01 (favorable), debt-to-assets 0.46% (favorable) |
| Regulatory Risk | High due to regulated utility status in NY and NJ | High due to nuclear industry regulations and licensing complexities |
| Operational Risk | Aging infrastructure with extensive network | Early-stage with operational scaling risks and technology development |
| Environmental Risk | Moderate; investments in renewable energy but reliant on fossil fuels | High potential; nuclear energy poses radioactive waste and safety concerns |
| Geopolitical Risk | Moderate; localized to U.S. East Coast with stable political environment | Moderate to high; nuclear energy policies subject to political shifts and public opinion |
Consolidated Edison shows moderate market and regulatory risks, with some debt concerns and aging infrastructure posing operational challenges. Oklo faces significant regulatory and environmental risks due to its nuclear focus, alongside early operational scalability issues. Oklo’s financials reveal higher vulnerability despite low leverage, emphasizing technology and regulatory hurdles as the most impactful risks.
Which Stock to Choose?
Consolidated Edison, Inc. (ED) shows a generally favorable income statement with 57% favorable metrics, including solid gross and net margins, though recent declines in EBIT and net margin growth temper enthusiasm. Financial ratios are slightly unfavorable overall, with concerns on ROE and debt levels despite a decent dividend yield. The company’s economic moat appears very unfavorable, reflecting value destruction and declining profitability, and its Altman Z-Score places it in the distress zone despite a strong Piotroski score.
Oklo Inc. (OKLO) presents an unfavorable income profile, with negative margins and steep declines in earnings and revenue growth. Financial ratios also appear unfavorable overall, though the company benefits from very low debt and a strong current ratio. Its economic moat is very unfavorable, indicating significant value destruction and sharply declining returns. However, its Altman Z-Score suggests financial safety, contrasting with a very weak Piotroski score.
Investors seeking stability and income might find Consolidated Edison’s favorable income metrics and dividend yield more appealing, despite its financial and moat challenges. Conversely, those with a high risk tolerance and focus on potential growth could interpret Oklo’s low leverage and substantial price appreciation as opportunities, albeit with significant financial and profitability risks. The choice could therefore depend on the investor’s risk appetite and investment objectives.
Disclaimer: Investment carries a risk of loss of initial capital. The past performance is not a reliable indicator of future results. Be sure to understand risks before making an investment decision.
Go Further
I encourage you to read the complete analyses of Consolidated Edison, Inc. and Oklo Inc. to enhance your investment decisions: