In the evolving utilities sector, two giants—Exelon Corporation (EXC) and Consolidated Edison, Inc. (ED)—stand out for their extensive regulated electric operations and commitment to innovation in energy delivery. Both companies serve crucial markets with overlapping interests in renewable and traditional energy sources, making their strategies and financial health particularly relevant for investors. This article will help you identify which of these industry leaders offers the most compelling investment opportunity in 2026.
Table of contents
Companies Overview
I will begin the comparison between Exelon Corporation and Consolidated Edison, Inc. by providing an overview of these two companies and their main differences.
Exelon Corporation Overview
Exelon Corporation is a utility services holding company focused on energy generation, delivery, and marketing in the US and Canada. It operates diverse generating facilities including nuclear, fossil, wind, hydroelectric, biomass, and solar. The company also provides electricity and natural gas sales, energy-related services, and support functions to a wide range of customers, positioning itself as a comprehensive energy provider.
Consolidated Edison, Inc. Overview
Consolidated Edison, Inc. operates regulated electric, gas, and steam delivery businesses primarily in New York. It serves millions of customers with electric, gas, and steam services, maintaining extensive transmission and distribution infrastructure. The company also invests in renewable and energy infrastructure projects, offering energy products and services to industrial, commercial, residential, and government clients.
Key similarities and differences
Both companies operate in the regulated electric utility sector and provide energy-related products and services to a broad customer base. Exelon focuses more on energy generation with diverse sources, while Consolidated Edison emphasizes regulated delivery of electric, gas, and steam services in a concentrated geographic area. Both invest in renewable infrastructure but differ in scale and operational scope.
Income Statement Comparison
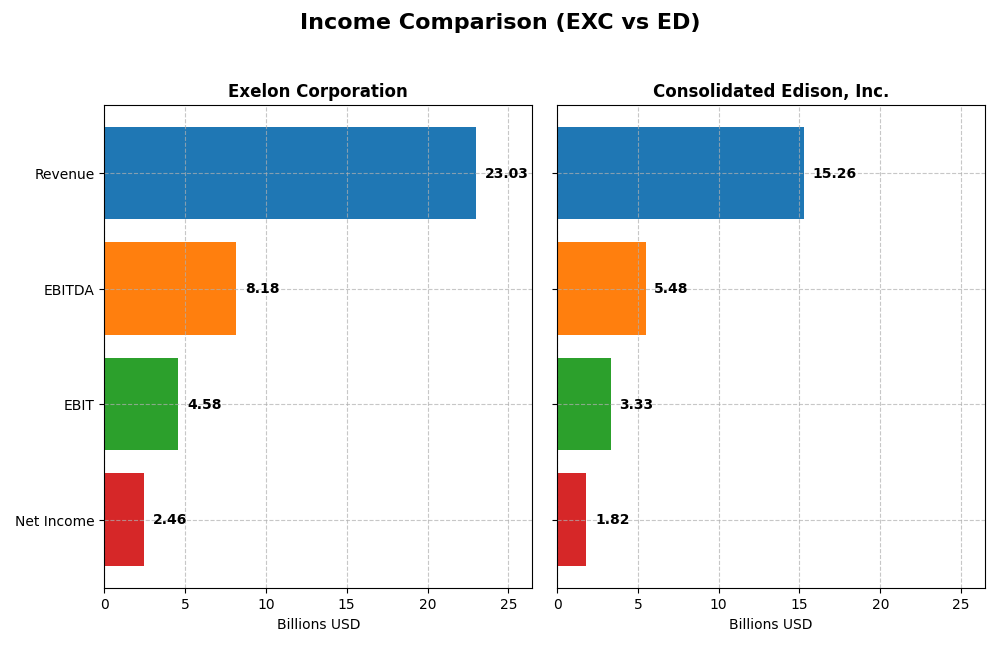
The table below provides a side-by-side comparison of the most recent fiscal year income statement metrics for Exelon Corporation and Consolidated Edison, Inc.
| Metric | Exelon Corporation (EXC) | Consolidated Edison, Inc. (ED) |
|---|---|---|
| Market Cap | 43.8B | 35.8B |
| Revenue | 23.0B | 15.3B |
| EBITDA | 8.18B | 5.48B |
| EBIT | 4.58B | 3.33B |
| Net Income | 2.46B | 1.82B |
| EPS | 2.45 | 5.26 |
| Fiscal Year | 2024 | 2024 |
Income Statement Interpretations
Exelon Corporation
Exelon’s revenue showed a mixed trend with a significant drop overall from 2020 to 2024 but a moderate 6% increase in the last year. Net income rose steadily, up 25% over the period, reflecting improving profitability. Margins remain solid, with gross margin near 41% and net margin around 11%, though net margin slightly declined last year despite EPS growth of 4.7%.
Consolidated Edison, Inc.
Consolidated Edison saw consistent revenue growth of 25% over five years, with a slower 4% rise in the last year. Net income increased impressively by 65% overall but declined by over 30% recently, alongside a sharp EPS drop. Gross and EBIT margins are strong, at 64% and 22%, respectively, but net margin contracted last year, indicating margin pressures.
Which one has the stronger fundamentals?
Both companies show favorable income statement fundamentals, yet Exelon’s stable margins and steady net income growth contrast with Consolidated Edison’s stronger overall revenue and net income expansion but recent margin and earnings setbacks. Exelon maintains more consistent profitability, while Consolidated Edison exhibits higher volatility in recent earnings performance.
Financial Ratios Comparison
Below is a comparison of the most recent key financial ratios for Exelon Corporation and Consolidated Edison, Inc., based on their 2024 fiscal year data.
| Ratios | Exelon Corporation (EXC) | Consolidated Edison, Inc. (ED) |
|---|---|---|
| ROE | 9.14% | 8.29% |
| ROIC | 3.93% | 3.48% |
| P/E | 15.35 | 16.96 |
| P/B | 1.40 | 1.41 |
| Current Ratio | 0.87 | 1.04 |
| Quick Ratio | 0.78 | 0.96 |
| D/E (Debt-to-Equity) | 1.73 | 1.27 |
| Debt-to-Assets | 43.3% | 39.4% |
| Interest Coverage | 2.26 | 2.30 |
| Asset Turnover | 0.21 | 0.22 |
| Fixed Asset Turnover | 0.29 | 0.29 |
| Payout Ratio | 61.95% | 60.44% |
| Dividend Yield | 4.04% | 3.56% |
Interpretation of the Ratios
Exelon Corporation
Exelon’s 2024 ratios show a mixed financial health picture. While net margin (10.68%) and dividend yield (4.04%) are favorable, concerns arise from low return on equity (9.14%), return on invested capital (3.93%), and liquidity ratios below 1.0 (current ratio 0.87). The payout appears supported but risks stem from leverage and asset turnover weaknesses. Dividend payments are consistent with a moderate yield, but coverage by free cash flow is negative, indicating caution.
Consolidated Edison, Inc.
Consolidated Edison presents slightly better liquidity ratios with a current ratio of 1.04 and quick ratio near 0.96, though return on equity is lower at 8.29%. Net margin at 11.93% and dividend yield of 3.56% are favorable. Debt levels remain a concern (D/E 1.27). The dividend appears sustainable given the company’s stable earnings, despite some pressure from negative free cash flow yields. Asset turnover metrics suggest operational challenges similar to Exelon’s.
Which one has the best ratios?
Both companies display slightly unfavorable overall ratios, with 28.57% favorable metrics each. Exelon shows stronger dividend yield but weaker liquidity and returns compared to Consolidated Edison. Consolidated Edison maintains better current and quick ratios and slightly lower leverage, but both struggle with asset turnover and returns on equity and invested capital. Neither stands out decisively in financial strength.
Strategic Positioning
This section compares the strategic positioning of Exelon Corporation and Consolidated Edison, Inc. regarding market position, key segments, and exposure to technological disruption:
Exelon Corporation
- Leading regulated electric utility with diversified geographic presence in the US and Canada.
- Revenues driven by multiple electric utility subsidiaries and energy commodities; broad utility services.
- Owns diverse generation assets including nuclear, fossil, wind, hydroelectric, biomass, and solar.
Consolidated Edison, Inc.
- Regulated electric, gas, and steam delivery focused mainly in New York and nearby areas.
- Key segments include electricity, oil and gas purchases, and steam; concentrated regional customer base.
- Operates renewable and energy infrastructure projects alongside traditional regulated delivery services.
Exelon Corporation vs Consolidated Edison, Inc. Positioning
Exelon’s strategy is diversified across multiple utility subsidiaries and energy types, offering broad business drivers. Consolidated Edison is more concentrated regionally with a focus on regulated delivery and energy services. Exelon’s diversity provides scale, while Con Edison’s focus supports deep regional market penetration.
Which has the best competitive advantage?
Both companies are currently shedding value relative to cost of capital; however, Exelon shows growing profitability while Consolidated Edison experiences declining returns, giving Exelon a slightly more favorable moat position.
Stock Comparison
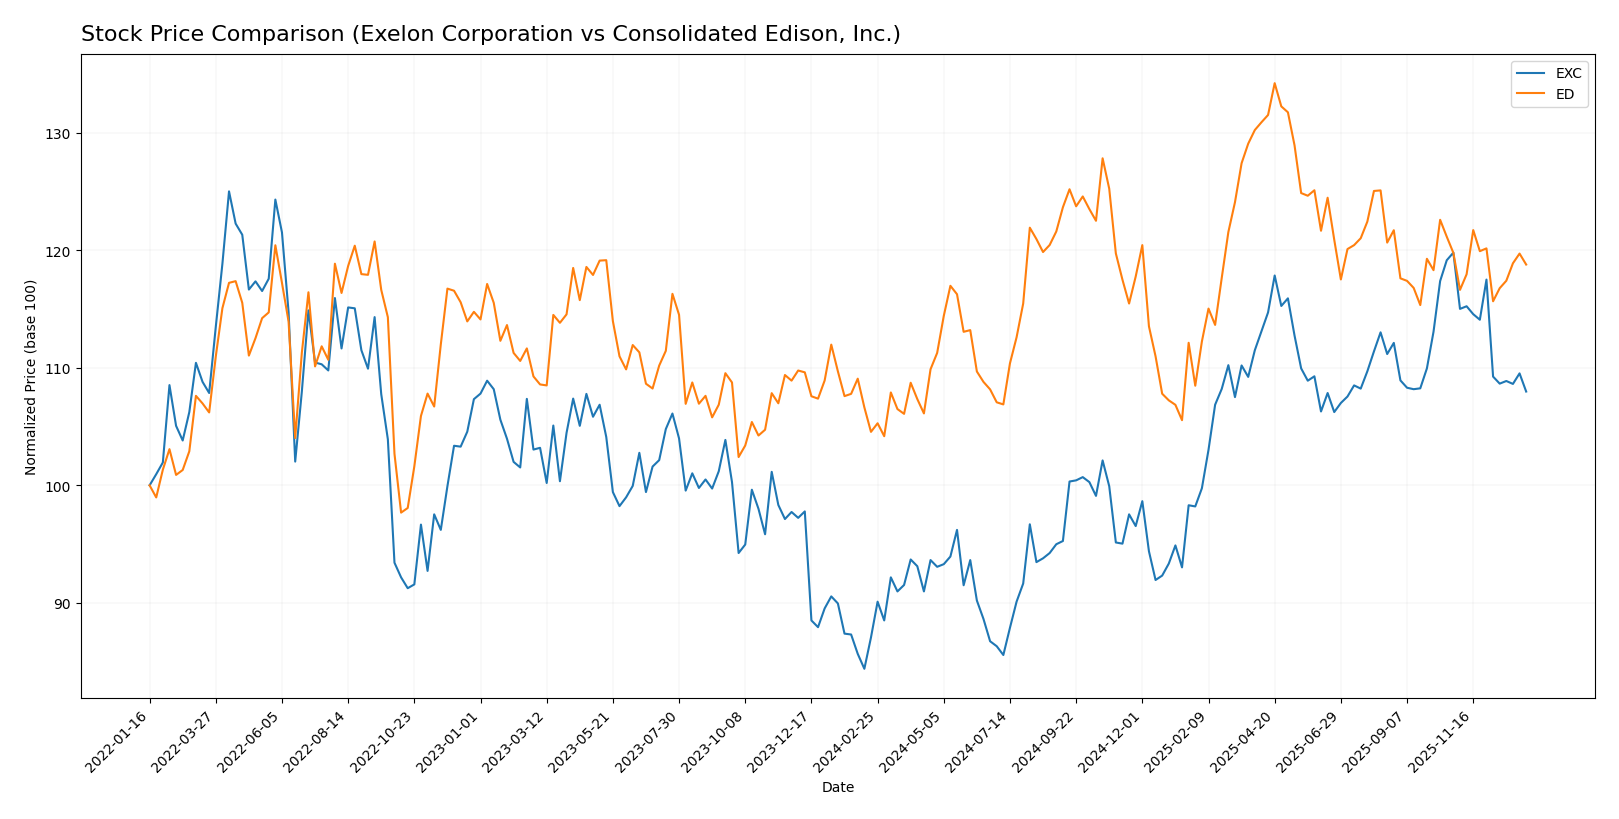
The stock price movements of Exelon Corporation (EXC) and Consolidated Edison, Inc. (ED) over the past year reveal distinct bullish trends with notable deceleration phases and varying volatility levels, reflecting shifting trading dynamics and investor sentiment.
Trend Analysis
Exelon Corporation’s stock exhibited a 24.03% increase over the past 12 months, indicating a bullish trend with deceleration. The price ranged from 34.31 to 48.04, and recent months show a mild downward slope with a -9.87% change.
Consolidated Edison, Inc. recorded a 13.62% gain over the last year, also bullish with deceleration. It showed higher volatility, with prices between 87.01 and 112.1, and a nearly neutral recent trend of -0.83% price change.
Comparing both, Exelon delivered the highest market performance with a stronger overall price increase despite recent weakness, while Consolidated Edison’s gains were more moderate with steadier recent price behavior.
Target Prices
The current analyst consensus presents a balanced outlook for both Exelon Corporation and Consolidated Edison, Inc.
| Company | Target High | Target Low | Consensus |
|---|---|---|---|
| Exelon Corporation | 57 | 39 | 50.86 |
| Consolidated Edison, Inc. | 106 | 86 | 99.86 |
Analysts expect Exelon’s stock to rise from its current price of $43.3 toward a consensus target near $51, indicating moderate upside potential. Consolidated Edison’s consensus target price of roughly $100 aligns closely with its present trading price of $99.21, suggesting a stable valuation outlook.
Analyst Opinions Comparison
This section compares analysts’ ratings and grades for Exelon Corporation and Consolidated Edison, Inc.:
Rating Comparison
EXC Rating
- Rating: B, considered very favorable overall
- Discounted Cash Flow Score: 3, moderate valuation
- ROE Score: 3, moderate efficiency in equity use
- ROA Score: 3, moderate asset utilization
- Debt To Equity Score: 2, moderate financial risk
- Overall Score: 3, moderate overall financial health
ED Rating
- Rating: B-, also very favorable overall
- Discounted Cash Flow Score: 1, very unfavorable valuation
- ROE Score: 3, moderate efficiency in equity use
- ROA Score: 3, moderate asset utilization
- Debt To Equity Score: 2, moderate financial risk
- Overall Score: 2, moderate overall financial health
Which one is the best rated?
Exelon Corporation holds a higher overall score (3 vs. 2) and a significantly better discounted cash flow score (3 vs. 1) than Consolidated Edison, indicating a stronger valuation and financial standing based on available data.
Scores Comparison
Here is a comparison of the financial scores for Exelon Corporation (EXC) and Consolidated Edison, Inc. (ED):
EXC Scores
- Altman Z-Score: 0.78, indicating financial distress.
- Piotroski Score: 5, reflecting average financial strength.
ED Scores
- Altman Z-Score: 1.19, also indicating financial distress.
- Piotroski Score: 7, indicating strong financial health.
Which company has the best scores?
Based on the provided scores, ED has a higher Piotroski Score, suggesting stronger financial health, though both companies remain in the Altman Z-Score distress zone. EXC’s scores are overall weaker compared to ED’s.
Grades Comparison
The following section presents the recent grades issued by recognized financial institutions for Exelon Corporation and Consolidated Edison, Inc.:
Exelon Corporation Grades
This table summarizes the latest grades from major financial firms for Exelon Corporation.
| Grading Company | Action | New Grade | Date |
|---|---|---|---|
| UBS | Maintain | Neutral | 2025-12-17 |
| JP Morgan | Maintain | Neutral | 2025-12-12 |
| Morgan Stanley | Maintain | Equal Weight | 2025-10-22 |
| Keybanc | Maintain | Underweight | 2025-10-15 |
| Jefferies | Maintain | Buy | 2025-10-15 |
| Barclays | Maintain | Overweight | 2025-10-14 |
| UBS | Maintain | Neutral | 2025-10-10 |
| Morgan Stanley | Maintain | Equal Weight | 2025-09-25 |
| Keybanc | Maintain | Underweight | 2025-07-16 |
| UBS | Maintain | Neutral | 2025-07-11 |
Overall, Exelon’s grades show a balanced mix of Neutral, Equal Weight, and some Buy and Overweight ratings, indicating a moderate but diversified analyst sentiment.
Consolidated Edison, Inc. Grades
This table summarizes the latest grades from major financial firms for Consolidated Edison, Inc.
| Grading Company | Action | New Grade | Date |
|---|---|---|---|
| UBS | Maintain | Neutral | 2026-01-07 |
| UBS | Maintain | Neutral | 2025-12-17 |
| Keybanc | Maintain | Underweight | 2025-12-12 |
| JP Morgan | Maintain | Underweight | 2025-12-12 |
| Barclays | Maintain | Underweight | 2025-11-10 |
| Barclays | Maintain | Underweight | 2025-10-22 |
| Morgan Stanley | Maintain | Underweight | 2025-10-22 |
| Barclays | Maintain | Underweight | 2025-10-21 |
| Keybanc | Maintain | Underweight | 2025-10-15 |
| Morgan Stanley | Maintain | Underweight | 2025-09-25 |
Consolidated Edison’s grades predominantly consist of Underweight ratings with some Neutral assessments, reflecting a more cautious analyst outlook.
Which company has the best grades?
Exelon Corporation has received comparatively stronger grades, including Buy and Overweight ratings, while Consolidated Edison’s evaluations are mainly Underweight. This suggests that analysts hold a more favorable view of Exelon’s prospects, which could influence investor sentiment and portfolio decisions accordingly.
Strengths and Weaknesses
The table below summarizes key strengths and weaknesses of Exelon Corporation (EXC) and Consolidated Edison, Inc. (ED) based on recent financial and operational data.
| Criterion | Exelon Corporation (EXC) | Consolidated Edison, Inc. (ED) |
|---|---|---|
| Diversification | Highly diversified with multiple utility subsidiaries generating $18B+ in revenues across electric and gas segments. | Moderate diversification in electricity, oil & gas, and steam, with revenues around $15B. |
| Profitability | Net margin 10.7% (favorable), but ROIC (3.9%) below WACC (5%), indicating value destruction despite growing ROIC. | Net margin 11.9% (favorable), ROIC (3.5%) below WACC (4.7%), with declining ROIC, signaling value destruction and decreasing profitability. |
| Innovation | Moderate innovation focus, improving ROIC trend suggests operational improvements. | Limited innovation impact; declining ROIC points to challenges in efficiency or growth. |
| Global presence | Primarily US-focused utilities with strong regional coverage in multiple states. | US regional focus with strong presence in electricity and related services. |
| Market Share | Significant market share in several regulated electric and gas markets, revenues growing steadily. | Stable market share in electricity and steam, but slower revenue growth compared to EXC. |
In summary, both companies show strong revenue bases and favorable net margins, but they currently destroy value as their ROIC fails to exceed WACC. Exelon exhibits a positive ROIC trend, indicating improving efficiency, whereas Consolidated Edison’s declining ROIC raises caution for investors.
Risk Analysis
Below is a summary table highlighting key risks for Exelon Corporation (EXC) and Consolidated Edison, Inc. (ED) based on the most recent data from 2024:
| Metric | Exelon Corporation (EXC) | Consolidated Edison, Inc. (ED) |
|---|---|---|
| Market Risk | Moderate (Beta 0.56) | Lower (Beta 0.38) |
| Debt Level | High (Debt/Equity 1.73) | Moderate (Debt/Equity 1.27) |
| Regulatory Risk | Significant (Utility sector) | Significant (Utility sector) |
| Operational Risk | Moderate (Asset turnover 0.21) | Moderate (Asset turnover 0.22) |
| Environmental Risk | High (Nuclear & fossil exposure) | Moderate (Renewables and gas) |
| Geopolitical Risk | Low (U.S. & Canada focus) | Low (U.S. focused) |
The most impactful risks are Exelon’s relatively high debt level combined with its exposure to nuclear and fossil fuel assets, which face regulatory and environmental pressures. Consolidated Edison shows slightly lower financial leverage and a stronger Piotroski score, but both companies remain vulnerable to regulatory changes in the utility sector. Investors should monitor debt sustainability and evolving energy policies closely.
Which Stock to Choose?
Exelon Corporation (EXC) shows a mixed income evolution with favorable net margin and profitability growth, but a revenue decline over 2020-2024. Its financial ratios reveal strengths in net margin and dividend yield but weaknesses in liquidity and leverage, resulting in a slightly unfavorable overall rating. Debt remains significant, and the company is shedding value despite increasing ROIC.
Consolidated Edison, Inc. (ED) exhibits favorable income statement metrics, including strong gross and net margins and solid growth in net income and EPS over five years. Its financial ratios are slightly better balanced with neutral liquidity and debt-to-assets, yet it also faces declining ROIC and value destruction. The rating is very favorable, though some scores indicate caution.
For investors, the choice might depend on risk tolerance and investment strategy: those prioritizing growth and improving profitability could see potential in Exelon’s rising ROIC despite current challenges, while investors seeking steadier income and stronger rating metrics might find Consolidated Edison’s profile more aligned with stability and quality. Both stocks present slightly unfavorable financial ratios and value concerns, suggesting prudence in assessment.
Disclaimer: Investment carries a risk of loss of initial capital. The past performance is not a reliable indicator of future results. Be sure to understand risks before making an investment decision.
Go Further
I encourage you to read the complete analyses of Exelon Corporation and Consolidated Edison, Inc. to enhance your investment decisions: