In the evolving landscape of regulated electric utilities, Consolidated Edison, Inc. (ED) and Eversource Energy (ES) stand out as key players serving the Northeastern United States. Both companies operate large-scale electric and gas distribution networks while investing in renewable energy infrastructure, highlighting their innovation strategies within a traditional sector. This comparison will help investors identify which company offers the most compelling opportunity for a balanced and forward-looking portfolio.
Table of contents
Companies Overview
I will begin the comparison between Consolidated Edison, Inc. and Eversource Energy by providing an overview of these two companies and their main differences.
Consolidated Edison, Inc. Overview
Consolidated Edison, Inc. operates in the regulated electric, gas, and steam delivery sectors primarily in New York City and surrounding counties. It serves approximately 3.5M electric, 1.1M gas, and 1,555 steam customers, while managing extensive transmission and distribution infrastructure. The company also invests in renewable energy and energy infrastructure projects, offering products and services to retail and wholesale customers.
Eversource Energy Overview
Eversource Energy is a public utility holding company focused on the transmission and distribution of electricity, natural gas, and water in Connecticut, Massachusetts, and New Hampshire. It serves residential, commercial, industrial, and municipal customers through its regulated segments. Eversource also operates solar power facilities and water utilities, providing services to around 226K water customers from its base in Springfield, Massachusetts.
Key similarities and differences
Both companies operate as regulated electric utilities with additional businesses in natural gas distribution and energy transmission. Consolidated Edison serves a larger customer base in a dense urban environment, including steam delivery, while Eversource has a diversified portfolio including water distribution and solar power facilities. Despite their shared utility focus, they differ in geographic footprint, scale, and service mix.
Income Statement Comparison
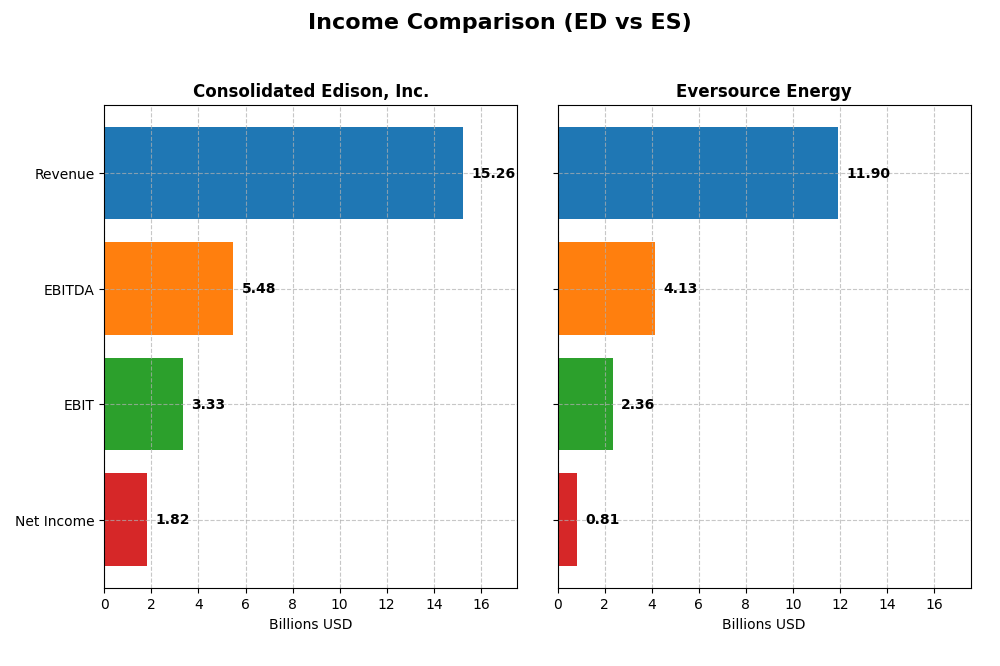
This table provides a side-by-side comparison of key income statement metrics for Consolidated Edison, Inc. and Eversource Energy for the fiscal year 2024.
| Metric | Consolidated Edison, Inc. | Eversource Energy |
|---|---|---|
| Market Cap | 35.8B | 24.9B |
| Revenue | 15.3B | 11.9B |
| EBITDA | 5.48B | 4.13B |
| EBIT | 3.33B | 2.36B |
| Net Income | 1.82B | 812M |
| EPS | 5.26 | 2.27 |
| Fiscal Year | 2024 | 2024 |
Income Statement Interpretations
Consolidated Edison, Inc.
Consolidated Edison, Inc. showed overall revenue growth of 24.65% and net income growth of 65.3% from 2020 to 2024, with favorable gross and net margins at 63.99% and 11.93%, respectively. In 2024, revenue rose modestly by 4.16%, but EBIT declined 17.51%, and net margin contracted by 30.64%, indicating margin pressures despite stable top-line growth.
Eversource Energy
Eversource Energy experienced a 33.65% increase in revenue over the 2020-2024 period, but net income declined by 32.65%, reflecting challenges in profitability. Gross margin remained favorable at 31.12%, while EBIT margin stood at 19.79%. The latest year showed a slight revenue dip of 0.08%, yet EBIT and net margin surged over 280%, highlighting improved operational efficiency or non-recurring factors influencing profitability.
Which one has the stronger fundamentals?
Both companies exhibit favorable income statement evaluations, with similar proportions of positive metrics. Consolidated Edison has demonstrated consistent growth in net income and margins over the full period, though recent margin compression is notable. Eversource shows stronger recent profitability gains despite overall net income decline, suggesting mixed fundamental strengths depending on the timeframe considered.
Financial Ratios Comparison
The table below presents the key financial ratios for Consolidated Edison, Inc. (ED) and Eversource Energy (ES) based on their most recent fiscal year data as of 2024.
| Ratios | Consolidated Edison, Inc. (ED) | Eversource Energy (ES) |
|---|---|---|
| ROE | 8.29% | 5.40% |
| ROIC | 3.48% | 3.18% |
| P/E | 16.96 | 25.29 |
| P/B | 1.41 | 1.37 |
| Current Ratio | 1.04 | 0.76 |
| Quick Ratio | 0.96 | 0.67 |
| D/E | 1.27 | 1.94 |
| Debt-to-Assets | 39.4% | 48.9% |
| Interest Coverage | 2.30 | 2.43 |
| Asset Turnover | 0.22 | 0.20 |
| Fixed Asset Turnover | 0.29 | 0.29 |
| Payout ratio | 60.4% | 124.3% |
| Dividend yield | 3.56% | 4.91% |
Interpretation of the Ratios
Consolidated Edison, Inc.
Consolidated Edison shows a mixed ratio profile with a favorable net margin of 11.93% and a solid dividend yield of 3.56%. However, its return on equity (8.29%) and return on invested capital (3.48%) are weak, and debt-to-equity at 1.27 raises some concerns. The company maintains consistent dividend payments supported by stable cash flow, but cautious monitoring of leverage remains important.
Eversource Energy
Eversource Energy presents mostly unfavorable ratios, including a lower net margin of 6.82% and a high price-to-earnings ratio of 25.29. Its return on equity is also weak at 5.4%, alongside poor liquidity ratios and high debt-to-equity of 1.94. Despite a higher dividend yield of 4.91%, the firm faces risks from leverage and cash flow coverage challenges affecting shareholder returns.
Which one has the best ratios?
Consolidated Edison has a slightly more favorable ratio profile overall, with a better net margin, lower leverage, and a stable dividend yield. Eversource Energy shows more unfavorable indicators, particularly in liquidity and debt management. Both companies pay dividends, but Consolidated Edison’s ratios suggest relatively better financial stability.
Strategic Positioning
This section compares the strategic positioning of Consolidated Edison, Inc. (ED) and Eversource Energy (ES), including market position, key segments, and exposure to technological disruption:
Consolidated Edison, Inc. (ED)
- Leading regulated electric utility with 3.5M electric and 1.1M gas customers in New York; faces stable competitive pressure.
- Revenue driven by electricity, oil and gas purchased, and steam delivery; diversified energy services including renewables and infrastructure projects.
- Operates extensive transmission and distribution infrastructure; exposure to disruption mainly through renewable energy development and energy infrastructure investments.
Eversource Energy (ES)
- Regulated utility serving Connecticut, Massachusetts, New Hampshire with electric, gas, and water segments; moderate competitive pressure.
- Key segments include electric distribution, transmission, natural gas, and water distribution; additional revenue from other energy services.
- Engages in solar power facilities and regulated utilities; exposure includes evolving energy delivery and renewable integration.
Consolidated Edison, Inc. vs Eversource Energy Positioning
ED exhibits a diversified energy portfolio across electricity, gas, steam, and renewable projects, while ES concentrates on electric, gas, and water utilities with solar power integration. ED’s broad services contrast with ES’s more regional, multi-utility focus, reflecting different scale and segment emphases.
Which has the best competitive advantage?
Both companies show declining ROIC trends and ROIC below WACC, indicating value destruction and very unfavorable moat statuses. Neither currently demonstrates a sustainable competitive advantage based on MOAT evaluation.
Stock Comparison
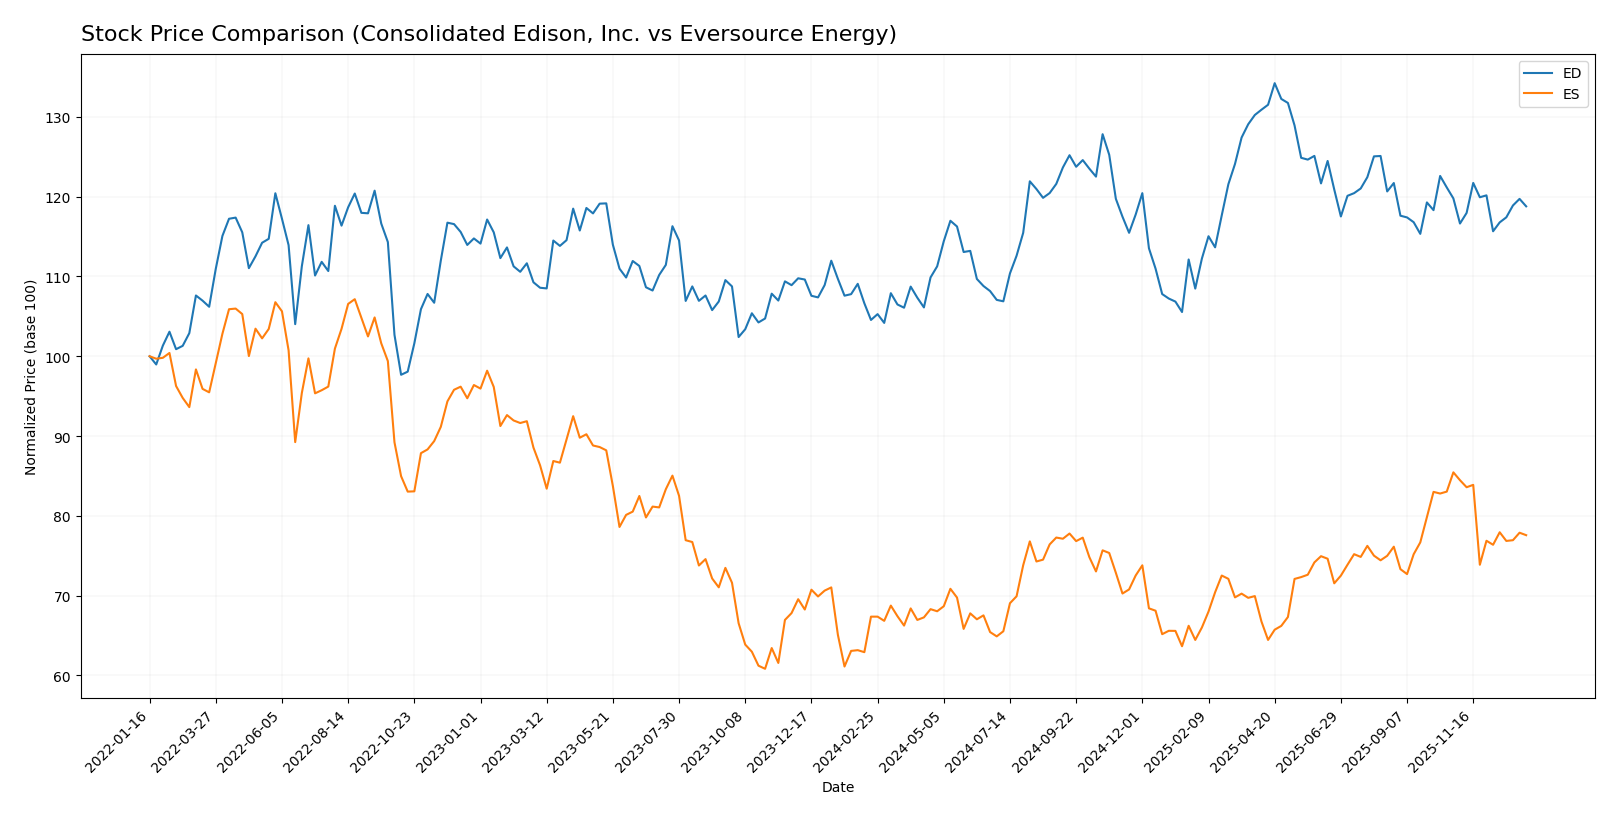
The stock prices of Consolidated Edison, Inc. (ED) and Eversource Energy (ES) exhibited notable bullish trends over the past 12 months, with both showing deceleration in momentum and distinct trading volume behaviors.
Trend Analysis
Consolidated Edison, Inc. (ED) showed a 13.62% price increase over the past year, indicating a bullish trend with decelerating price acceleration and a standard deviation of 6.0. The stock reached a high of 112.1 and a low of 87.01.
Eversource Energy (ES) delivered a 15.15% price gain over the same period, also bullish but with decelerating acceleration and a lower volatility of 4.5. Its highest price was 74.67 and lowest 55.63.
Comparing both, Eversource Energy outperformed Consolidated Edison with a higher overall price increase, despite both stocks experiencing recent downward trends in the last few months.
Target Prices
The current analyst consensus presents a balanced outlook for Consolidated Edison, Inc. and Eversource Energy with defined target ranges.
| Company | Target High | Target Low | Consensus |
|---|---|---|---|
| Consolidated Edison, Inc. | 106 | 86 | 99.86 |
| Eversource Energy | 81 | 60 | 68 |
Analysts expect Consolidated Edison’s stock price to stay close to its current level of $99.21, while Eversource Energy shows a moderate upside from its current price of $67.79.
Analyst Opinions Comparison
This section compares analysts’ ratings and grades for Consolidated Edison, Inc. (ED) and Eversource Energy (ES):
Rating Comparison
ED Rating
- Rating: B-, classified as Very Favorable overall.
- Discounted Cash Flow Score: 1, rated Very Unfavorable, indicating concerns about valuation.
- ROE Score: 3, Moderate, showing efficient profit generation from equity.
- ROA Score: 3, Moderate, reflecting effective asset utilization.
- Debt To Equity Score: 2, Moderate risk, suggesting balanced financial leverage.
- Overall Score: 2, Moderate, summarizing a middling financial standing.
ES Rating
- Rating: C+, also classified as Very Favorable overall.
- Discounted Cash Flow Score: 1, also Very Unfavorable, signaling similar valuation concerns.
- ROE Score: 3, Moderate, indicating comparable efficiency in generating shareholder returns.
- ROA Score: 3, Moderate, similarly showing good asset utilization.
- Debt To Equity Score: 1, Very Unfavorable, pointing to higher financial risk due to leverage.
- Overall Score: 2, Moderate, reflecting a similar overall financial position.
Which one is the best rated?
Based strictly on the provided data, ED holds a slightly better rating (B-) than ES (C+), mainly due to a stronger Debt To Equity Score, indicating lower financial risk while both share identical scores in other categories.
Scores Comparison
Here is a comparison of the Altman Z-Score and Piotroski Score for Consolidated Edison, Inc. (ED) and Eversource Energy (ES):
ED Scores
- Altman Z-Score: 1.19, classified in the distress zone indicating high bankruptcy risk.
- Piotroski Score: 7, considered strong financial health.
ES Scores
- Altman Z-Score: 0.75, also in distress zone, indicating high bankruptcy risk.
- Piotroski Score: 6, considered average financial health.
Which company has the best scores?
Based strictly on the data, ED has a higher Piotroski Score (7 vs. 6), indicating stronger financial health. Both companies are in the distress zone for Altman Z-Score, but ES’s score is lower, implying a higher bankruptcy risk.
Grades Comparison
Here is a comparison of the recent grades provided by recognized financial institutions for both companies:
Consolidated Edison, Inc. Grades
This table summarizes the latest grades from major grading companies for Consolidated Edison, Inc.:
| Grading Company | Action | New Grade | Date |
|---|---|---|---|
| UBS | Maintain | Neutral | 2026-01-07 |
| UBS | Maintain | Neutral | 2025-12-17 |
| Keybanc | Maintain | Underweight | 2025-12-12 |
| JP Morgan | Maintain | Underweight | 2025-12-12 |
| Barclays | Maintain | Underweight | 2025-11-10 |
| Barclays | Maintain | Underweight | 2025-10-22 |
| Morgan Stanley | Maintain | Underweight | 2025-10-22 |
| Barclays | Maintain | Underweight | 2025-10-21 |
| Keybanc | Maintain | Underweight | 2025-10-15 |
| Morgan Stanley | Maintain | Underweight | 2025-09-25 |
Overall, Consolidated Edison has predominantly maintained an underweight rating from multiple firms, with UBS consistently assigning a neutral rating.
Eversource Energy Grades
This table presents recent grading actions from established firms for Eversource Energy:
| Grading Company | Action | New Grade | Date |
|---|---|---|---|
| UBS | Maintain | Neutral | 2025-12-17 |
| JP Morgan | Maintain | Underweight | 2025-12-12 |
| Janney Montgomery Scott | Upgrade | Buy | 2025-11-24 |
| Scotiabank | Maintain | Sector Underperform | 2025-11-20 |
| Mizuho | Downgrade | Neutral | 2025-11-20 |
| Wells Fargo | Downgrade | Equal Weight | 2025-11-20 |
| UBS | Downgrade | Neutral | 2025-11-06 |
| BMO Capital | Maintain | Market Perform | 2025-11-06 |
| Scotiabank | Maintain | Sector Underperform | 2025-11-06 |
| Mizuho | Maintain | Outperform | 2025-10-27 |
Eversource Energy’s ratings show a mix of neutral and underweight grades, with occasional upgrades to buy and outperform, indicating varied analyst sentiment.
Which company has the best grades?
Eversource Energy has received a broader range of grades, including several buy and outperform ratings, while Consolidated Edison, Inc. mostly holds underweight and neutral ratings. This suggests Eversource Energy may be viewed more favorably by some analysts, potentially influencing investor sentiment toward a more optimistic outlook.
Strengths and Weaknesses
The table below summarizes key strengths and weaknesses of Consolidated Edison, Inc. (ED) and Eversource Energy (ES) based on recent financial performance, market position, and operational metrics.
| Criterion | Consolidated Edison, Inc. (ED) | Eversource Energy (ES) |
|---|---|---|
| Diversification | Moderate diversification with strong electricity segment and additional oil, gas, and steam revenues | Diversified utility portfolio including electric distribution, transmission, natural gas, and water |
| Profitability | Moderate net margin (11.93%), but declining ROIC and unfavorable ROE | Lower net margin (6.82%) with declining ROIC and ROE; higher PE ratio signals growth concerns |
| Innovation | Limited innovation focus; traditional utility operations | Similar traditional utility footprint; no significant innovation edge reported |
| Global presence | Primarily regional U.S. utility, limited global reach | Regional U.S. utility focus, no global operations |
| Market Share | Established regional market share in electricity and gas | Strong position in electric and gas distribution in Northeast U.S. markets |
Key takeaways: Both companies have solid regional utilities with diversified energy segments, but face challenges in profitability and efficiency with declining ROIC trends. ED shows slightly better profitability metrics, while ES has a broader service offering but weaker financial ratios. Caution is warranted due to value destruction signals in both firms.
Risk Analysis
Below is a comparative overview of key risks for Consolidated Edison, Inc. (ED) and Eversource Energy (ES) as of 2024.
| Metric | Consolidated Edison, Inc. (ED) | Eversource Energy (ES) |
|---|---|---|
| Market Risk | Low beta (0.38) suggests low volatility vs. market | Moderate beta (0.77) indicates higher market sensitivity |
| Debt Level | Debt to equity 1.27 (unfavorable), interest coverage 2.8 (neutral) | Debt to equity 1.94 (very unfavorable), interest coverage 2.12 (neutral) |
| Regulatory Risk | High due to regulated utilities in NY and NJ | High due to regulated utilities in NE states (CT, MA, NH) |
| Operational Risk | Moderate; extensive infrastructure with risk of outages | Moderate; diversified energy and water services add complexity |
| Environmental Risk | Exposure to transitioning energy policies and renewable investments | Similar exposure; also invests in solar power facilities |
| Geopolitical Risk | Low; primarily US-based operations | Low; primarily US-based operations |
The most impactful risks are regulatory and debt-related. Eversource’s higher debt ratio and lower interest coverage increase financial risk. Both face significant regulatory scrutiny due to their utility nature, with environmental policy shifts adding pressure. Consolidated Edison’s lower market volatility offers some stability, while Eversource has higher sensitivity to market changes.
Which Stock to Choose?
Consolidated Edison, Inc. (ED) shows a favorable income statement with strong gross and net margins and positive long-term growth in revenue and earnings. Its financial ratios are slightly unfavorable overall, with moderate profitability and a somewhat high debt level. The company’s rating is very favorable, supported by moderate overall scores despite some concerns in discounted cash flow and leverage.
Eversource Energy (ES) also presents a favorable income statement, marked by a solid gross margin but mixed growth results, with recent net income declines. Its financial ratios are more unfavorable, reflecting weaker liquidity and higher leverage, though it maintains a very favorable rating with moderate overall scores. The company’s profitability metrics are generally lower than ED’s, with challenges in return on equity and assets.
For investors, ED might appear more suitable for those prioritizing stable profitability and moderate growth, while ES could be interpreted as appealing to those willing to accept higher financial risk for potential rebound opportunities. Both companies currently show very unfavorable economic moats, indicating value destruction and declining returns on invested capital.
Disclaimer: Investment carries a risk of loss of initial capital. The past performance is not a reliable indicator of future results. Be sure to understand risks before making an investment decision.
Go Further
I encourage you to read the complete analyses of Consolidated Edison, Inc. and Eversource Energy to enhance your investment decisions: