In the regulated electric utilities sector, Consolidated Edison, Inc. (ED) and Evergy, Inc. (EVRG) stand out as influential players with distinct regional footprints and innovation approaches. ED serves a dense urban market in New York, emphasizing infrastructure and renewable projects, while EVRG operates across Kansas and Missouri with a diverse energy mix including renewables. This comparison will highlight which company offers the most compelling investment opportunity for your portfolio in 2026.
Table of contents
Companies Overview
I will begin the comparison between Consolidated Edison, Inc. and Evergy, Inc. by providing an overview of these two companies and their main differences.
Consolidated Edison, Inc. Overview
Consolidated Edison, Inc. operates in the regulated electric, gas, and steam delivery market in the US. It primarily serves about 3.5M electric customers in New York City and Westchester County, alongside gas and steam customers in Manhattan and surrounding areas. The company also develops renewable energy projects and invests in transmission infrastructure, positioning itself as a multifaceted utility provider with nearly 15,100 employees.
Evergy, Inc. Overview
Evergy, Inc. focuses on the generation, transmission, distribution, and sale of electricity in Kansas and Missouri. It utilizes a diverse energy mix including coal, hydroelectric, nuclear, natural gas, and renewables to serve roughly 1.62M customers. Established in 2017, Evergy operates extensive transmission and distribution lines and employs around 4,700 people, aiming to meet regional energy needs through a broad portfolio of power sources.
Key similarities and differences
Both companies operate in the regulated electric industry, providing essential utility services with significant transmission and distribution networks. However, Consolidated Edison has a longer history dating back to 1823 and serves a larger customer base primarily in New York, while Evergy, founded in 2017, serves fewer customers across two states with a more diversified generation portfolio including nuclear and landfill gas. Employee count and market capitalization also differ notably, reflecting scale and regional focus.
Income Statement Comparison
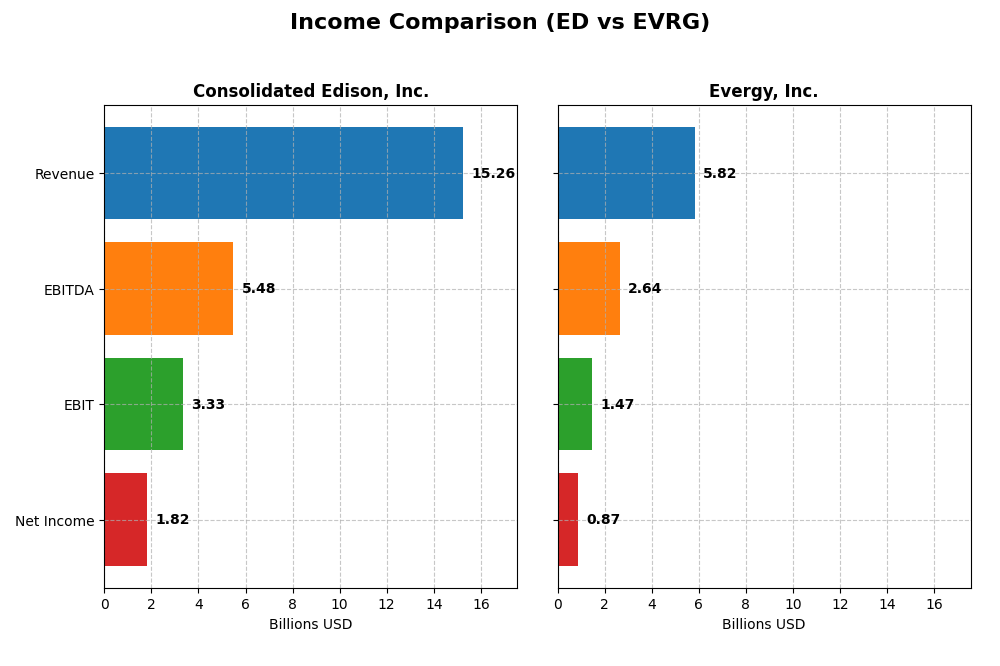
The table below compares the key income statement metrics for Consolidated Edison, Inc. and Evergy, Inc. for the fiscal year 2024.
| Metric | Consolidated Edison, Inc. (ED) | Evergy, Inc. (EVRG) |
|---|---|---|
| Market Cap | 35.8B | 16.8B |
| Revenue | 15.3B | 5.8B |
| EBITDA | 5.5B | 2.6B |
| EBIT | 3.3B | 1.5B |
| Net Income | 1.8B | 873.5M |
| EPS | 5.26 | 3.79 |
| Fiscal Year | 2024 | 2024 |
Income Statement Interpretations
Consolidated Edison, Inc.
Consolidated Edison’s revenue grew by 24.65% from 2020 to 2024, with net income up 65.3% over the same period. Margins showed mixed trends: gross margin was favorable at 64%, but EBIT and net margin declined in the latest year. In 2024, revenue growth slowed to 4.16%, while EBIT fell 17.51% and net margin dropped sharply, indicating margin pressure despite overall growth.
Evergy, Inc.
Evergy’s revenue increased 18.53% between 2020 and 2024, with net income rising 41.27%. Margins remained strong, with a 15% net margin and an improving EBIT margin of 25.26%. In 2024, revenue growth was steady at 6.17%, accompanied by a 15.15% EBIT increase and a 12.5% net margin improvement, reflecting strengthening profitability and operational efficiency.
Which one has the stronger fundamentals?
Both companies show favorable income statement fundamentals, but Evergy exhibits a higher proportion of favorable growth metrics—78.57% versus Consolidated Edison’s 57.14%. Evergy’s consistent margin expansion and earnings growth contrast with Consolidated Edison’s recent margin contraction and declining EBIT. This suggests Evergy currently demonstrates relatively stronger income statement fundamentals.
Financial Ratios Comparison
The following table compares key financial ratios for Consolidated Edison, Inc. (ED) and Evergy, Inc. (EVRG) based on their most recent fiscal year data from 2024.
| Ratios | Consolidated Edison, Inc. (ED) | Evergy, Inc. (EVRG) |
|---|---|---|
| ROE | 8.29% | 8.77% |
| ROIC | 3.48% | 4.52% |
| P/E | 16.96 | 16.23 |
| P/B | 1.41 | 1.42 |
| Current Ratio | 1.04 | 0.50 |
| Quick Ratio | 0.96 | 0.27 |
| D/E (Debt to Equity) | 1.27 | 1.41 |
| Debt-to-Assets | 39.4% | 43.6% |
| Interest Coverage | 2.30 | 2.57 |
| Asset Turnover | 0.22 | 0.18 |
| Fixed Asset Turnover | 0.29 | 0.23 |
| Payout ratio | 60.4% | 68.3% |
| Dividend yield | 3.56% | 4.21% |
Interpretation of the Ratios
Consolidated Edison, Inc.
Consolidated Edison presents a mixed ratio profile with favorable net margin (11.93%) and dividend yield (3.56%), but faces challenges in return on equity (8.29%) and asset turnover ratios, which are unfavorable. Its debt-to-equity ratio is somewhat high at 1.27, signaling financial leverage concerns. The company maintains a consistent dividend payout supported by stable cash flow, though free cash flow to equity remains negative, indicating potential risks in sustaining distributions.
Evergy, Inc.
Evergy shows a slightly unfavorable ratio balance with a strong net margin of 15.0% and a higher dividend yield at 4.21%. However, it struggles with liquidity ratios, with a current ratio of 0.5 and quick ratio at 0.27, both unfavorable, alongside a higher debt-to-equity ratio of 1.41. Despite these weaknesses, Evergy supports shareholder returns through dividends, but negative free cash flow to equity suggests caution regarding cash flow sustainability.
Which one has the best ratios?
Both companies exhibit slightly unfavorable overall ratio profiles. Consolidated Edison has a more balanced liquidity position and lower financial leverage but weaker returns on equity and asset utilization. Evergy offers better profitability margins and dividend yield but suffers from poor liquidity and higher leverage. Neither company displays a clearly superior ratio set, reflecting trade-offs between profitability, liquidity, and leverage.
Strategic Positioning
This section compares the strategic positioning of Consolidated Edison, Inc. (ED) and Evergy, Inc. (EVRG) including their market position, key segments, and exposure to technological disruption:
Consolidated Edison, Inc. (ED)
- Strong market position in New York region with moderate competition pressure in regulated electric utilities.
- Diverse revenue streams from electricity, oil and gas, steam, and non-utility services.
- Limited direct exposure to technological disruption; operates largely in regulated electric and gas delivery.
Evergy, Inc. (EVRG)
- Regional leader in Kansas and Missouri with moderate competitive pressure in regulated electric markets.
- Focused on electricity generation and transmission with multiple energy sources including renewables.
- Exposure to renewable technology integration; uses coal, natural gas, and renewable energy sources.
Consolidated Edison, Inc. vs Evergy, Inc. Positioning
ED has a diversified portfolio including electricity, gas, steam, and non-utility services, providing multiple business drivers. EVRG focuses on electricity generation with a broader energy mix including renewables. ED’s market is concentrated in New York, while EVRG operates regionally in Kansas and Missouri.
Which has the best competitive advantage?
Both companies are shedding value with ROIC below WACC; however, EVRG shows a growing ROIC trend suggesting improving profitability, while ED has declining ROIC, indicating deteriorating value creation. EVRG’s moat is slightly unfavorable versus ED’s very unfavorable position.
Stock Comparison
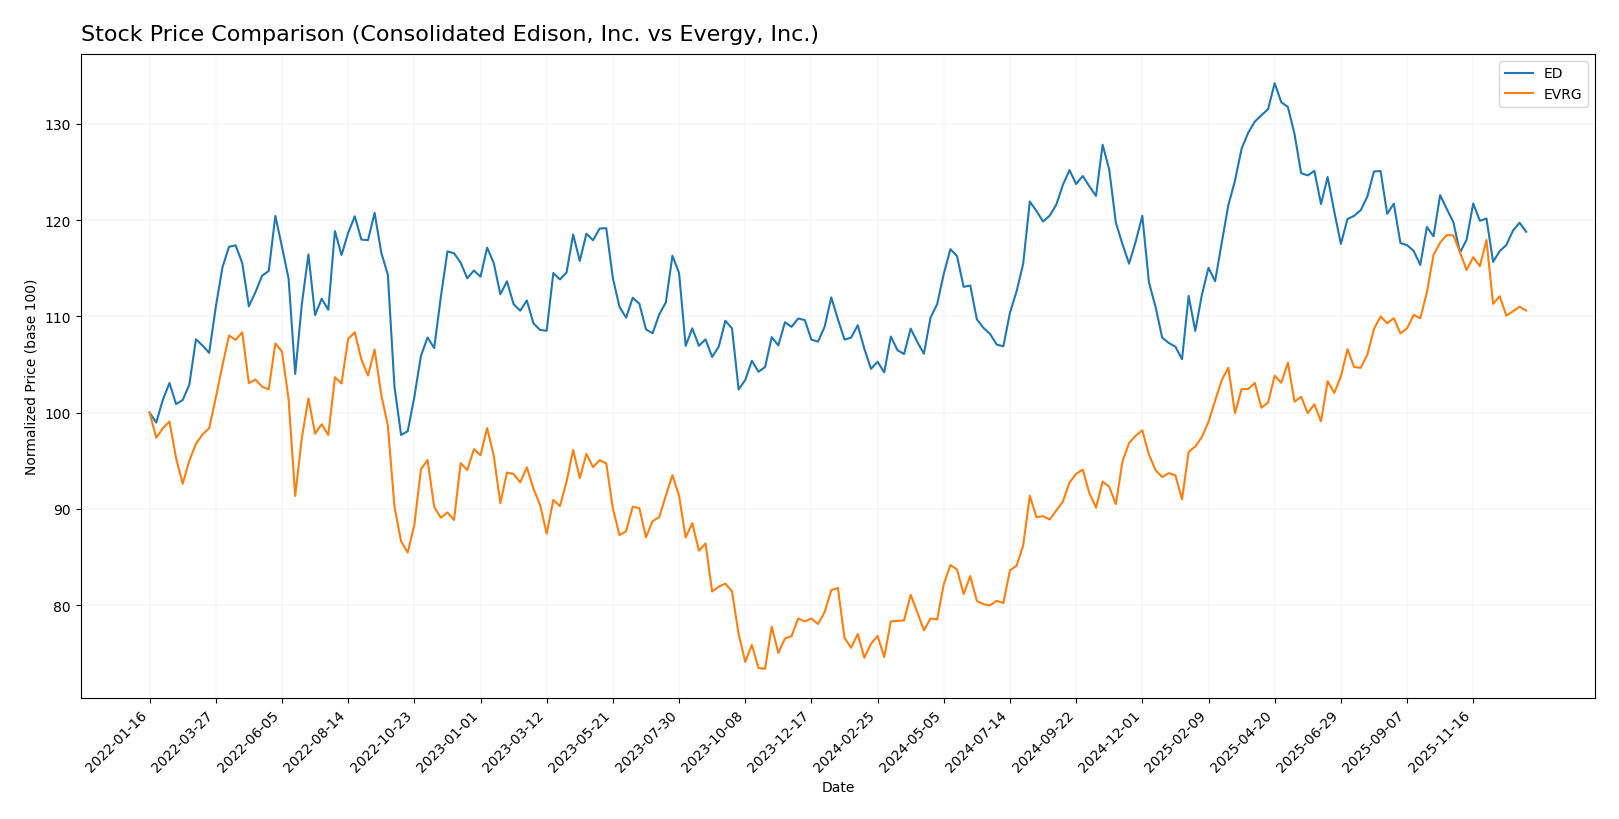
The stock prices of Consolidated Edison, Inc. (ED) and Evergy, Inc. (EVRG) have shown significant bullish trends over the past 12 months, with both experiencing deceleration in price momentum more recently.
Trend Analysis
Consolidated Edison’s stock gained 13.62% over the past year, indicating a bullish trend with decelerating momentum and a price range between 87.01 and 112.1. Recent months saw a slight neutral pullback of -0.83%.
Evergy’s stock rose sharply by 45.55% over the same period, also bullish with deceleration. The price fluctuated between 49.12 and 77.98, but recently declined by -6.59%, reflecting increased selling pressure.
Comparing both, Evergy delivered the highest market performance with a 45.55% gain, significantly outperforming Consolidated Edison’s 13.62% increase during the past year.
Target Prices
Analyst consensus indicates moderate upside potential for both Consolidated Edison, Inc. and Evergy, Inc.
| Company | Target High | Target Low | Consensus |
|---|---|---|---|
| Consolidated Edison, Inc. | 106 | 86 | 99.86 |
| Evergy, Inc. | 93 | 76 | 82.67 |
The target consensus for Consolidated Edison at 99.86 slightly exceeds its current price of 99.21, suggesting modest growth expectations. Evergy’s consensus target of 82.67 is notably above its current price of 72.82, indicating stronger upside potential from analyst estimates.
Analyst Opinions Comparison
This section compares analysts’ ratings and grades for Consolidated Edison, Inc. (ED) and Evergy, Inc. (EVRG):
Rating Comparison
ED Rating
- Rating: Both have a B- rating, considered very favorable by analysts.
- Discounted Cash Flow Score: Both score 1, rated very unfavorable for valuation.
- ROE Score: Both have a score of 3, indicating moderate efficiency in equity use.
- ROA Score: Both score 3, showing moderate effectiveness in asset utilization.
- Debt To Equity Score: Both have a score of 2, reflecting moderate financial risk.
- Overall Score: Both have an overall score of 2, classified as moderate.
EVRG Rating
- Rating: Both have a B- rating, considered very favorable by analysts.
- Discounted Cash Flow Score: Both score 1, rated very unfavorable for valuation.
- ROE Score: Both have a score of 3, indicating moderate efficiency in equity use.
- ROA Score: Both score 3, showing moderate effectiveness in asset utilization.
- Debt To Equity Score: Both have a score of 2, reflecting moderate financial risk.
- Overall Score: Both have an overall score of 2, classified as moderate.
Which one is the best rated?
Based strictly on the provided data, ED and EVRG share identical ratings and financial scores across all measured categories. Neither company is rated better than the other according to the available metrics.
Scores Comparison
Here is a comparison of the financial scores for Consolidated Edison, Inc. (ED) and Evergy, Inc. (EVRG):
ED Scores
- Altman Z-Score: 1.19, in distress zone indicating high bankruptcy risk
- Piotroski Score: 7, indicating strong financial health
EVRG Scores
- Altman Z-Score: 0.82, in distress zone indicating very high bankruptcy risk
- Piotroski Score: 5, indicating average financial health
Which company has the best scores?
Based on the provided data, ED has a higher Altman Z-Score and a stronger Piotroski Score than EVRG. ED’s scores suggest better financial strength relative to EVRG, which shows more distress and average financial health.
Grades Comparison
Here is a comparison of the recent grades assigned to Consolidated Edison, Inc. and Evergy, Inc.:
Consolidated Edison, Inc. Grades
The following table summarizes recent grades from reliable grading companies for Consolidated Edison, Inc.:
| Grading Company | Action | New Grade | Date |
|---|---|---|---|
| UBS | Maintain | Neutral | 2026-01-07 |
| UBS | Maintain | Neutral | 2025-12-17 |
| Keybanc | Maintain | Underweight | 2025-12-12 |
| JP Morgan | Maintain | Underweight | 2025-12-12 |
| Barclays | Maintain | Underweight | 2025-11-10 |
| Barclays | Maintain | Underweight | 2025-10-22 |
| Morgan Stanley | Maintain | Underweight | 2025-10-22 |
| Barclays | Maintain | Underweight | 2025-10-21 |
| Keybanc | Maintain | Underweight | 2025-10-15 |
| Morgan Stanley | Maintain | Underweight | 2025-09-25 |
Grades for Consolidated Edison predominantly indicate a cautious stance, with most actions maintaining an Underweight or Neutral rating.
Evergy, Inc. Grades
The following table presents recent grades from reliable grading companies for Evergy, Inc.:
| Grading Company | Action | New Grade | Date |
|---|---|---|---|
| Mizuho | Downgrade | Neutral | 2025-12-18 |
| UBS | Maintain | Buy | 2025-12-17 |
| Citigroup | Maintain | Buy | 2025-11-10 |
| Jefferies | Maintain | Buy | 2025-10-09 |
| Mizuho | Maintain | Outperform | 2025-08-08 |
| Mizuho | Maintain | Outperform | 2025-07-18 |
| Barclays | Maintain | Overweight | 2025-05-30 |
| Citigroup | Maintain | Buy | 2025-05-16 |
| UBS | Upgrade | Buy | 2025-04-28 |
| Barclays | Maintain | Overweight | 2025-04-22 |
Grades for Evergy show a generally positive outlook with multiple Buy and Outperform ratings, despite a recent downgrade by Mizuho to Neutral.
Which company has the best grades?
Evergy, Inc. has received overall better grades than Consolidated Edison, Inc., with more Buy and Outperform ratings compared to Consolidated Edison’s Underweight and Neutral grades. This difference may influence investor perception regarding potential growth and risk exposure.
Strengths and Weaknesses
Below is a comparative table summarizing the key strengths and weaknesses of Consolidated Edison, Inc. (ED) and Evergy, Inc. (EVRG) based on the most recent data.
| Criterion | Consolidated Edison, Inc. (ED) | Evergy, Inc. (EVRG) |
|---|---|---|
| Diversification | Moderate diversification with Electricity (10.8B), Oil and Gas (3.1B), Steam (569M) | Primarily focused on Electric Utility segment (2.7B) |
| Profitability | Net margin 11.93% (favorable), ROIC 3.48% (unfavorable), declining ROIC trend, value destroying | Net margin 15.0% (favorable), ROIC 4.52% (unfavorable), growing ROIC trend, slightly unfavorable moat |
| Innovation | Limited data on innovation; traditional utility business model | Similar traditional model; no strong innovation indicators |
| Global presence | Primarily regional U.S. utility, limited global exposure | Regional U.S. utility focus, limited global presence |
| Market Share | Strong regional market share in New York and surrounding areas | Strong market presence in Kansas and Missouri |
Key takeaways: Both companies operate primarily as regional utilities with limited diversification and global exposure. EVRG shows a more favorable profitability trend with improving ROIC, while ED faces declining efficiency in capital use. Neither demonstrates significant innovation, which is typical for this sector. Investors should weigh EVRG’s improving profitability against higher operational risks.
Risk Analysis
The table below compares key risk factors for Consolidated Edison, Inc. (ED) and Evergy, Inc. (EVRG) as of 2026, highlighting financial, regulatory, and operational vulnerabilities.
| Metric | Consolidated Edison, Inc. (ED) | Evergy, Inc. (EVRG) |
|---|---|---|
| Market Risk | Low beta (0.38) indicates lower stock volatility risk | Moderate beta (0.65), higher market sensitivity |
| Debt Level | Debt to equity 1.27 (unfavorable), interest coverage moderate (2.8) | Debt to equity 1.41 (unfavorable), interest coverage moderate (2.6) |
| Regulatory Risk | High, due to heavy regulation in NY and NJ utility sectors | Moderate, regulated in Kansas and Missouri |
| Operational Risk | Extensive infrastructure with aging assets, risk of outages | Large transmission network, moderate operational complexity |
| Environmental Risk | Transition to renewables ongoing but legacy fossil assets remain | Mix of coal, gas, renewables; exposure to carbon regulation risk |
| Geopolitical Risk | Minimal, primarily domestic US exposure | Minimal, primarily domestic US exposure |
Most impactful and likely risks include regulatory changes affecting utility rates and environmental policies pushing for cleaner energy. Both companies carry significant debt levels with moderate interest coverage, which could strain finances if interest rates rise. Consolidated Edison’s lower beta suggests more stable market performance compared to Evergy. Investors should monitor regulatory developments and debt management closely.
Which Stock to Choose?
Consolidated Edison, Inc. (ED) shows a favorable income statement with strong gross and net margins, yet its recent profitability and EPS growth declined. Financial ratios are slightly unfavorable overall, with moderate debt and neutral liquidity. The company is shedding value as ROIC is below WACC and declining. Its rating is very favorable at B-, though some score components signal caution.
Evergy, Inc. (EVRG) displays a favorable income statement with improving profitability and growth metrics, including a rising EBIT margin and net margin growth. Financial ratios are slightly unfavorable, mainly due to weak liquidity and higher leverage. The company is also shedding value but with a growing ROIC trend. EVRG shares the same very favorable B- rating, though its financial scores are more moderate.
Investors focused on growth and improving profitability might find Evergy’s rising ROIC and stronger income growth appealing, while those prioritizing stable income and dividend yield could view Consolidated Edison’s solid margins and rating as favorable. Both companies show some value destruction, suggesting it might be prudent to carefully monitor their capital efficiency trends.
Disclaimer: Investment carries a risk of loss of initial capital. The past performance is not a reliable indicator of future results. Be sure to understand risks before making an investment decision.
Go Further
I encourage you to read the complete analyses of Consolidated Edison, Inc. and Evergy, Inc. to enhance your investment decisions: