Entergy Corporation (ETR) and Consolidated Edison, Inc. (ED) are two major players in the regulated electric utility sector, serving millions of customers across different U.S. regions. Both companies focus on delivering reliable energy while investing in innovation and sustainable infrastructure. Their overlapping markets and strategic approaches make them natural competitors. In this article, I will analyze their strengths and challenges to help you decide which is the more attractive investment opportunity.
Table of contents
Companies Overview
I will begin the comparison between Entergy Corporation and Consolidated Edison, Inc. by providing an overview of these two companies and their main differences.
Entergy Corporation Overview
Entergy Corporation is a U.S.-based utility company engaged in the production and retail distribution of electricity. It operates in two main segments: Utility and Entergy Wholesale Commodities. Serving around 3 million customers in Arkansas, Louisiana, Mississippi, and Texas, Entergy generates electricity from diverse sources including gas, nuclear, coal, hydro, and solar power, with a total generating capacity of approximately 26,000 MW.
Consolidated Edison, Inc. Overview
Consolidated Edison, Inc. provides regulated electric, gas, and steam delivery services primarily in New York City, Westchester County, and parts of New Jersey. It serves about 3.5 million electric customers and over 1 million gas customers. The company also operates extensive transmission and distribution infrastructure and invests in renewable and energy projects, emphasizing a broad energy portfolio targeting residential, commercial, and government sectors.
Key similarities and differences
Both companies operate within the regulated electric utility sector in the U.S., serving millions of customers with electricity distribution. Entergy focuses on both retail and wholesale electricity generation with a diverse power mix including nuclear and renewables, while Consolidated Edison emphasizes regulated delivery of electric, gas, and steam primarily in urban markets. Additionally, Consolidated Edison has a larger workforce and a significant presence in natural gas and steam services, contrasting with Entergy’s broader geographic footprint and generation assets.
Income Statement Comparison
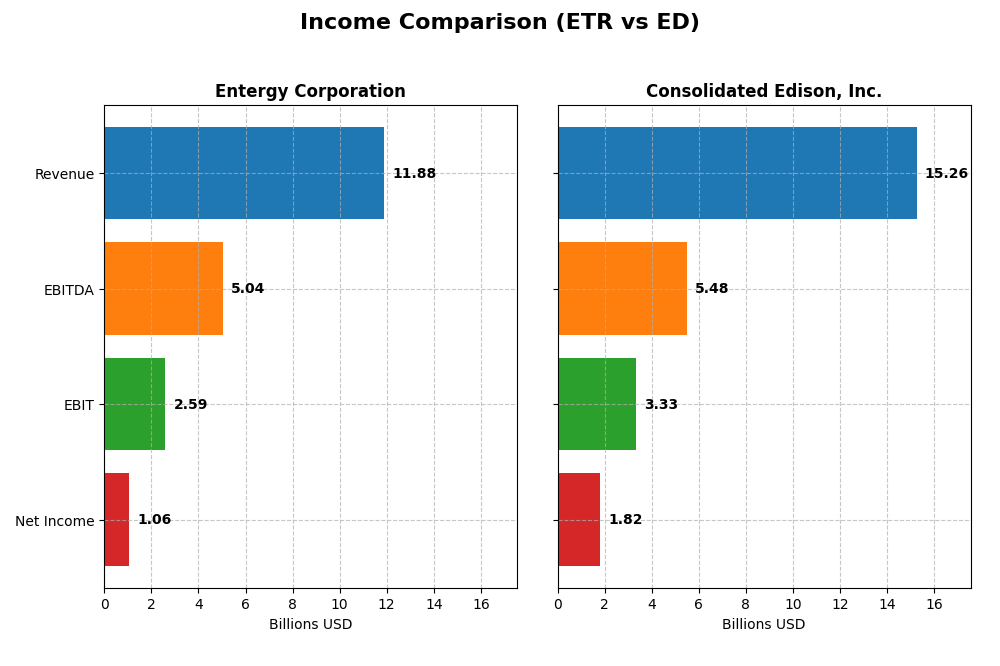
The table below compares key income statement metrics for Entergy Corporation and Consolidated Edison, Inc. for the fiscal year 2024.
| Metric | Entergy Corporation (ETR) | Consolidated Edison, Inc. (ED) |
|---|---|---|
| Market Cap | 41.8B | 35.8B |
| Revenue | 11.9B | 15.3B |
| EBITDA | 5.04B | 5.48B |
| EBIT | 2.59B | 3.33B |
| Net Income | 1.06B | 1.82B |
| EPS | 2.47 | 5.26 |
| Fiscal Year | 2024 | 2024 |
Income Statement Interpretations
Entergy Corporation
From 2020 to 2024, Entergy Corporation’s revenue grew by 17.46%, but net income declined by 24.56%, reflecting pressure on profitability. Gross and EBIT margins remained favorable at 48.3% and 21.83%, respectively, although net margin dropped to 8.93%. In 2024, revenue fell by 2.2%, EBIT decreased 3.18%, and net margin contracted sharply, signaling recent operational challenges.
Consolidated Edison, Inc.
Consolidated Edison showed a 24.65% revenue increase and a strong 65.3% rise in net income over the 2020–2024 period. Gross margin stood at a healthy 63.99%, with EBIT margin stable near 21.79%. Despite a 17.51% EBIT decline and a 30.64% dip in net margin in 2024, overall margin trends and earnings per share growth have been positive, indicating solid underlying performance.
Which one has the stronger fundamentals?
Consolidated Edison demonstrates stronger fundamentals with favorable growth in revenue, net income, and margins over the period, despite some short-term margin compression in 2024. Entergy’s revenue growth is positive but offset by declining net income and margins, leading to an overall unfavorable income statement evaluation. The contrast highlights Consolidated Edison’s comparatively more resilient profitability and earnings expansion.
Financial Ratios Comparison
The table below presents a side-by-side comparison of key financial ratios for Entergy Corporation (ETR) and Consolidated Edison, Inc. (ED) based on the most recent fiscal year 2024 data.
| Ratios | Entergy Corporation (ETR) | Consolidated Edison, Inc. (ED) |
|---|---|---|
| ROE | 7.0% | 8.3% |
| ROIC | 3.2% | 3.5% |
| P/E | 30.6 | 17.0 |
| P/B | 2.14 | 1.41 |
| Current Ratio | 0.72 | 1.04 |
| Quick Ratio | 0.43 | 0.96 |
| D/E (Debt-to-Equity) | 1.91 | 1.27 |
| Debt-to-Assets | 44.6% | 39.4% |
| Interest Coverage | 2.30 | 2.30 |
| Asset Turnover | 0.18 | 0.22 |
| Fixed Asset Turnover | 0.25 | 0.29 |
| Payout ratio | 94.2% | 60.4% |
| Dividend yield | 3.1% | 3.6% |
Interpretation of the Ratios
Entergy Corporation
Entergy Corporation shows several unfavorable ratios, including a low return on equity (7.02%) and return on invested capital (3.2%), with a weak current ratio of 0.72 indicating liquidity concerns. The company’s dividend yield is favorable at 3.08%, suggesting a consistent dividend policy, but high leverage and valuation multiples may pose risks to sustainability.
Consolidated Edison, Inc.
Consolidated Edison presents a stronger net margin (11.93%) and a favorable dividend yield of 3.56%, reflecting solid shareholder returns. However, some key ratios such as return on equity (8.29%) and debt-to-equity ratio (1.27) remain unfavorable, suggesting moderate financial risk. Liquidity ratios near 1.0 demonstrate reasonable short-term financial health.
Which one has the best ratios?
Consolidated Edison exhibits a better balance of favorable and neutral ratios, including a stronger net margin and dividend yield, compared to Entergy’s predominance of unfavorable metrics. While neither company is without risk, Consolidated Edison’s financial ratios appear slightly more robust, reflecting relatively lower leverage and better liquidity.
Strategic Positioning
This section compares the strategic positioning of Entergy Corporation and Consolidated Edison, Inc., including market position, key segments, and exposure to technological disruption:
Entergy Corporation
- Operates in regulated electric industry with moderate competition pressure.
- Key segments: Utility (electricity, natural gas); Wholesale Commodities (nuclear, gas, coal, hydro, solar).
- Exposure to technological disruption includes diverse power generation sources including nuclear and renewables.
Consolidated Edison, Inc.
- Regulated electric, gas, and steam delivery with low competition pressure.
- Key segments: Electricity, oil and gas purchased, steam, non-utility products and services.
- Exposure through energy infrastructure projects and renewable energy developments.
Entergy Corporation vs Consolidated Edison, Inc. Positioning
Entergy has a diversified approach with both regulated utility and wholesale commodity operations, while Consolidated Edison focuses on regulated delivery of electric, gas, and steam services with additional non-utility products. Entergy’s broader generation mix contrasts with Con Edison’s infrastructure and service orientation.
Which has the best competitive advantage?
Both companies show very unfavorable MOAT evaluations with declining ROIC below WACC, indicating they are currently destroying value and facing profitability challenges, which weakens their competitive advantages based on available data.
Stock Comparison
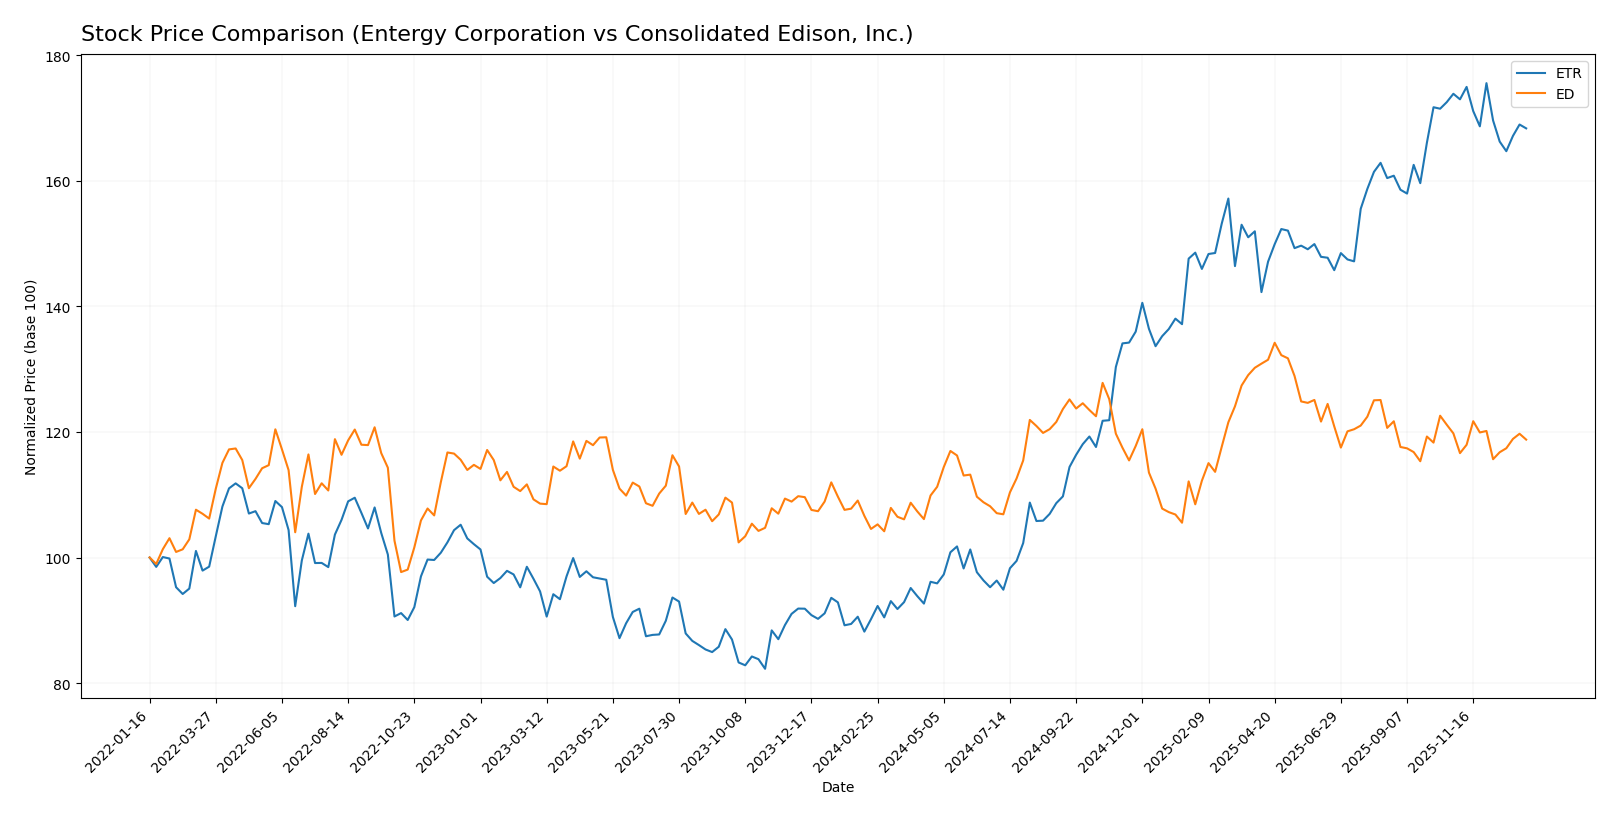
The stock price chart highlights significant price appreciation for Entergy Corporation (ETR) and moderate gains for Consolidated Edison, Inc. (ED) over the past 12 months, with recent trading dynamics showing contrasting buyer dominance and volume trends.
Trend Analysis
Entergy Corporation (ETR) exhibited a strong bullish trend over the past year, with an 86.74% price increase and decelerating growth. The stock fluctuated between 50.08 and 97.52, with a recent slight decline of 3.17%.
Consolidated Edison, Inc. (ED) showed a bullish but more moderate 13.62% price rise over the same period, also with decelerating momentum. Recent price movement was nearly neutral, down by 0.83%, with less volatility than ETR.
Comparing the two, Entergy Corporation delivered the highest market performance with a substantially larger overall price increase, despite recent short-term weakness relative to Consolidated Edison.
Target Prices
Analysts show a moderate bullish consensus for Entergy Corporation and Consolidated Edison, Inc.
| Company | Target High | Target Low | Consensus |
|---|---|---|---|
| Entergy Corporation | 115 | 91 | 103.17 |
| Consolidated Edison, Inc. | 106 | 86 | 99.86 |
Entergy’s consensus target of 103.17 suggests a potential upside from the current price of 93.52 USD. Consolidated Edison’s consensus near 99.86 is also slightly above its current price of 99.21 USD, indicating modest growth expectations.
Analyst Opinions Comparison
This section compares analysts’ ratings and grades for Entergy Corporation and Consolidated Edison, Inc.:
Rating Comparison
ETR Rating
- Rating: B- with a Very Favorable status.
- Discounted Cash Flow Score: 1, Very Unfavorable.
- ROE Score: 4, Favorable, indicating strong profit generation from equity.
- ROA Score: 3, Moderate, reflecting average asset utilization.
- Debt To Equity Score: 2, Moderate financial risk.
- Overall Score: 2, Moderate overall financial standing.
ED Rating
- Rating: B- with a Very Favorable status.
- Discounted Cash Flow Score: 1, Very Unfavorable.
- ROE Score: 3, Moderate, showing average efficiency in profit generation.
- ROA Score: 3, Moderate, reflecting average asset utilization.
- Debt To Equity Score: 2, Moderate financial risk.
- Overall Score: 2, Moderate overall financial standing.
Which one is the best rated?
Both Entergy Corporation and Consolidated Edison, Inc. share the same overall rating of B- and similar moderate overall scores. Entergy shows a higher ROE score (4 vs. 3), suggesting more efficient use of equity, while other scores are largely comparable.
Scores Comparison
Here is a comparison of the financial health scores for Entergy Corporation and Consolidated Edison, Inc.:
ETR Scores
- Altman Z-Score: 1.04, indicating financial distress zone with high bankruptcy risk.
- Piotroski Score: 4, reflecting average financial strength and moderate value.
ED Scores
- Altman Z-Score: 1.19, also in distress zone, suggesting high bankruptcy risk.
- Piotroski Score: 7, showing strong financial health and good investment potential.
Which company has the best scores?
Based on the Altman Z-Score, both companies are in financial distress zones, but ED has a slightly higher score. ED’s Piotroski Score of 7 indicates stronger financial health compared to ETR’s score of 4. Overall, ED shows better scores in this data set.
Grades Comparison
The following is a detailed comparison of the latest grades assigned to Entergy Corporation and Consolidated Edison, Inc.:
Entergy Corporation Grades
This table presents recent grades and actions from reputable grading companies for Entergy Corporation.
| Grading Company | Action | New Grade | Date |
|---|---|---|---|
| Argus Research | Maintain | Buy | 2026-01-06 |
| UBS | Maintain | Buy | 2025-12-17 |
| Keybanc | Maintain | Overweight | 2025-12-12 |
| JP Morgan | Maintain | Overweight | 2025-12-11 |
| Citigroup | Maintain | Neutral | 2025-11-18 |
| Evercore ISI Group | Maintain | In Line | 2025-10-30 |
| Mizuho | Maintain | Outperform | 2025-10-27 |
| Morgan Stanley | Maintain | Equal Weight | 2025-10-22 |
| B of A Securities | Maintain | Neutral | 2025-10-16 |
| Keybanc | Maintain | Overweight | 2025-10-15 |
Entergy’s grades predominantly indicate positive sentiment, with multiple “Buy” and “Overweight” ratings sustained by major firms, suggesting a generally bullish outlook.
Consolidated Edison, Inc. Grades
This table shows the most recent grades and actions from verified grading companies for Consolidated Edison, Inc.
| Grading Company | Action | New Grade | Date |
|---|---|---|---|
| UBS | Maintain | Neutral | 2026-01-07 |
| UBS | Maintain | Neutral | 2025-12-17 |
| Keybanc | Maintain | Underweight | 2025-12-12 |
| JP Morgan | Maintain | Underweight | 2025-12-12 |
| Barclays | Maintain | Underweight | 2025-11-10 |
| Barclays | Maintain | Underweight | 2025-10-22 |
| Morgan Stanley | Maintain | Underweight | 2025-10-22 |
| Barclays | Maintain | Underweight | 2025-10-21 |
| Keybanc | Maintain | Underweight | 2025-10-15 |
| Morgan Stanley | Maintain | Underweight | 2025-09-25 |
Consolidated Edison’s grades consistently reflect a cautious to negative stance, with a majority “Underweight” and “Neutral” ratings, implying a more reserved market outlook.
Which company has the best grades?
Entergy Corporation has received stronger grades, predominantly “Buy” and “Overweight,” compared to Consolidated Edison’s prevailing “Underweight” and “Neutral” ratings. This suggests investors may perceive Entergy as having better growth or value potential, while Consolidated Edison faces more skepticism regarding performance or risk.
Strengths and Weaknesses
Below is a comparison table highlighting key strengths and weaknesses of Entergy Corporation (ETR) and Consolidated Edison, Inc. (ED) based on recent financial and operational data.
| Criterion | Entergy Corporation (ETR) | Consolidated Edison, Inc. (ED) |
|---|---|---|
| Diversification | Moderate; revenue spread across Commercial, Industrial, Residential, and Regulated Natural Gas segments | Moderate; diversified across Electricity, Oil & Gas Purchased, Steam, and Non-Utility Products |
| Profitability | Low profitability; ROIC 3.2% below WACC; declining trend; net margin neutral at 8.93% | Slightly better; ROIC 3.48% also below WACC; net margin favorable at 11.93% but ROIC declining sharply |
| Innovation | Limited data; no strong indicators of innovation or R&D focus | Limited data; no clear innovation leadership visible |
| Global presence | Primarily U.S. regulated markets with limited geographic diversification | U.S.-focused utility with regional strength; no significant global footprint |
| Market Share | Strong regional utility presence with steady residential segment (~4.5B USD revenue) | Strong regional utility with large electricity segment (~10.8B USD revenue) and complementary products |
Key takeaways: Both companies face challenges with declining ROIC and are currently value destroyers despite stable revenue streams. Consolidated Edison shows slightly better profitability metrics and dividend yield but neither demonstrates strong innovation or global diversification. Caution and rigorous risk management are advised when considering these utilities for investment.
Risk Analysis
The table below summarizes key risks for Entergy Corporation (ETR) and Consolidated Edison, Inc. (ED) as of 2024, helping investors assess their risk exposure.
| Metric | Entergy Corporation (ETR) | Consolidated Edison, Inc. (ED) |
|---|---|---|
| Market Risk | Beta 0.65 (moderate volatility) | Beta 0.38 (low volatility) |
| Debt level | High debt-to-equity 1.91 (unfavorable) | Moderate debt-to-equity 1.27 (unfavorable) |
| Regulatory Risk | High, due to nuclear energy operations and regional regulations | High, extensive regulated utility operations in NYC area |
| Operational Risk | Moderate, nuclear plant decommissioning and diverse generation mix | Moderate, infrastructure aging and urban complexity |
| Environmental Risk | Significant, nuclear and fossil fuel plants impact | Moderate, focus on renewable projects but urban emissions concerns |
| Geopolitical Risk | Low, primarily US-based operations | Low, primarily US-based operations |
Both companies face notable regulatory and environmental risks given their utility sector operations, with Entergy’s higher debt level and nuclear portfolio adding financial and operational complexity. Recent financial distress signals, including Altman Z-Scores in the distress zone, highlight caution. Consolidated Edison shows somewhat stronger financial health but still carries risks from urban infrastructure challenges.
Which Stock to Choose?
Entergy Corporation (ETR) shows a mixed income evolution with a favorable gross and EBIT margin but declining net margin and EPS growth over the period. Financial ratios are mostly unfavorable, with a high debt level and a weak current ratio. Profitability is low, and the company is rated B- with a very favorable overall rating but moderate scores. Its economic moat evaluation is very unfavorable, indicating value destruction.
Consolidated Edison, Inc. (ED) exhibits favorable income statement metrics, including strong revenue, net income growth, and high margins. Financial ratios are more balanced, with several favorable indicators and moderate debt. Profitability ratios suggest moderate strength, and it holds a B- rating with very favorable status. The company’s economic moat is also very unfavorable, signaling declining profitability and value erosion.
For investors prioritizing growth and income quality, ED’s favorable income trends and balanced ratios might appear more attractive. Conversely, investors inclined toward value metrics and higher dividend yield could interpret ETR’s profile differently, despite its weaker profitability and financial ratios. Both companies show declining moats, suggesting caution regarding long-term value creation.
Disclaimer: Investment carries a risk of loss of initial capital. The past performance is not a reliable indicator of future results. Be sure to understand risks before making an investment decision.
Go Further
I encourage you to read the complete analyses of Entergy Corporation and Consolidated Edison, Inc. to enhance your investment decisions: