In the regulated electric utilities sector, Consolidated Edison, Inc. (ED) and Edison International (EIX) stand as two prominent players with substantial market presence and long histories. Both companies serve millions of customers with electricity but operate in distinct geographic regions—New York and California respectively—while pursuing innovation in energy infrastructure and renewable integration. This comparison will help investors identify which company offers the most compelling opportunity for a balanced, risk-conscious portfolio in 2026.
Table of contents
Companies Overview
I will begin the comparison between Consolidated Edison, Inc. and Edison International by providing an overview of these two companies and their main differences.
Consolidated Edison, Inc. Overview
Consolidated Edison, Inc. operates in the regulated electric, gas, and steam delivery sectors in the US, serving around 3.5M electric, 1.1M gas, and 1,555 steam customers primarily in New York City and surrounding areas. The company manages extensive transmission and distribution infrastructure, invests in renewable energy projects, and targets industrial, commercial, residential, and government clients. Founded in 1823, it is based in New York City.
Edison International Overview
Edison International generates and distributes electric power to approximately 15M customers in Southern, Central, and Coastal California. Its services extend to residential, commercial, industrial, and agricultural sectors, supported by a vast transmission and distribution network including 39,000 circuit-miles of overhead lines and 31,000 circuit-miles of underground lines. Founded in 1886, the company is headquartered in Rosemead, California.
Key similarities and differences
Both companies operate in the regulated electric utility industry, providing power to a diverse customer base through extensive transmission and distribution systems. While Consolidated Edison also delivers gas and steam services, Edison International focuses solely on electricity generation and distribution in California. Consolidated Edison serves fewer customers but offers broader energy services, whereas Edison International handles a larger customer base concentrated in one state.
Income Statement Comparison
The following table compares key income statement metrics for Consolidated Edison, Inc. and Edison International for the fiscal year 2024, providing a snapshot of their financial performance.

| Metric | Consolidated Edison, Inc. (ED) | Edison International (EIX) |
|---|---|---|
| Market Cap | 35.8B | 23.5B |
| Revenue | 15.3B | 17.6B |
| EBITDA | 5.5B | 6.4B |
| EBIT | 3.3B | 3.4B |
| Net Income | 1.8B | 1.5B |
| EPS | 5.26 | 3.33 |
| Fiscal Year | 2024 | 2024 |
Income Statement Interpretations
Consolidated Edison, Inc.
From 2020 to 2024, Consolidated Edison, Inc. showed steady revenue growth of 24.65% and net income increased by 65.3%, reflecting a favorable trend. Gross and EBIT margins remained strong, at around 64% and 21.8% respectively. However, in 2024, growth slowed with a 4.16% revenue rise but declines in EBIT (-17.5%) and net margin (-30.6%), indicating margin pressures despite solid overall fundamentals.
Edison International
Edison International experienced a 29.61% revenue growth and a 77.5% increase in net income over the five-year span. Gross margin held at 41%, while EBIT margin improved to 19.5%. The latest year showed positive momentum with 7.72% revenue growth and 9.75% EBIT growth, alongside a stable net margin, signaling operational efficiency gains and consistent profitability improvements in 2024.
Which one has the stronger fundamentals?
Both companies exhibit favorable long-term growth in revenue and net income with solid margins. Consolidated Edison maintains higher gross and net margins but faced recent declines in profitability metrics. Edison International shows more consistent growth and margin improvement in the latest year with fewer unfavorable signals. Overall, Edison International’s income statement reflects stronger recent operational performance and margin expansion.
Financial Ratios Comparison
This table presents the latest available key financial ratios for Consolidated Edison, Inc. (ED) and Edison International (EIX) as of fiscal year 2024, enabling a side-by-side comparison of their financial performance and stability.
| Ratios | Consolidated Edison, Inc. (ED) | Edison International (EIX) |
|---|---|---|
| ROE | 8.29% | 9.93% |
| ROIC | 3.48% | 3.61% |
| P/E | 16.96 | 19.93 |
| P/B | 1.41 | 1.98 |
| Current Ratio | 1.04 | 0.85 |
| Quick Ratio | 0.96 | 0.78 |
| D/E (Debt to Equity) | 1.27 | 2.43 |
| Debt-to-Assets | 39.4% | 44.1% |
| Interest Coverage | 2.30 | 1.57 |
| Asset Turnover | 0.22 | 0.21 |
| Fixed Asset Turnover | 0.29 | 0.29 |
| Payout Ratio | 60.4% | 83.2% |
| Dividend Yield | 3.56% | 4.17% |
Interpretation of the Ratios
Consolidated Edison, Inc.
Consolidated Edison presents a mixed ratio profile with a favorable net margin of 11.93% and a solid dividend yield of 3.56%. However, it faces challenges with an unfavorable return on equity (8.29%) and return on invested capital (3.48%), alongside high debt-to-equity at 1.27. The company maintains a stable dividend payout supported by consistent free cash flow, though some leverage concerns remain.
Edison International
Edison International shows a less favorable financial stance with a lower net margin at 8.78% and a higher debt-to-equity ratio of 2.43, indicating increased financial risk. Its dividend yield is slightly higher at 4.17%, but liquidity ratios like the current ratio at 0.85 are weaker. The firm’s return metrics, including ROE at 9.93%, remain below ideal levels, reflecting ongoing operational pressures.
Which one has the best ratios?
Between the two, Consolidated Edison’s ratios are slightly more favorable, benefiting from stronger profitability margins, better liquidity, and a more moderate debt profile. Edison International exhibits more unfavorable ratios with higher leverage and weaker liquidity, leading to a less positive overall financial outlook based on the evaluated metrics.
Strategic Positioning
This section compares the strategic positioning of Consolidated Edison, Inc. (ED) and Edison International (EIX), focusing on market position, key segments, and exposure to technological disruption:
Consolidated Edison, Inc. (ED)
- Strong presence in New York and surrounding areas, facing regulated competitive pressure.
- Diversified segments including electricity, oil and gas, steam, and non-utility services.
- Limited explicit exposure to technological disruption mentioned in current data.
Edison International (EIX)
- Operates mainly in California with a large customer base, under regulated market conditions.
- Focused on electricity generation and distribution, with competitive power generation segment.
- No explicit information on technological disruption exposure provided.
ED vs EIX Positioning
ED follows a diversified approach across multiple energy products and services, while EIX concentrates on electric power generation and distribution in California. ED’s diversity offers multiple revenue streams; EIX’s focus provides scale advantages in a single region.
Which has the best competitive advantage?
Both companies are shedding value with ROIC below WACC. ED shows very unfavorable declining returns, whereas EIX has slightly unfavorable status but improving profitability, indicating a relatively stronger competitive position.
Stock Comparison
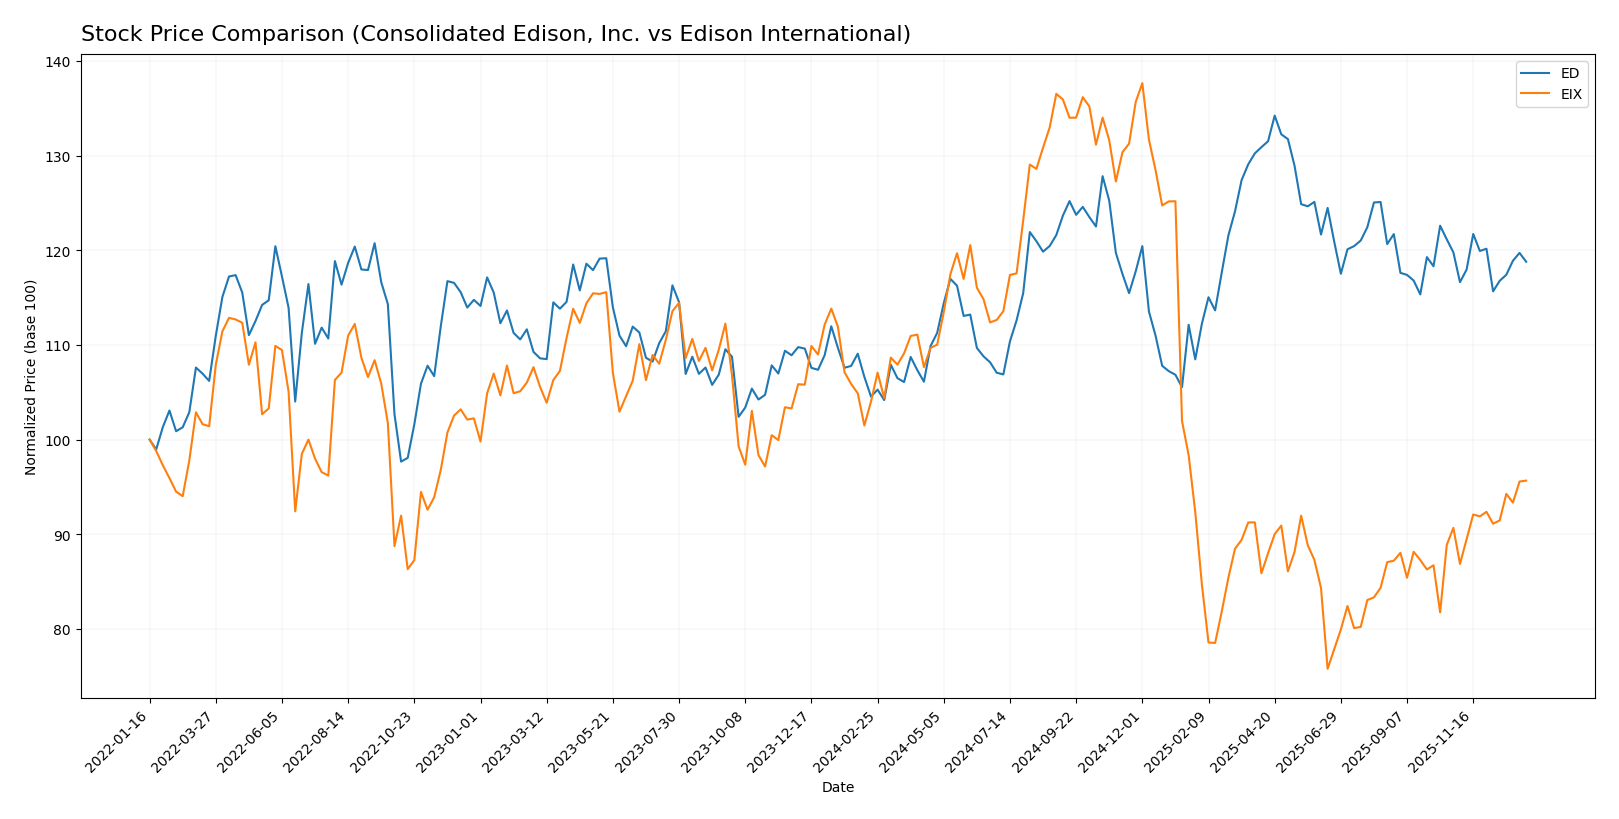
The stock prices of Consolidated Edison, Inc. and Edison International over the past 12 months reveal contrasting trends, with notable price shifts and varied buyer dominance in recent trading sessions.
Trend Analysis
Consolidated Edison, Inc. (ED) showed a bullish trend over the past 12 months with a 13.62% price increase, though its upward momentum decelerated. The stock ranged from a low of 87.01 to a high of 112.1, with moderate volatility (6.0 std deviation).
Edison International (EIX) experienced a bearish trend over the past 12 months, declining by 8.02% with accelerating downward momentum. Price fluctuated between 48.32 and 87.75, showing higher volatility (12.11 std deviation).
Comparing the two, Consolidated Edison delivered stronger market performance with a positive 13.62% gain, while Edison International lagged with an 8.02% loss over the same period.
Target Prices
The analyst consensus presents a moderate upside potential for both Consolidated Edison, Inc. and Edison International based on current target prices.
| Company | Target High | Target Low | Consensus |
|---|---|---|---|
| Consolidated Edison, Inc. | 106 | 86 | 99.86 |
| Edison International | 70 | 56 | 62 |
Analysts expect Consolidated Edison’s stock price to hover slightly above its current price of 99.21 USD, while Edison International’s consensus target indicates a modest increase from its present 60.99 USD. Overall, both stocks show potential for appreciation within a reasonable range.
Analyst Opinions Comparison
This section compares analysts’ ratings and grades for Consolidated Edison, Inc. and Edison International:
Rating Comparison
ED Rating
- Rating: B-, considered very favorable overall.
- Discounted Cash Flow Score: 1, rated very unfavorable, indicating concerns in cash flow valuation.
- ROE Score: 3, moderate efficiency in generating profit from equity.
- ROA Score: 3, moderate utilization of assets to generate earnings.
- Debt To Equity Score: 2, moderate financial risk with some reliance on debt.
- Overall Score: 2, moderate overall financial standing.
EIX Rating
- Rating: B+, considered very favorable overall.
- Discounted Cash Flow Score: 1, rated very unfavorable, indicating similar concerns in cash flow valuation.
- ROE Score: 5, very favorable, showing strong efficiency in profit generation from equity.
- ROA Score: 4, favorable utilization of assets for earnings.
- Debt To Equity Score: 1, very unfavorable, indicating higher financial risk due to debt levels.
- Overall Score: 3, moderate but stronger overall financial standing than ED.
Which one is the best rated?
Based strictly on the provided data, Edison International (EIX) holds a higher overall rating (B+) and stronger scores in ROE and ROA than Consolidated Edison (ED). However, EIX’s debt to equity score is less favorable than ED’s, indicating higher financial risk.
Scores Comparison
Here is a comparison of the Altman Z-Score and Piotroski Score for Consolidated Edison, Inc. and Edison International:
Consolidated Edison, Inc. (ED) Scores
- Altman Z-Score: 1.19, in distress zone indicating high risk
- Piotroski Score: 7, classified as strong financial health
Edison International (EIX) Scores
- Altman Z-Score: 0.72, also in distress zone with higher bankruptcy risk
- Piotroski Score: 6, classified as average financial strength
Which company has the best scores?
Based strictly on the provided data, Consolidated Edison, Inc. shows a higher Piotroski Score of 7 versus Edison International’s 6, indicating stronger financial health. Both companies are in the distress zone by Altman Z-Score, but ED’s score is slightly higher.
Grades Comparison
Here is a comparison of the recent stock grades and ratings for Consolidated Edison, Inc. and Edison International:
Consolidated Edison, Inc. Grades
The table below shows the recent grades assigned by reputable financial institutions:
| Grading Company | Action | New Grade | Date |
|---|---|---|---|
| UBS | Maintain | Neutral | 2026-01-07 |
| UBS | Maintain | Neutral | 2025-12-17 |
| Keybanc | Maintain | Underweight | 2025-12-12 |
| JP Morgan | Maintain | Underweight | 2025-12-12 |
| Barclays | Maintain | Underweight | 2025-11-10 |
| Barclays | Maintain | Underweight | 2025-10-22 |
| Morgan Stanley | Maintain | Underweight | 2025-10-22 |
| Barclays | Maintain | Underweight | 2025-10-21 |
| Keybanc | Maintain | Underweight | 2025-10-15 |
| Morgan Stanley | Maintain | Underweight | 2025-09-25 |
Overall, Consolidated Edison’s grades predominantly indicate a cautious stance with multiple underweight ratings and neutral consensus.
Edison International Grades
Below is the summary of the latest grades from credible grading companies:
| Grading Company | Action | New Grade | Date |
|---|---|---|---|
| Morgan Stanley | Maintain | Underweight | 2025-12-17 |
| JP Morgan | Maintain | Neutral | 2025-12-12 |
| UBS | Maintain | Buy | 2025-12-02 |
| Ladenburg Thalmann | Maintain | Neutral | 2025-10-30 |
| Barclays | Maintain | Overweight | 2025-10-29 |
| Jefferies | Maintain | Hold | 2025-10-22 |
| Morgan Stanley | Maintain | Underweight | 2025-10-22 |
| Barclays | Maintain | Overweight | 2025-10-21 |
| Jefferies | Downgrade | Hold | 2025-10-02 |
| JP Morgan | Maintain | Neutral | 2025-09-25 |
Edison International’s grades show a more positive outlook, featuring buy and overweight ratings alongside a consensus of “Buy.”
Which company has the best grades?
Edison International has received notably better grades than Consolidated Edison, with more buy and overweight recommendations, implying a stronger market confidence which could impact investor sentiment positively. Consolidated Edison’s predominance of underweight and neutral grades suggests a more cautious market view, possibly reflecting higher perceived risks or slower growth prospects.
Strengths and Weaknesses
Below is a comparative overview of key strengths and weaknesses for Consolidated Edison, Inc. (ED) and Edison International (EIX) based on the most recent financial and operational data.
| Criterion | Consolidated Edison, Inc. (ED) | Edison International (EIX) |
|---|---|---|
| Diversification | Moderate diversification with Electricity (10.8B USD) and Oil & Gas Purchased (3.1B USD) segments, plus Steam and Non-Utility products | Primarily focused on Electric Utility (10.6B USD) and Competitive Power Generation (data dated to 2011) |
| Profitability | Net margin 11.93% (favorable), but ROIC 3.48% below WACC 4.72% indicates value destruction | Net margin 8.78% (neutral), ROIC 3.61% below WACC 5.94%, showing value shedding but improving ROIC trend |
| Innovation | Limited innovation indicators; declining ROIC trend suggests challenges in sustaining profitability | Improving ROIC trend (+86%) hints at growing operational efficiency despite current losses |
| Global presence | Primarily regional utility focus, limiting global exposure | Mainly US-focused utility operations, limited international presence |
| Market Share | Established regional utility with steady revenue growth in electricity segment | Strong position in electric utility sector, but higher debt and weaker liquidity |
Key takeaways: Both companies face profitability challenges, with ROIC below WACC indicating value destruction. Consolidated Edison maintains stronger net margin and diversification, while Edison International shows promising ROIC improvement but struggles with higher leverage and liquidity. Caution is advised, focusing on risk management when considering these utilities.
Risk Analysis
Below is a comparative overview of key risks facing Consolidated Edison, Inc. (ED) and Edison International (EIX) as of 2024.
| Metric | Consolidated Edison, Inc. (ED) | Edison International (EIX) |
|---|---|---|
| Market Risk | Low beta (0.38) indicates lower volatility | Moderate beta (0.83) shows higher sensitivity to market swings |
| Debt Level | Debt-to-equity: 1.27 (unfavorable), moderate leverage | Debt-to-equity: 2.43 (unfavorable), higher leverage risk |
| Regulatory Risk | High, due to regulated electric and gas services in NY | High, California regulations and wildfire liabilities pose risks |
| Operational Risk | Extensive infrastructure, aging assets could impact reliability | Large transmission network, wildfire mitigation increases complexity |
| Environmental Risk | Moderate, transitioning to renewables, regulatory pressure | Significant, wildfire-related liabilities and climate regulations |
| Geopolitical Risk | Low, primarily US operations in NY region | Low, primarily US operations in California |
The most impactful risks are regulatory and environmental, especially for Edison International, given California’s wildfire liabilities and stringent regulations. Both companies face financial leverage concerns, with EIX carrying higher debt, amplifying risk in volatile markets. Investors should weigh these risks carefully alongside stable dividend yields.
Which Stock to Choose?
Consolidated Edison, Inc. (ED) shows a mixed income evolution with favorable long-term revenue and net income growth but recent declines in EBIT and net margin. Its financial ratios are slightly unfavorable overall, with moderate profitability, neutral liquidity, and somewhat high debt, yet it holds a very favorable rating despite a very unfavorable moat due to value destruction.
Edison International (EIX) demonstrates favorable income trends with consistent growth across revenue, net income, and margins. Its financial ratios are generally unfavorable, reflecting weaker liquidity and higher leverage, but it benefits from a very favorable rating and a slightly unfavorable moat with improving profitability.
For investors prioritizing stability and favorable income growth, ED’s solid rating and consistent long-term profitability might appear suitable, while those focused on improving profitability despite financial challenges may find EIX’s growth trajectory and rating more appealing; risk-averse profiles could view ED more cautiously due to its value destruction, whereas risk-tolerant investors might consider EIX’s improving moat.
Disclaimer: Investment carries a risk of loss of initial capital. The past performance is not a reliable indicator of future results. Be sure to understand risks before making an investment decision.
Go Further
I encourage you to read the complete analyses of Consolidated Edison, Inc. and Edison International to enhance your investment decisions: