Consolidated Edison, Inc. (ED) and DTE Energy Company (DTE) are two major players in the regulated electric utility sector, serving millions of customers across New York and Michigan respectively. Both companies emphasize a balanced approach to traditional energy delivery and renewable infrastructure development, reflecting the industry’s innovation trends. This article will explore their financial strengths and strategic positioning to help you decide which company holds the most promise for your investment portfolio.
Table of contents
Companies Overview
I will begin the comparison between Consolidated Edison, Inc. and DTE Energy Company by providing an overview of these two companies and their main differences.
Consolidated Edison, Inc. Overview
Consolidated Edison, Inc. operates in the regulated electric, gas, and steam delivery sectors, serving approximately 3.5M electric and 1.1M gas customers mainly in New York City and Westchester County. It manages extensive transmission and distribution infrastructure and develops renewable energy projects. Founded in 1823, the company is a well-established utility provider with a $35.8B market cap and a low beta of 0.379, reflecting stable performance.
DTE Energy Company Overview
DTE Energy Company provides utility operations primarily in southeastern Michigan, supplying electricity to about 2.3M customers and natural gas to 1.3M customers. Its diverse energy generation includes fossil-fuel, nuclear, hydroelectric, and renewables. The company also offers industrial products and energy trading services. Founded in 1903, DTE has a $27B market cap and a beta of 0.484, indicating moderate volatility in its stock price.
Key similarities and differences
Both companies operate in the regulated electric utility industry with significant natural gas distribution networks and a focus on renewable energy projects. Consolidated Edison serves a larger customer base in a concentrated urban market, while DTE’s operations span a broader range of generation technologies and include industrial and trading segments. The differences in scale, market focus, and diversification highlight distinct strategic approaches within the utilities sector.
Income Statement Comparison
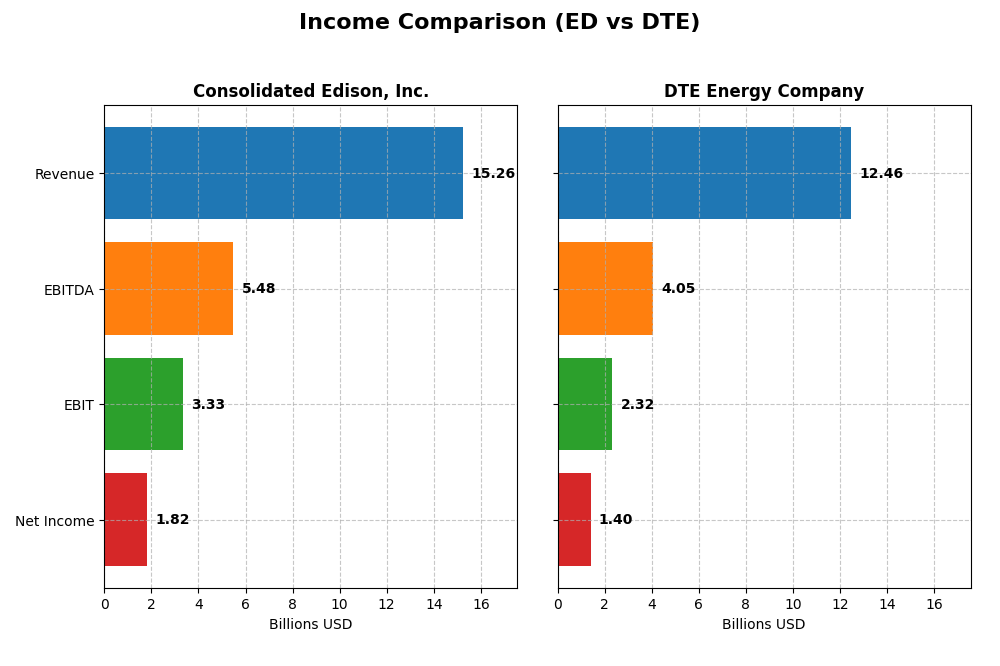
This table compares the key income statement metrics for Consolidated Edison, Inc. and DTE Energy Company for the fiscal year 2024, providing a snapshot of their financial performance.
| Metric | Consolidated Edison, Inc. (ED) | DTE Energy Company (DTE) |
|---|---|---|
| Market Cap | 35.8B | 27.0B |
| Revenue | 15.3B | 12.5B |
| EBITDA | 5.48B | 4.05B |
| EBIT | 3.33B | 2.32B |
| Net Income | 1.82B | 1.40B |
| EPS | 5.26 | 6.78 |
| Fiscal Year | 2024 | 2024 |
Income Statement Interpretations
Consolidated Edison, Inc.
Consolidated Edison showed overall revenue growth of 24.65% and net income growth of 65.3% from 2020 to 2024, reflecting a generally favorable trend. Gross and net margins remained strong, with gross margin at 64% and net margin near 12%. In 2024, revenue grew moderately by 4.16%, but net income and EBIT declined, signaling margin pressure despite stable operations.
DTE Energy Company
DTE Energy experienced more modest revenue growth of 9.05% over the period, with net income rising slightly by 2.41%. Gross margin was lower than Consolidated Edison’s at 35%, though EBIT and net margins remained favorable around 19% and 11%, respectively. However, 2024 saw a 2.26% revenue decline and a slight drop in EBIT, with neutral to unfavorable margin trends.
Which one has the stronger fundamentals?
Consolidated Edison’s income statement demonstrates stronger fundamentals with higher revenue and net income growth, superior margins, and a favorable overall income statement opinion. In contrast, DTE Energy’s growth is more muted, margins are thinner, and the income statement evaluation is unfavorable, reflecting challenges in sustaining profitability and growth momentum.
Financial Ratios Comparison
This table presents the latest available financial ratios for Consolidated Edison, Inc. and DTE Energy Company, allowing a straightforward comparison of key performance and financial health metrics for fiscal year 2024.
| Ratios | Consolidated Edison, Inc. (ED) | DTE Energy Company (DTE) |
|---|---|---|
| ROE | 8.29% | 12.00% |
| ROIC | 3.48% | 4.65% |
| P/E | 16.96 | 17.80 |
| P/B | 1.41 | 2.14 |
| Current Ratio | 1.04 | 0.71 |
| Quick Ratio | 0.96 | 0.46 |
| D/E (Debt-to-Equity) | 1.27 | 1.99 |
| Debt-to-Assets | 39.4% | 47.6% |
| Interest Coverage | 2.30 | 2.20 |
| Asset Turnover | 0.22 | 0.26 |
| Fixed Asset Turnover | 0.29 | 0.40 |
| Payout Ratio | 60.4% | 57.7% |
| Dividend Yield | 3.56% | 3.24% |
Interpretation of the Ratios
Consolidated Edison, Inc.
Consolidated Edison shows a mixed ratio profile with favorable net margin (11.93%) and dividend yield (3.56%), supported by a payout consistent with shareholder returns. However, weak return on equity (8.29%) and return on invested capital (3.48%) raise concerns about capital efficiency. Leverage metrics like debt-to-equity (1.27) and asset turnover ratios are unfavorable, indicating potential operational and financial risks.
DTE Energy Company
DTE Energy presents a slightly less favorable ratio set with a decent net margin of 11.27% but a neutral return on equity (12.0%) and unfavorable return on invested capital (4.65%). Liquidity ratios such as current (0.71) and quick (0.46) ratios are weak, suggesting short-term financial stress. The dividend yield of 3.24% is supported, but leverage remains high with a debt-to-equity ratio of 1.99, signaling cautious risk management.
Which one has the best ratios?
Both companies exhibit slightly unfavorable global ratio evaluations, with Consolidated Edison showing a better balance in favorable ratios (28.57%) compared to DTE Energy’s 21.43%. DTE’s liquidity and leverage ratios are notably weaker, while Consolidated Edison’s profitability and capital utilization face challenges. Overall, Consolidated Edison’s ratios appear marginally more balanced despite similar cautionary signals.
Strategic Positioning
This section compares the strategic positioning of Consolidated Edison, Inc. (ED) and DTE Energy Company (DTE) across market position, key segments, and exposure to technological disruption:
Consolidated Edison, Inc. (ED)
- Dominant in New York City and Westchester with regulated electric, gas, and steam delivery; faces typical utility sector competition.
- Diverse revenue streams from electricity, oil and gas purchases, steam, and non-utility products and services supporting stability.
- Operates traditional utility infrastructure; renewable and energy projects present but no explicit disruption focus stated.
DTE Energy Company (DTE)
- Leading southeastern Michigan utility with integrated electric, gas, and industrial operations; competitive in regional utility market.
- Broad segments including electric, gas, energy trading, industrial projects, and DTE Vantage innovation arm driving growth.
- Mix of fossil-fuel, nuclear, hydro, and renewables; energy trading and innovative projects indicate moderate exposure to disruption.
Consolidated Edison, Inc. vs DTE Energy Company Positioning
ED pursues a more diversified business model combining regulated utilities with non-utility services, offering revenue stability but less growth focus. DTE concentrates on regional utility operations complemented by energy trading and industrial projects, enabling operational focus with innovation elements.
Which has the best competitive advantage?
Both companies are shedding value as ROIC is below WACC, but DTE shows a growing ROIC trend, indicating improving profitability, while ED faces declining returns, suggesting a weaker competitive advantage currently.
Stock Comparison
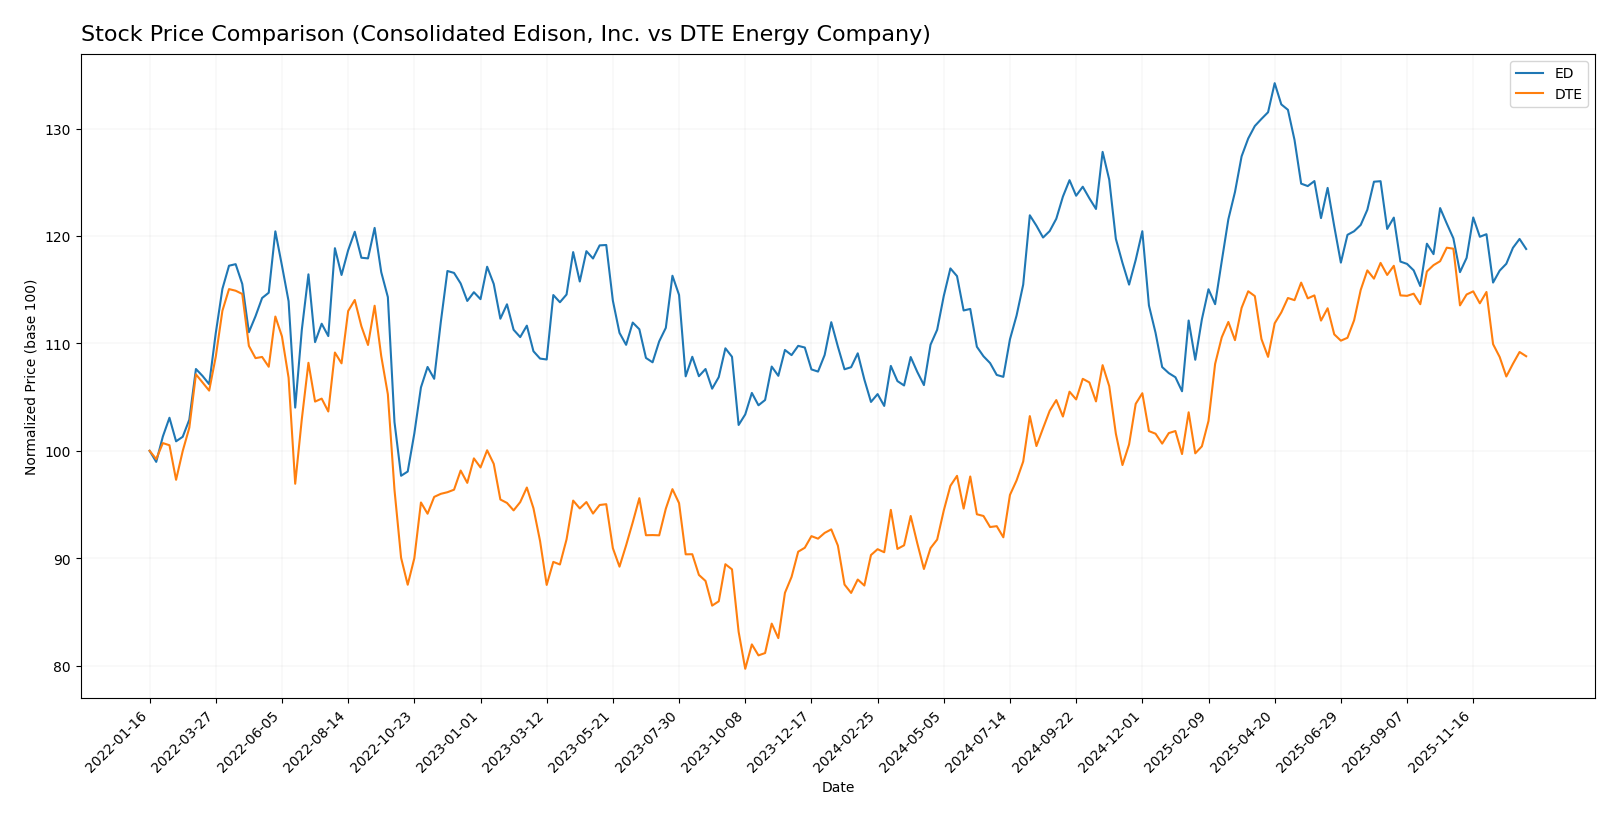
The stock price charts of Consolidated Edison, Inc. (ED) and DTE Energy Company (DTE) reveal significant bullish trends over the past 12 months, with notable deceleration in momentum and contrasting recent trading dynamics.
Trend Analysis
Consolidated Edison, Inc. experienced a 13.62% price increase over the past year, indicating a bullish trend with decelerating momentum. The stock fluctuated between a low of 87.01 and a high of 112.1, with moderate volatility (6.0% std deviation). Recent weeks show a slight negative slope (-0.04) and a minor decline (-0.83%).
DTE Energy Company posted a stronger 20.49% gain over the same period, also bullish but decelerating. Its price ranged from 106.25 to 141.95, with higher volatility (10.2% std deviation). However, recent performance shows a steeper decline of -8.42% and a sharper negative trend slope (-1.06).
Comparing the two, DTE delivered the highest market performance over the last year despite more pronounced recent weakness, while ED showed steadier recent trading with slight buyer dominance.
Target Prices
Analysts provide a confident target price consensus for these utility companies.
| Company | Target High | Target Low | Consensus |
|---|---|---|---|
| Consolidated Edison, Inc. | 106 | 86 | 99.86 |
| DTE Energy Company | 157 | 138 | 148.29 |
The target consensus for Consolidated Edison is very close to its current price of 99.21, indicating a stable outlook. DTE Energy’s consensus target of 148.29 suggests notable upside potential compared to its current price of 129.89.
Analyst Opinions Comparison
This section compares analysts’ ratings and grades for Consolidated Edison, Inc. (ED) and DTE Energy Company (DTE):
Rating Comparison
ED Rating
- Rating: B-, considered very favorable by analysts.
- Discounted Cash Flow Score: 1, indicating very unfavorable.
- ROE Score: 3, a moderate score showing decent profitability.
- ROA Score: 3, moderate efficiency in asset utilization.
- Debt To Equity Score: 2, moderate financial risk.
- Overall Score: 2, moderate overall financial standing.
DTE Rating
- Rating: C, also considered very favorable by analysts.
- Discounted Cash Flow Score: 1, indicating very unfavorable.
- ROE Score: 3, a moderate score indicating similar profitability.
- ROA Score: 2, moderate but lower efficiency than ED.
- Debt To Equity Score: 1, very unfavorable, higher financial risk.
- Overall Score: 2, moderate overall financial standing.
Which one is the best rated?
Both companies share the same moderate overall score and unfavorable discounted cash flow scores. However, ED has better debt-to-equity and return on assets scores, suggesting it is rated slightly better in financial stability and asset use.
Scores Comparison
Here is a comparison of the Altman Z-Score and Piotroski Score for both companies:
ED Scores
- Altman Z-Score: 1.19, indicating financial distress risk.
- Piotroski Score: 7, reflecting strong financial health.
DTE Scores
- Altman Z-Score: 1.03, also indicating financial distress risk.
- Piotroski Score: 7, reflecting strong financial health.
Which company has the best scores?
Both ED and DTE exhibit similar financial health based on their Piotroski Scores of 7, indicating strength. However, both are in the Altman Z-Score distress zone, with ED slightly higher than DTE, suggesting marginally lower bankruptcy risk for ED.
Grades Comparison
The following analysis compares the grading trends and ratings of Consolidated Edison, Inc. and DTE Energy Company:
Consolidated Edison, Inc. Grades
This table summarizes recent grades and actions from reputable grading companies for Consolidated Edison, Inc.:
| Grading Company | Action | New Grade | Date |
|---|---|---|---|
| UBS | Maintain | Neutral | 2026-01-07 |
| UBS | Maintain | Neutral | 2025-12-17 |
| Keybanc | Maintain | Underweight | 2025-12-12 |
| JP Morgan | Maintain | Underweight | 2025-12-12 |
| Barclays | Maintain | Underweight | 2025-11-10 |
| Barclays | Maintain | Underweight | 2025-10-22 |
| Morgan Stanley | Maintain | Underweight | 2025-10-22 |
| Barclays | Maintain | Underweight | 2025-10-21 |
| Keybanc | Maintain | Underweight | 2025-10-15 |
| Morgan Stanley | Maintain | Underweight | 2025-09-25 |
Overall, Consolidated Edison, Inc. exhibits a consistent pattern of underweight and neutral grades, indicating cautious sentiment among analysts.
DTE Energy Company Grades
This table presents recent grades and actions from recognized grading companies for DTE Energy Company:
| Grading Company | Action | New Grade | Date |
|---|---|---|---|
| BMO Capital | Maintain | Market Perform | 2025-12-24 |
| UBS | Maintain | Buy | 2025-12-17 |
| JP Morgan | Maintain | Neutral | 2025-12-11 |
| Jefferies | Upgrade | Buy | 2025-12-11 |
| B of A Securities | Maintain | Buy | 2025-11-05 |
| Scotiabank | Maintain | Sector Perform | 2025-10-31 |
| Morgan Stanley | Maintain | Overweight | 2025-10-22 |
| Barclays | Maintain | Equal Weight | 2025-10-14 |
| UBS | Maintain | Buy | 2025-10-10 |
| Scotiabank | Downgrade | Sector Perform | 2025-10-03 |
DTE Energy Company shows a predominance of buy and market perform ratings, with some upgrades, reflecting a generally positive analyst outlook.
Which company has the best grades?
DTE Energy Company has received stronger and more frequent buy and overweight ratings compared to Consolidated Edison, Inc., which mostly holds underweight or neutral grades. For investors, this suggests DTE might be viewed more favorably by analysts, potentially impacting portfolio decisions and risk assessments.
Strengths and Weaknesses
Below is a comparison table highlighting the key strengths and weaknesses of Consolidated Edison, Inc. (ED) and DTE Energy Company (DTE) based on the most recent financial and operational data.
| Criterion | Consolidated Edison, Inc. (ED) | DTE Energy Company (DTE) |
|---|---|---|
| Diversification | Moderate: Revenue mainly from Electricity (10.8B) with smaller segments in Oil & Gas and Steam | High: Diverse revenue streams including Electric (5.8B), Gas (1.7B), Energy Trading (4.6B), and DTE Vantage (0.8B) |
| Profitability | Mixed: Net margin favorable at 11.9%, but ROIC below WACC indicating value destruction | Moderate: Net margin favorable at 11.3%, ROIC below WACC but showing improving trend |
| Innovation | Limited: Non-utility products/services stable but no significant growth | Growing segment in DTE Vantage shows innovation focus and growth potential |
| Global presence | Limited: Primarily regional utility operations in New York area | Limited: Focused on Michigan and energy trading markets, no global footprint |
| Market Share | Strong local utility market share with steady electricity revenues | Strong in regional energy markets with significant presence in energy trading |
Key takeaways: Consolidated Edison shows stable core utility revenues but struggles with declining profitability and value destruction. DTE Energy displays more diversification and improving profitability trends, driven by innovative segments like DTE Vantage and energy trading. Both face challenges in expanding global presence.
Risk Analysis
Below is a comparative table highlighting key risk factors for Consolidated Edison, Inc. (ED) and DTE Energy Company (DTE) based on the most recent 2024 data:
| Metric | Consolidated Edison, Inc. (ED) | DTE Energy Company (DTE) |
|---|---|---|
| Market Risk | Low beta (0.38) reduces volatility risk | Slightly higher beta (0.48), moderate volatility risk |
| Debt Level | Moderate debt-to-equity (1.27), interest coverage neutral (2.8) | Higher debt-to-equity (1.99), interest coverage neutral (2.44) |
| Regulatory Risk | High, due to regulated electric/gas markets in NY and NJ | High, regulated utility operations in Michigan |
| Operational Risk | Extensive infrastructure with aging assets, moderate asset turnover | Large asset base with moderate asset turnover, operational complexity |
| Environmental Risk | Exposure to transition risks; increasing renewable investments | Fossil fuel and nuclear generation, transition risks present |
| Geopolitical Risk | Limited direct exposure, mostly US regional risk | Limited direct exposure, regional US focus |
The most impactful risks for both companies are regulatory pressures and debt levels, with DTE carrying higher leverage increasing financial risk. Both face operational challenges from aging infrastructure and environmental transition demands. Their low beta values suggest limited market volatility sensitivity, but their distressed Altman Z-Scores indicate caution.
Which Stock to Choose?
Consolidated Edison, Inc. (ED) shows favorable income evolution with 24.65% revenue growth and 65.3% net income growth over 2020-2024, but recent profitability indicators declined. Its financial ratios are slightly unfavorable with mixed metrics, moderate debt, and a very favorable B- rating. The company’s MOAT evaluation is very unfavorable due to declining ROIC and value destruction.
DTE Energy Company (DTE) has an unfavorable recent income statement trend, with slight revenue decline and neutral net income growth over the period. Its financial ratios are also slightly unfavorable, with higher leverage and weaker liquidity than ED, yet it holds a very favorable C rating. DTE’s MOAT is slightly unfavorable, showing value destruction but an improving ROIC trend.
Investors focused on growth and stable income might find ED’s favorable income growth and rating attractive despite its value destruction signals. Conversely, those prioritizing improving profitability and a slightly more cautious credit profile could see DTE’s growing ROIC and stable rating as positive. The choice could depend on the investor’s risk tolerance and preference for income versus improving operational efficiency.
Disclaimer: Investment carries a risk of loss of initial capital. The past performance is not a reliable indicator of future results. Be sure to understand risks before making an investment decision.
Go Further
I encourage you to read the complete analyses of Consolidated Edison, Inc. and DTE Energy Company to enhance your investment decisions: