Home > Comparison > Energy > COP vs TPL
The strategic rivalry between ConocoPhillips and Texas Pacific Land Corporation shapes the dynamics of the Energy sector’s oil and gas landscape. ConocoPhillips operates as a capital-intensive explorer and producer of hydrocarbons worldwide, while Texas Pacific Land focuses on land and resource management with significant royalty interests. This analysis explores their contrasting business models to identify which offers superior risk-adjusted returns for a diversified portfolio amid evolving energy market conditions.
Table of contents
Companies Overview
ConocoPhillips and Texas Pacific Land Corporation both hold critical roles in the US energy sector, shaping oil and gas markets with distinct business models.
ConocoPhillips: Global Energy Producer
ConocoPhillips is a major integrated oil and gas explorer and producer. It generates revenue by extracting and marketing crude oil, natural gas, LNG, and liquids worldwide. In 2026, its strategic focus remains on balancing conventional and unconventional assets across North America, Europe, and Asia, while advancing LNG developments and oil sands operations.
Texas Pacific Land Corporation: Land and Resource Manager
Texas Pacific Land Corporation specializes in land and resource management with significant royalty interests. It earns from managing 880K acres, leasing land for oil, gas, and infrastructure, and providing water services in the Permian Basin. The company’s 2026 strategy emphasizes expanding water solutions and maximizing royalties on nonparticipating interests.
Strategic Collision: Similarities & Divergences
ConocoPhillips operates as a vertically integrated producer with a focus on resource extraction, while Texas Pacific Land leverages land ownership and royalties, avoiding direct production risks. Both compete indirectly in the Permian Basin, but their revenue drivers differ fundamentally. Investors face contrasting profiles: ConocoPhillips offers exposure to commodity cycles; Texas Pacific Land provides stable cash flows from land and royalties.
Income Statement Comparison
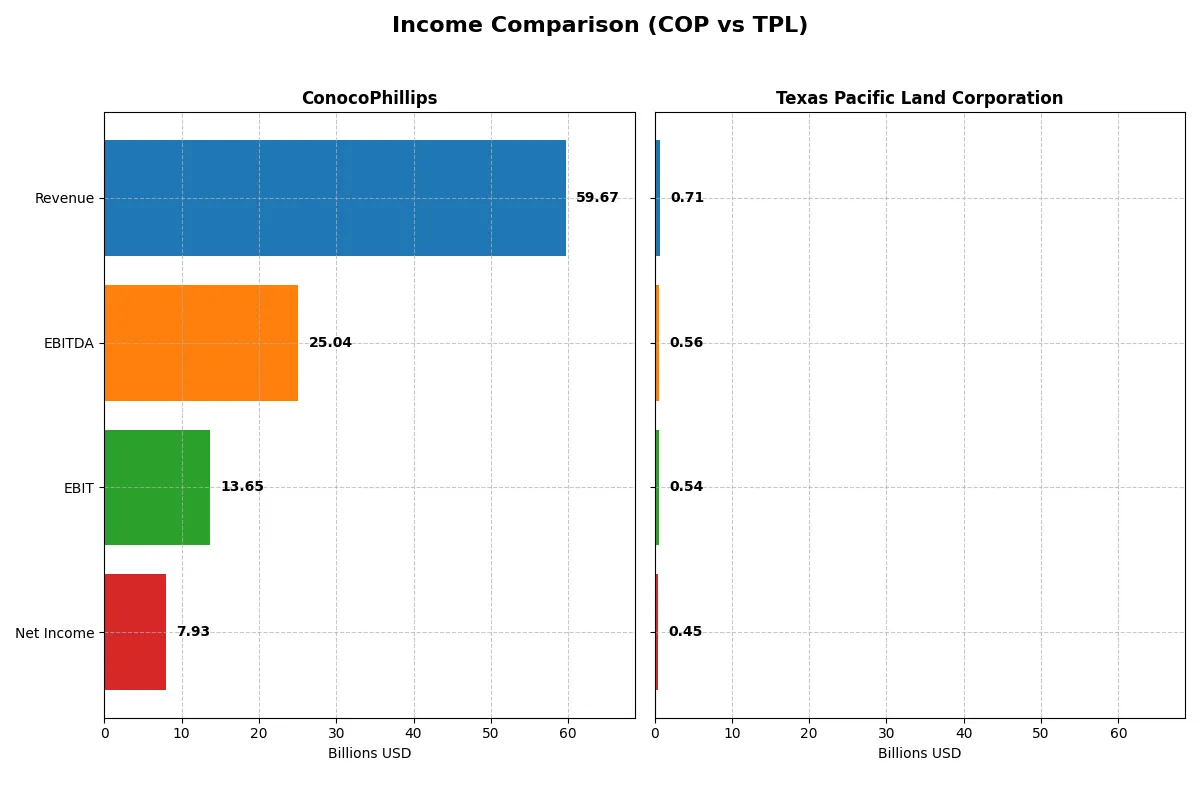
This data dissects the core profitability and scalability of both corporate engines to reveal who dominates the bottom line:
| Metric | ConocoPhillips (COP) | Texas Pacific Land Corporation (TPL) |
|---|---|---|
| Revenue | 59.7B | 706M |
| Cost of Revenue | 38.7B | 71M |
| Operating Expenses | 9.13B | 95M |
| Gross Profit | 20.98B | 635M |
| EBITDA | 25.04B | 564M |
| EBIT | 13.65B | 539M |
| Interest Expense | 1.14B | 0 |
| Net Income | 7.93B | 454M |
| EPS | 6.34 | 19.75 |
| Fiscal Year | 2025 | 2024 |
Income Statement Analysis: The Bottom-Line Duel
This income statement comparison exposes each company’s core operating efficiency and profitability dynamics over recent fiscal years.
ConocoPhillips Analysis
ConocoPhillips’ revenue climbed steadily to $59.7B in 2025, yet net income declined to $7.9B, reflecting margin pressure. The 2025 gross margin of 35.15% remains favorable, but net margin slipped to 13.29%, signaling rising costs. Despite a 9.3% revenue increase last year, earnings and EPS contracted, indicating margin erosion and operational challenges.
Texas Pacific Land Corporation Analysis
Texas Pacific Land posted consistent revenue growth, reaching $706M in 2024, with net income rising to $454M. Margins impressively dominate, with a gross margin near 90% and net margin above 64%. The company’s EBIT margin of 76% underscores exceptional operational efficiency. Its revenue and net income expanded by roughly 12% last year, sustaining robust momentum and margin stability.
Margin Mastery vs. Scale Challenge
Texas Pacific Land outperforms ConocoPhillips with superior margin profiles and stronger net income growth. While ConocoPhillips benefits from scale and solid revenue gains, its profitability ratios weaken under cost pressures. Investors prioritizing consistent margin dominance and earnings growth will find Texas Pacific Land’s profile more compelling than ConocoPhillips’ scale-driven but margin-compressed trajectory.
Financial Ratios Comparison
These vital ratios act as a diagnostic tool to expose underlying fiscal health, valuation premiums, and capital efficiency for a clearer investment perspective:
| Ratios | ConocoPhillips (COP) | Texas Pacific Land Corp (TPL) |
|---|---|---|
| ROE | 12.3% | 40.1% |
| ROIC | 6.9% | 35.6% |
| P/E | 14.1 | 18.7 |
| P/B | 1.74 | 7.49 |
| Current Ratio | 1.30 | 8.33 |
| Quick Ratio | 1.14 | 8.33 |
| D/E | 0.36 | 0.0004 |
| Debt-to-Assets | 19.2% | 0.04% |
| Interest Coverage | 10.4 | N/A |
| Asset Turnover | 0.49 | 0.57 |
| Fixed Asset Turnover | 0.64 | 1.27 |
| Payout ratio | 50.4% | 76.5% |
| Dividend yield | 3.57% | 4.09% |
| Fiscal Year | 2025 | 2024 |
Efficiency & Valuation Duel: The Vital Signs
Financial ratios act as a company’s DNA, exposing hidden risks and operational strengths that shape investment decisions.
ConocoPhillips
ConocoPhillips shows moderate profitability with a 12.3% ROE and 13.29% net margin, indicating steady earnings efficiency. The stock trades at a favorable 14.13 P/E, reflecting reasonable valuation. Shareholders benefit from a solid 3.57% dividend yield, signaling consistent returns instead of heavy reinvestment in R&D.
Texas Pacific Land Corporation
Texas Pacific Land delivers robust profitability with a 40.09% ROE and a striking 64.32% net margin, highlighting exceptional operational efficiency. Valuation appears stretched at an 18.69 P/E and a high 7.49 P/B ratio. The company rewards investors with a 4.09% dividend yield, maintaining capital return despite a conservative debt profile.
Premium Valuation vs. Operational Safety
Both companies share a favorable overall ratio profile, but Texas Pacific Land commands superior profitability at a premium price. ConocoPhillips offers a more balanced valuation with steady returns and manageable risk. Investors seeking stability may prefer ConocoPhillips, while those targeting high efficiency might lean toward Texas Pacific Land.
Which one offers the Superior Shareholder Reward?
I compare ConocoPhillips (COP) and Texas Pacific Land Corporation (TPL) on dividends, payout ratios, and buybacks. COP yields 3.6% in 2025, with a 50% payout ratio, well-covered by free cash flow. TPL yields 4.1%, but with a higher 77% payout ratio, risking sustainability. COP pairs dividends with moderate buybacks, balancing reward and reinvestment. TPL’s buyback activity is minimal, leaning on dividends alone. Historically, COP’s distribution mix supports long-term value better. I favor COP for a superior total return profile in 2026, blending yield, buybacks, and capital discipline.
Comparative Score Analysis: The Strategic Profile
The radar chart reveals the fundamental DNA and trade-offs of ConocoPhillips and Texas Pacific Land Corporation, highlighting their financial strengths and weaknesses:
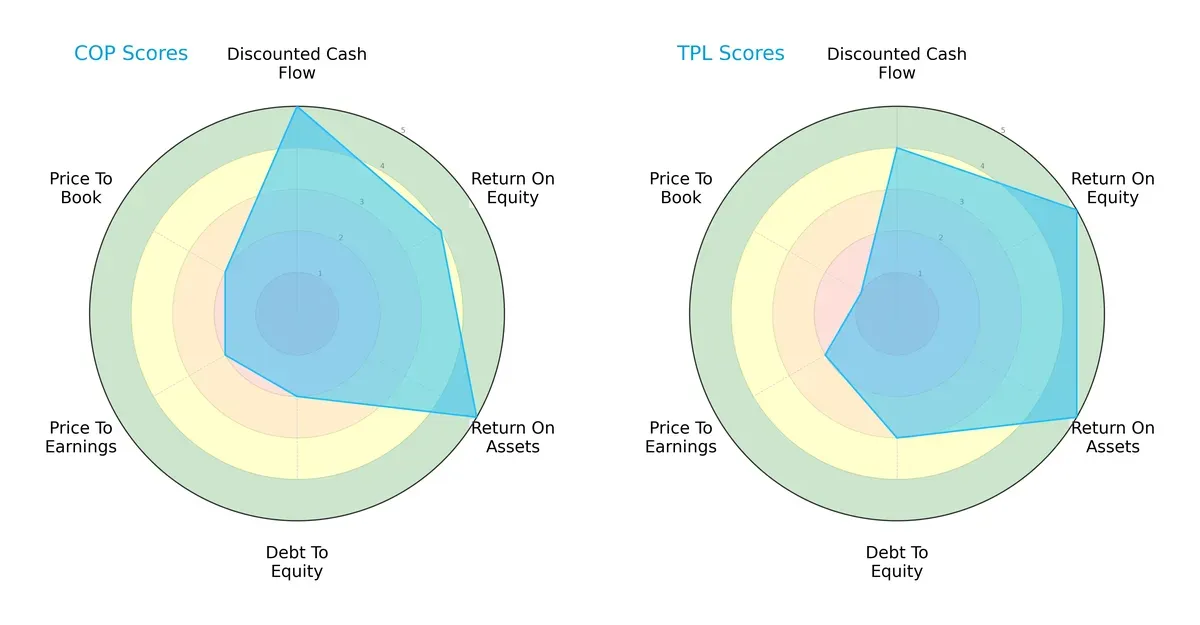
ConocoPhillips excels in discounted cash flow and asset efficiency with top scores (5 each), but it carries higher financial risk given a weak debt-to-equity score (2). Texas Pacific Land shows superior equity returns (5) and a more moderate leverage profile (3), yet it suffers from very unfavorable price-to-book valuation (1). Overall, ConocoPhillips presents a more balanced profile, while Texas Pacific Land leans on its ROE strength but faces valuation challenges.
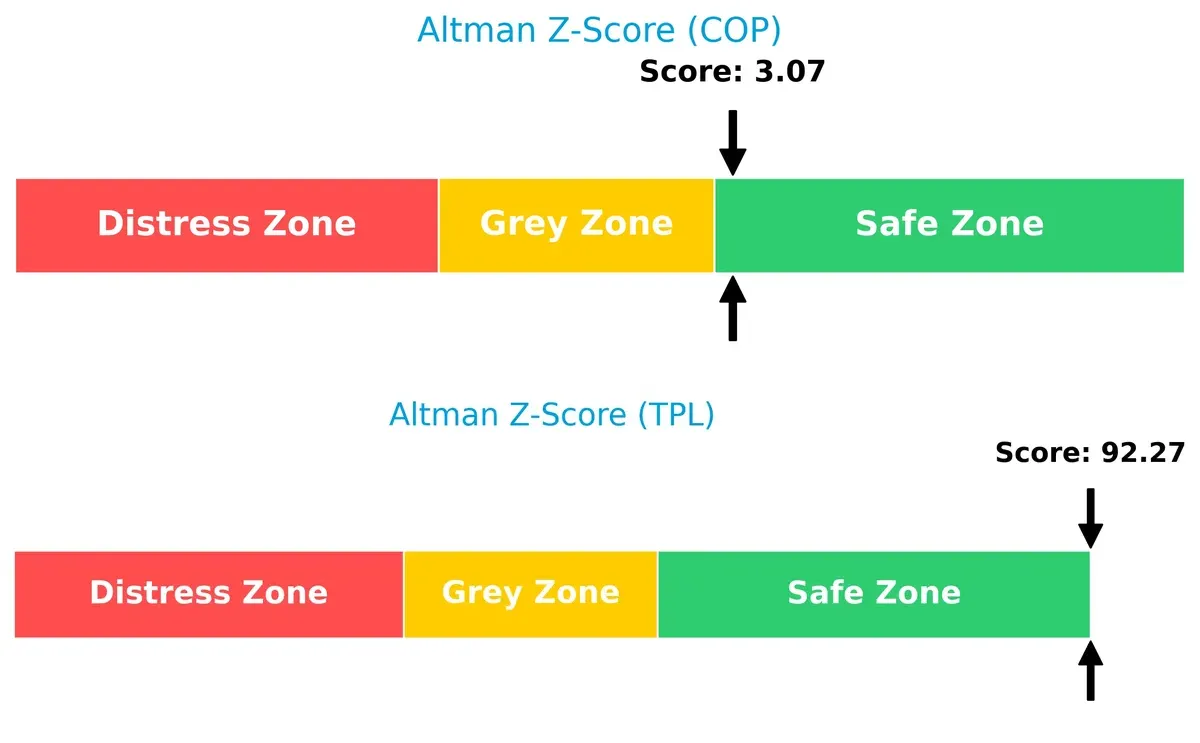
Bankruptcy Risk: Solvency Showdown
The Altman Z-Score delta indicates both firms reside in the safe zone, but Texas Pacific Land’s exceptionally high score (92.3) far surpasses ConocoPhillips’ moderate safety margin (3.07), implying markedly stronger long-term solvency for TPL:
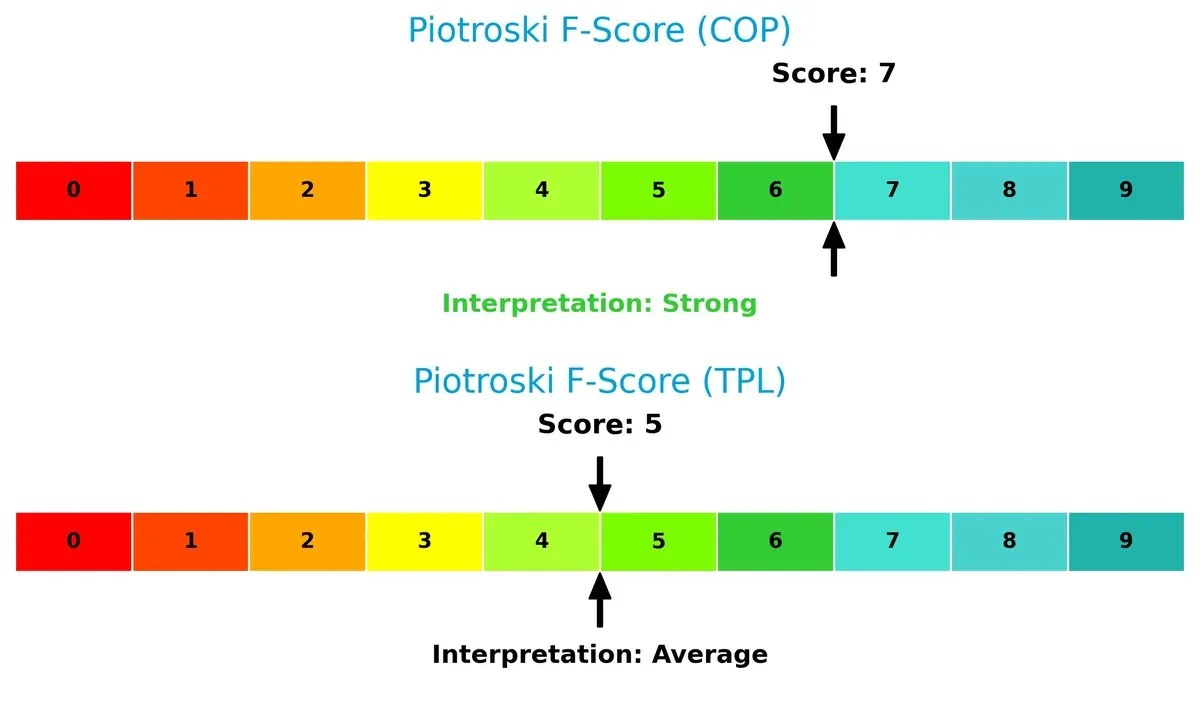
Financial Health: Quality of Operations
ConocoPhillips’ Piotroski F-Score of 7 signals robust financial health, outperforming Texas Pacific Land’s average score of 5. This suggests COP maintains higher operational quality and fewer internal red flags:
How are the two companies positioned?
This section dissects the operational DNA of COP and TPL by comparing their revenue distribution and internal dynamics—strengths and weaknesses. The goal is to confront their economic moats and identify which business model offers the most resilient, sustainable competitive advantage today.
Revenue Segmentation: The Strategic Mix
The following visual comparison dissects how ConocoPhillips and Texas Pacific Land Corporation diversify their income streams and where their primary sector bets lie:
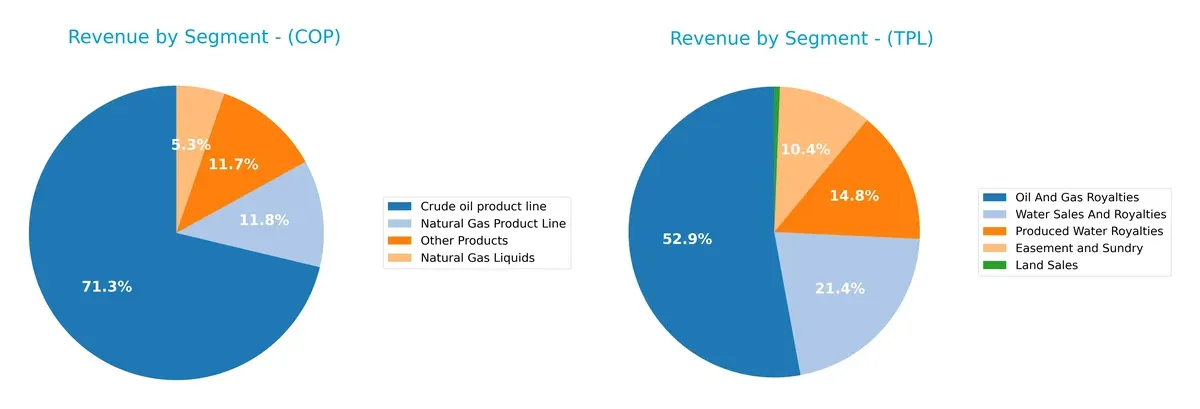
ConocoPhillips anchors revenue in crude oil at $39B, with meaningful contributions from natural gas ($6.4B) and other products ($6.4B), showing a moderately diversified energy mix. Texas Pacific Land relies heavily on oil and gas royalties at $373M, overshadowing smaller streams like easements ($73M) and water royalties ($151M). COP’s broad energy exposure mitigates commodity price swings, while TPL’s focused royalty model hinges on sustained land and resource control, posing concentration risk but benefiting from infrastructure dominance.
Strengths and Weaknesses Comparison
This table compares the Strengths and Weaknesses of ConocoPhillips and Texas Pacific Land Corporation:
ConocoPhillips Strengths
- Diversified products including crude oil, natural gas, and other lines
- Favorable net margin at 13.29%
- Low debt-to-assets ratio at 19.23%
- Favorable interest coverage ratio at 11.99
- Global presence across North America, Europe, and Asia
- Consistent dividend yield of 3.57%
Texas Pacific Land Corporation Strengths
- Extremely high net margin at 64.32%
- Exceptional ROE at 40.09% and ROIC at 35.6%
- Zero debt with favorable debt-to-assets ratio near zero
- Strong dividend yield at 4.09%
- Favorable quick ratio at 8.33
- Stable income from royalties and land sales
ConocoPhillips Weaknesses
- Unfavorable asset and fixed asset turnover ratios limit efficiency
- Moderate ROE and ROIC, indicating average capital returns
- Neutral current ratio at 1.3 suggests limited liquidity buffer
- Higher exposure to commodity price volatility
- Market share dependent on energy sector cycles
Texas Pacific Land Corporation Weaknesses
- Unfavorable high price-to-book ratio at 7.49
- Unfavorable current ratio at 8.33 may indicate excess current assets
- Neutral WACC at 8.14% suggests cost of capital pressure
- Concentrated revenue streams focused on land and royalties
- Limited geographic diversification
ConocoPhillips shows strength in diversification and global footprint but faces efficiency challenges. Texas Pacific Land Corporation excels in profitability and financial health yet has valuation and diversification limitations. Each company’s strategy must balance these strengths and weaknesses within their market context.
The Moat Duel: Analyzing Competitive Defensibility
A structural moat is the only true shield protecting long-term profits from relentless competition erosion. Let’s dissect the competitive moats of:
ConocoPhillips: Operational Efficiency in Energy Extraction
I identify ConocoPhillips’ moat in its cost advantage and diverse global operations. Its moderate ROIC above WACC signals value creation despite declining profitability. Expansion in unconventional energy could deepen this moat but faces commodity price risks.
Texas Pacific Land Corporation: Land Ownership and Royalty Rights
Texas Pacific Land’s moat stems from its unique land and perpetual royalty interests in the Permian Basin. Its ROIC far exceeds WACC with an upward trend, reflecting strong capital efficiency and margin dominance. Growth in water services further strengthens its position versus ConocoPhillips.
Capital Efficiency vs. Asset Control: The Moat Showdown
Texas Pacific Land commands a wider, deeper moat, driven by irreplaceable land assets and rising ROIC. ConocoPhillips creates value but faces margin pressure and cyclical risks. TPL is better equipped to defend market share through sustainable royalty income and expanding services.
Which stock offers better returns?
The past year shows contrasting price dynamics between ConocoPhillips and Texas Pacific Land Corporation, with notable divergences in trend direction and acceleration phases.
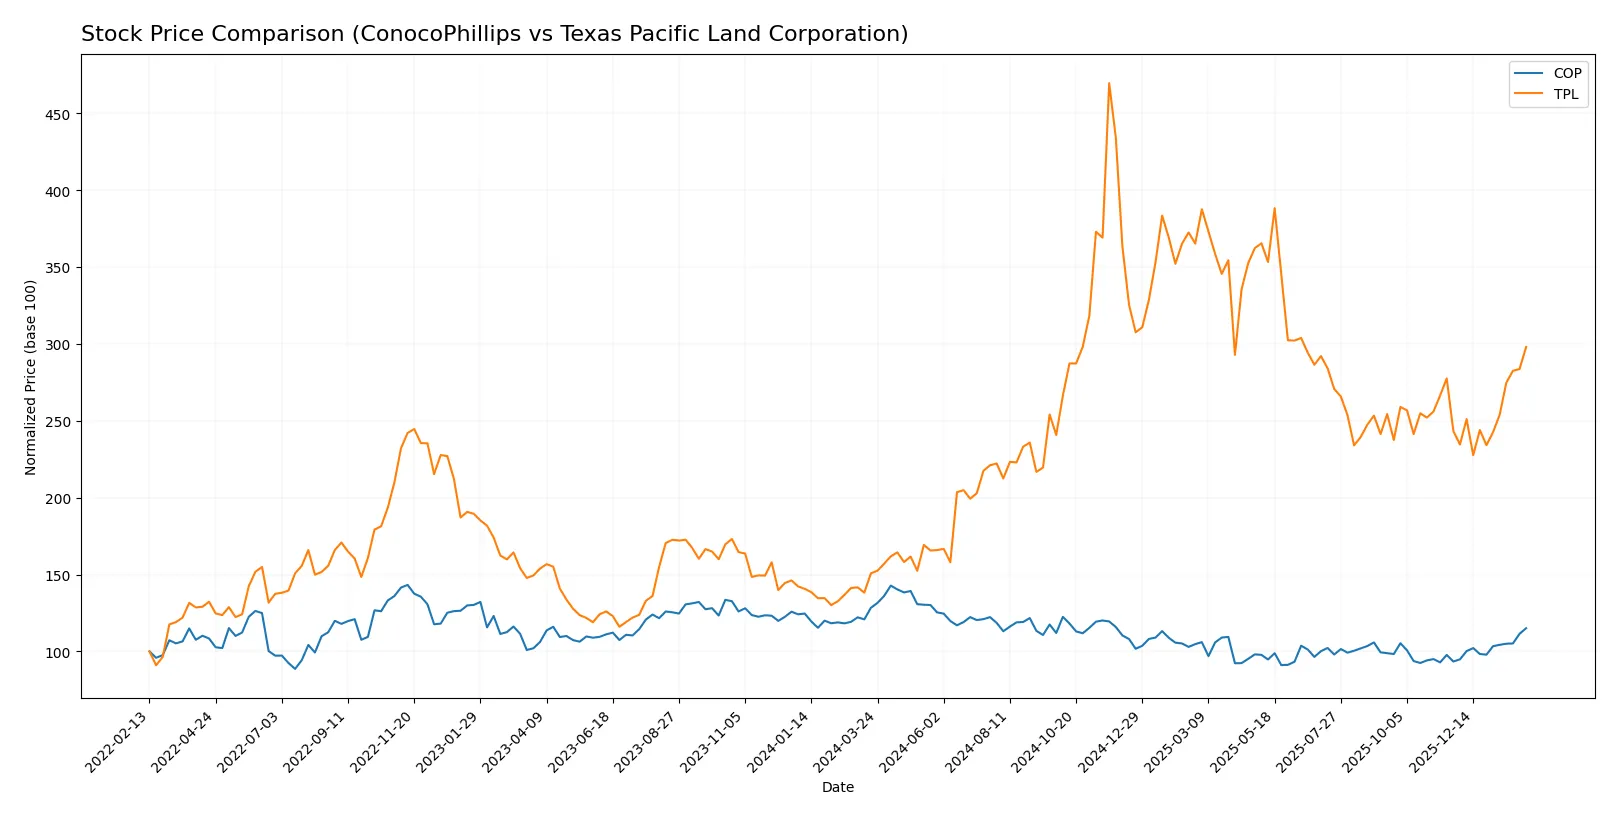
Trend Comparison
ConocoPhillips exhibits a bearish trend over the past 12 months with a -10.35% price change. The decline accelerates despite a recent 23.18% rebound. Volatility remains moderate, with a standard deviation of 11.69.
Texas Pacific Land Corporation posts a strong bullish trend, gaining 97.67% over the year. The acceleration intensifies, supported by a recent 22.5% rise amid high volatility and an 86.33 standard deviation.
Comparing both, Texas Pacific Land Corporation outperforms ConocoPhillips significantly, delivering superior market returns and more pronounced upward momentum.
Target Prices
Analysts present a clear target consensus for ConocoPhillips and Texas Pacific Land Corporation.
| Company | Target Low | Target High | Consensus |
|---|---|---|---|
| ConocoPhillips | 98 | 133 | 116.07 |
| Texas Pacific Land Corporation | 1050 | 1050 | 1050 |
ConocoPhillips’ consensus target of 116.07 suggests upside from the current 107.62 stock price. Texas Pacific Land’s target at 1050 significantly exceeds its current 366.03 price, indicating strong bullish sentiment.

Don’t Let Luck Decide Your Entry Point
Optimize your entry points with our advanced ProRealTime indicators. You’ll get efficient buy signals with precise price targets for maximum performance. Start outperforming now!
How do institutions grade them?
Here is a summary of recent institutional grades for ConocoPhillips and Texas Pacific Land Corporation:
ConocoPhillips Grades
The table below lists recent grades assigned by recognized grading companies to ConocoPhillips:
| Grading Company | Action | New Grade | Date |
|---|---|---|---|
| Wells Fargo | Maintain | Overweight | 2026-02-06 |
| BMO Capital | Maintain | Outperform | 2026-02-06 |
| Piper Sandler | Maintain | Overweight | 2026-02-06 |
| Susquehanna | Maintain | Positive | 2026-01-26 |
| Morgan Stanley | Maintain | Overweight | 2026-01-23 |
| JP Morgan | Downgrade | Neutral | 2026-01-20 |
| B of A Securities | Downgrade | Underperform | 2026-01-16 |
| JP Morgan | Maintain | Overweight | 2026-01-13 |
| Wells Fargo | Upgrade | Overweight | 2026-01-12 |
| Piper Sandler | Maintain | Overweight | 2026-01-08 |
Texas Pacific Land Corporation Grades
The table below shows recent grades assigned by recognized grading companies to Texas Pacific Land Corporation:
| Grading Company | Action | New Grade | Date |
|---|---|---|---|
| BWS Financial | Maintain | Buy | 2024-08-12 |
| BWS Financial | Maintain | Buy | 2024-05-10 |
| BWS Financial | Maintain | Buy | 2024-04-02 |
| Stifel | Maintain | Hold | 2024-01-23 |
| Stifel | Maintain | Hold | 2023-11-30 |
| Stifel | Maintain | Hold | 2023-05-22 |
| Stifel | Maintain | Hold | 2023-05-21 |
| Stifel | Maintain | Hold | 2023-04-27 |
| Stifel | Maintain | Hold | 2023-04-26 |
| Stifel | Maintain | Hold | 2023-04-12 |
Which company has the best grades?
ConocoPhillips holds generally stronger grades with multiple Overweight and Outperform ratings from major firms. Texas Pacific Land maintains steady Buy and Hold ratings but lacks recent upgrades. Investors may see ConocoPhillips as favored by institutions despite some recent downgrades.
Risks specific to each company
The following categories identify the critical pressure points and systemic threats facing both firms in the 2026 market environment:
1. Market & Competition
ConocoPhillips
- Faces intense competition in global oil and gas markets with volatile commodity prices affecting margins.
Texas Pacific Land Corporation
- Relies heavily on land royalties and water services in the Permian Basin, limiting diversification and exposure to regional competition.
2. Capital Structure & Debt
ConocoPhillips
- Maintains moderate debt (D/E 0.36) with strong interest coverage of 12x, indicating prudent leverage management.
Texas Pacific Land Corporation
- Virtually no debt, offering a very strong balance sheet and minimal financial risk.
3. Stock Volatility
ConocoPhillips
- Low beta (0.29) suggests stock is less sensitive to market swings, providing defensive qualities.
Texas Pacific Land Corporation
- Higher beta (0.93) indicates more volatility and sensitivity to market fluctuations.
4. Regulatory & Legal
ConocoPhillips
- Exposed to stringent environmental regulations and evolving energy policies worldwide.
Texas Pacific Land Corporation
- Faces regulatory risks primarily related to land use and water resource management in Texas.
5. Supply Chain & Operations
ConocoPhillips
- Complex global operations with risks from geopolitical issues and supply disruptions.
Texas Pacific Land Corporation
- Operations concentrated in one region, limiting operational complexity but increasing regional risk.
6. ESG & Climate Transition
ConocoPhillips
- Transition risks as oil and gas face pressure from decarbonization trends globally.
Texas Pacific Land Corporation
- ESG risk mitigated by land and water focus, but still exposed to climate impact on resource availability.
7. Geopolitical Exposure
ConocoPhillips
- Broad international footprint exposes it to geopolitical instability in multiple regions.
Texas Pacific Land Corporation
- Concentrated in Texas with minimal direct geopolitical risks outside U.S. domestic policies.
Which company shows a better risk-adjusted profile?
ConocoPhillips’ biggest risk is geopolitical and regulatory exposure across diverse operations. Texas Pacific Land’s primary risk is regional concentration and market dependency on Permian Basin royalties. Despite higher volatility, Texas Pacific’s pristine balance sheet and strong Altman Z-score suggest a better risk-adjusted profile. The recent surge in Texas Pacific’s stock price (+5.99%) highlights investor confidence but also reflects sensitivity to regional market dynamics.
Final Verdict: Which stock to choose?
ConocoPhillips (COP) shines as a powerful cash generator with a solid economic moat built on value creation despite a recent decline in profitability. Its disciplined capital allocation and steady dividend appeal to investors seeking exposure to energy with a moderate risk tolerance. The key point of vigilance is its declining ROIC trend amid an evolving energy landscape. COP fits well in an Income & Value portfolio aiming for resilience with growth potential.
Texas Pacific Land Corporation (TPL) boasts a formidable strategic moat driven by its unique land ownership and recurring royalty streams, delivering exceptional returns on capital with a rising profitability trajectory. Its pristine balance sheet and strong free cash flow underpin a safer profile compared to COP’s cyclicality. TPL suits Growth at a Reasonable Price (GARP) investors who prioritize durable competitive advantages and scalable earnings without overleveraging.
If you prioritize steady cash flow and dividend income with moderate growth, ConocoPhillips presents a compelling scenario due to its robust free cash flow and value discipline. However, if you seek superior growth backed by a rare economic moat and stronger balance sheet stability, Texas Pacific Land offers better stability and enhanced returns, though at a higher valuation premium. Both stocks warrant attention but cater to distinct investor archetypes.
Disclaimer: Investment carries a risk of loss of initial capital. The past performance is not a reliable indicator of future results. Be sure to understand risks before making an investment decision.
Go Further
I encourage you to read the complete analyses of ConocoPhillips and Texas Pacific Land Corporation to enhance your investment decisions: