Home > Comparison > Energy > COP vs OXY
The intense rivalry between ConocoPhillips and Occidental Petroleum shapes the energy sector’s competitive landscape. ConocoPhillips operates as a diversified oil and gas explorer with a broad global footprint. Occidental Petroleum blends upstream oil production with integrated chemical and midstream operations. This analysis evaluates their divergent strategies to identify which offers superior risk-adjusted returns, essential for investors seeking resilience and growth in the volatile energy market.
Table of contents
Companies Overview
ConocoPhillips and Occidental Petroleum Corporation stand as pivotal players in global oil and gas exploration and production.
ConocoPhillips: Global Oil & Gas Explorer
ConocoPhillips dominates as a global explorer and producer of crude oil, natural gas, and LNG. Its revenue primarily stems from conventional and unconventional production across North America, Europe, Asia, and Australia. In 2026, it strategically focuses on optimizing its diverse portfolio, including shale, oil sands, and LNG developments, to maintain resilient cash flow amid market volatility.
Occidental Petroleum Corporation: Integrated Energy Producer
Occidental Petroleum operates as a diversified energy company with segments in oil and gas, chemicals, and midstream marketing. It generates revenue from upstream exploration and production alongside chemical manufacturing and asset-based midstream operations. The 2026 strategy emphasizes integrated asset optimization and leveraging its chemical segment to smooth cyclical energy sector fluctuations.
Strategic Collision: Similarities & Divergences
Both companies prioritize upstream oil and gas production but diverge on business models. ConocoPhillips pursues a pure-play exploration focus, while Occidental integrates chemicals and midstream to diversify revenue streams. Their primary battleground is North American resource development. Investors face distinct profiles: ConocoPhillips offers focused energy exposure; Occidental provides a multi-segment hedge with broader operational complexity.
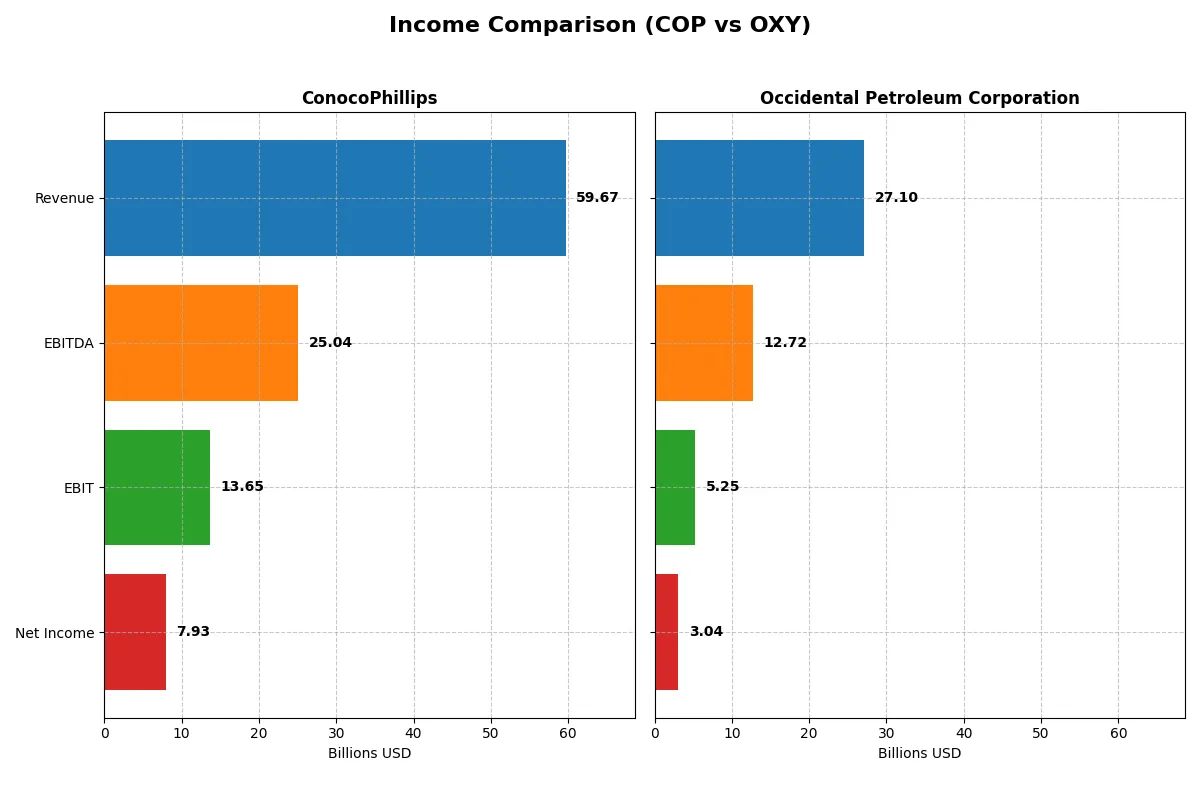
Income Statement Comparison
This data dissects the core profitability and scalability of both corporate engines to reveal who dominates the bottom line:
| Metric | ConocoPhillips (COP) | Occidental Petroleum Corporation (OXY) |
|---|---|---|
| Revenue | 59.7B | 27.1B |
| Cost of Revenue | 38.7B | 17.5B |
| Operating Expenses | 9.13B | 3.68B |
| Gross Profit | 20.9B | 9.65B |
| EBITDA | 25.0B | 12.7B |
| EBIT | 13.7B | 5.25B |
| Interest Expense | 1.14B | 1.18B |
| Net Income | 7.93B | 3.04B |
| EPS | 6.34 | 2.59 |
| Fiscal Year | 2025 | 2024 |
Income Statement Analysis: The Bottom-Line Duel
This income statement comparison reveals the true efficiency and profitability drivers behind ConocoPhillips and Occidental Petroleum’s operations.
ConocoPhillips Analysis
ConocoPhillips’ revenue grew steadily to $59.7B in 2025, but net income declined to $7.9B, reflecting margin pressure. Gross margin remains strong at 35.15%, yet net margin slipped to 13.29%. Despite a 9.3% revenue increase in 2025, EBIT and EPS declined, signaling recent operational challenges and margin compression.
Occidental Petroleum Corporation Analysis
Occidental’s revenue contracted slightly to $27.1B in 2024, with net income dropping sharply to $3.0B. Gross margin at 35.6% stays healthy, but net margin fell to 11.2%. The company faced a 4.3% revenue decline and a 31.9% net margin drop, indicating reduced profitability momentum despite solid longer-term growth trends.
Margin Resilience vs. Growth Volatility
ConocoPhillips leads in scale and margin stability, while Occidental shows stronger long-term growth but recent volatility. ConocoPhillips’ higher absolute profits and better margin control make it the fundamental winner. Investors prioritizing consistent profitability may find ConocoPhillips’ profile more attractive amid sector headwinds.
Financial Ratios Comparison
These vital ratios act as a diagnostic tool to expose the underlying fiscal health, valuation premiums, and capital efficiency of the companies compared below:
| Ratios | ConocoPhillips (COP) | Occidental Petroleum Corporation (OXY) |
|---|---|---|
| ROE | 12.3% | 8.9% |
| ROIC | 6.9% | 5.5% |
| P/E | 14.1 | 14.8 |
| P/B | 1.74 | 1.32 |
| Current Ratio | 1.30 | 0.95 |
| Quick Ratio | 1.14 | 0.73 |
| D/E (Debt-to-Equity) | 0.36 | 0.79 |
| Debt-to-Assets | 19.2% | 31.7% |
| Interest Coverage | 10.4 | 5.1 |
| Asset Turnover | 0.49 | 0.32 |
| Fixed Asset Turnover | 0.64 | 0.39 |
| Payout Ratio | 50.4% | 47.5% |
| Dividend Yield | 3.57% | 3.21% |
| Fiscal Year | 2025 | 2024 |
Efficiency & Valuation Duel: The Vital Signs
Ratios serve as a company’s DNA, exposing hidden risks and operational strengths essential for sound investment decisions.
ConocoPhillips
ConocoPhillips demonstrates solid profitability with a 12.3% ROE and a favorable 13.29% net margin. Its P/E ratio of 14.13 signals a reasonable valuation. The firm sustains shareholder value with a 3.57% dividend yield, reflecting a balanced approach between payouts and reinvestment for steady growth.
Occidental Petroleum Corporation
Occidental posts a weaker 8.91% ROE and an 11.23% net margin but maintains a fair P/E of 14.81. The stock appears stretched given its high debt and lower liquidity ratios. Occidental returns 3.21% in dividends but faces operational efficiency challenges, signaling cautious scrutiny for risk-averse investors.
Balanced Strength vs. Stretched Leverage
ConocoPhillips offers a better risk-reward balance through stronger profitability and healthier liquidity. Occidental’s higher leverage and weaker returns create operational strain. Investors prioritizing stability and steady income should lean toward ConocoPhillips, while those tolerating risk may consider Occidental’s growth potential.
Which one offers the Superior Shareholder Reward?
I see ConocoPhillips (COP) offers a higher dividend yield around 3.57% versus Occidental Petroleum’s (OXY) 3.21% in 2025. COP’s payout ratio hovers near 50%, well covered by free cash flow at about 85%. OXY’s payout ratio is similar but free cash flow coverage is weaker, near 39%. Both run buyback programs, but COP’s capital expenditure to free cash flow ratio suggests more sustainable returns. OXY’s higher leverage and lower liquidity present risks. I conclude COP delivers a more attractive, sustainable total shareholder return profile in 2026.
Comparative Score Analysis: The Strategic Profile
The radar chart reveals the fundamental DNA and trade-offs of ConocoPhillips and Occidental Petroleum Corporation:
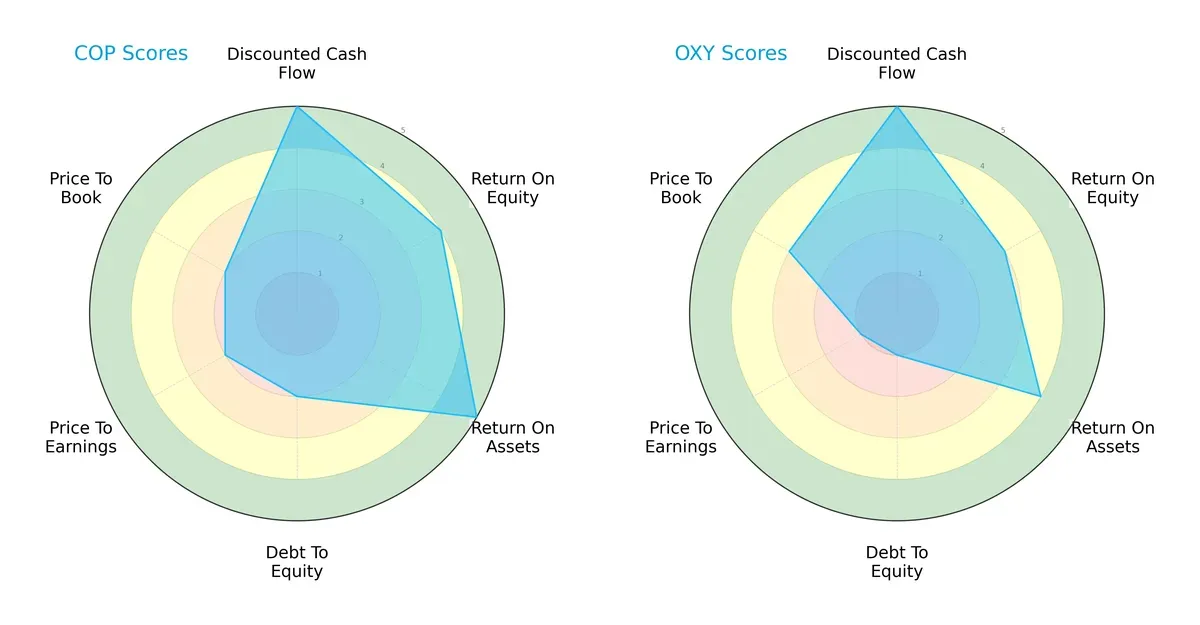
ConocoPhillips shows a more balanced profile with very favorable DCF and ROA scores and a solid ROE. However, its debt and valuation metrics lag. Occidental Petroleum relies heavily on its strong DCF score but struggles with debt and valuation more severely. ConocoPhillips offers steadier operational efficiency, while Occidental depends on a narrower set of strengths.
Bankruptcy Risk: Solvency Showdown
The Altman Z-Score gap highlights a critical divergence in long-term survival prospects in this cycle:
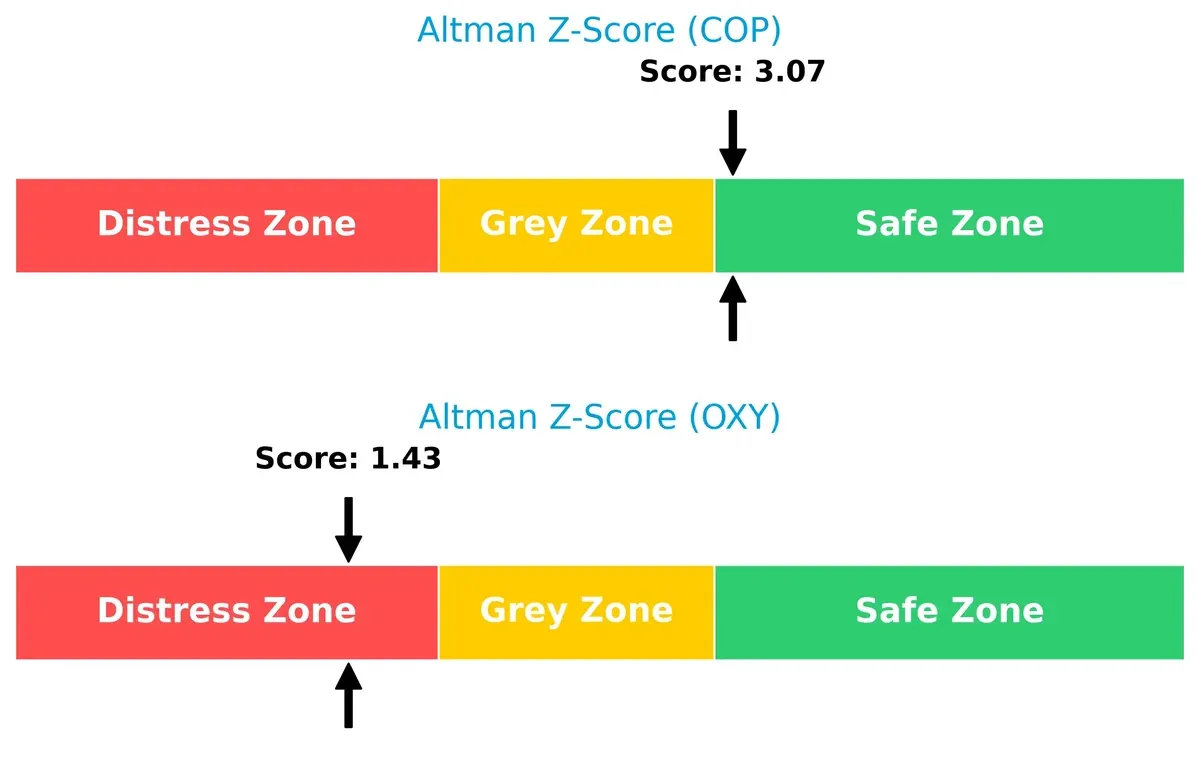
ConocoPhillips sits comfortably in the safe zone with a 3.07 score, signaling strong financial stability. Occidental Petroleum’s 1.43 places it in the distress zone, raising alarms about potential bankruptcy risk under economic stress.
Financial Health: Quality of Operations
Piotroski F-Scores reveal which company demonstrates stronger internal financial health and operational quality:
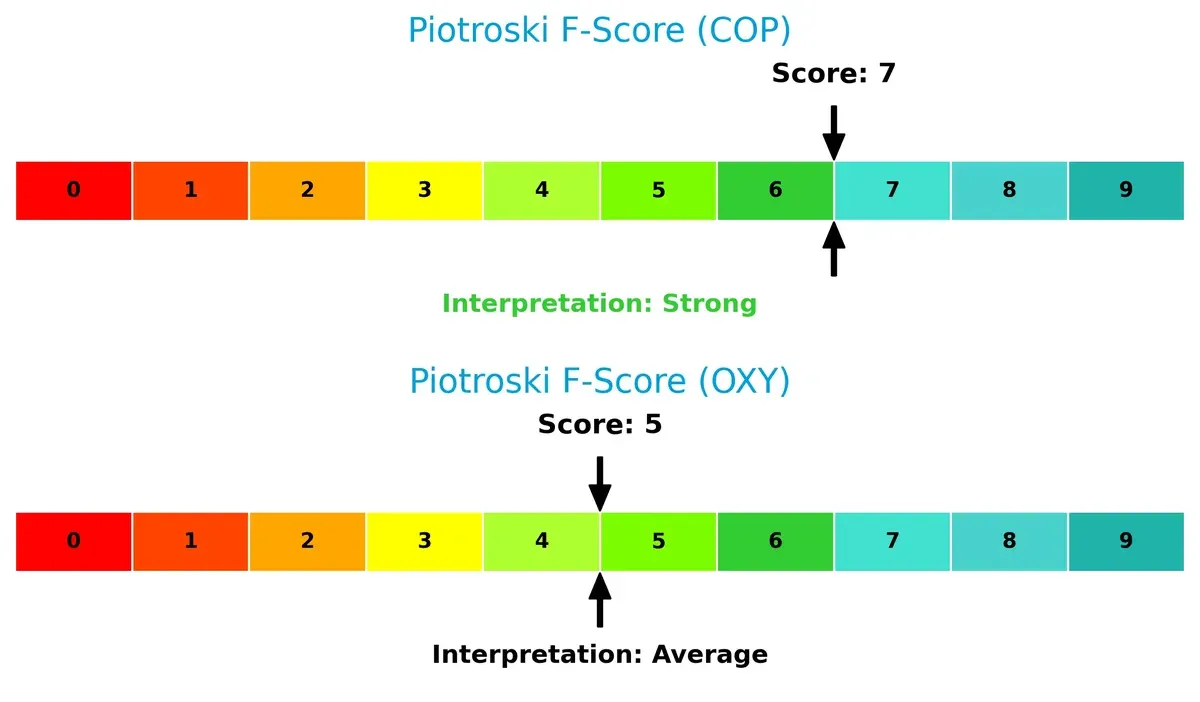
ConocoPhillips scores a robust 7, indicating strong financial health and operational efficiency. Occidental Petroleum’s 5 signals average strength with some red flags in internal metrics. This underlines ConocoPhillips’ superior quality of earnings and balance sheet discipline.
How are the two companies positioned?
This section dissects the operational DNA of COP and OXY by comparing their revenue distribution and internal dynamics. The goal is to confront their economic moats to identify which model offers the most resilient, sustainable competitive advantage today.
Revenue Segmentation: The Strategic Mix
This visual comparison dissects how ConocoPhillips and Occidental Petroleum diversify their income streams and where their primary sector bets lie:
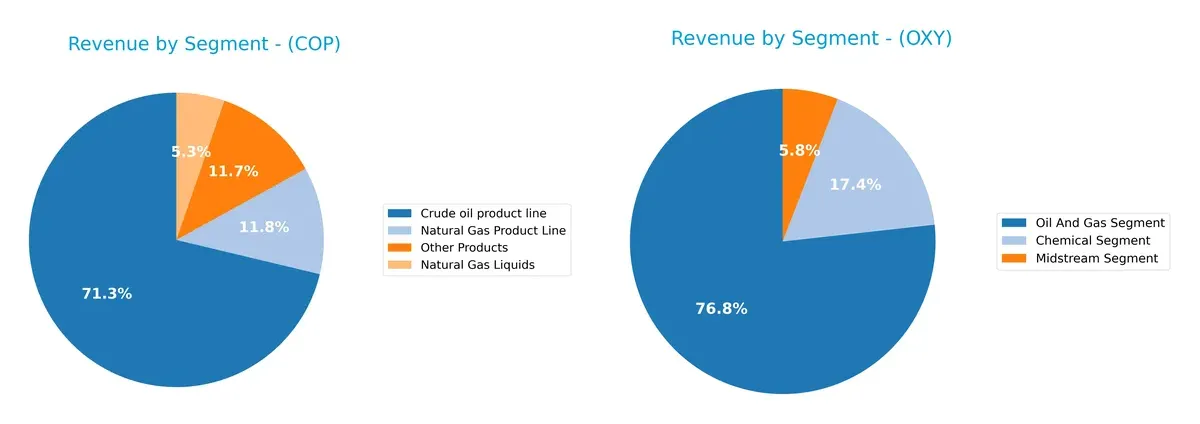
ConocoPhillips anchors revenue in its Crude Oil Product Line at $39B, with solid contributions from Natural Gas and Other Products, reflecting a moderately diversified portfolio. Occidental Petroleum relies heavily on its Oil and Gas Segment at $21.7B, dwarfing its Chemical ($4.9B) and Midstream ($1.7B) segments. COP’s mix reduces concentration risk, while OXY’s dominance in oil and gas suggests strong infrastructure focus but higher exposure to commodity cycles.
Strengths and Weaknesses Comparison
This table compares the strengths and weaknesses of ConocoPhillips and Occidental Petroleum Corporation:
ConocoPhillips Strengths
- Diverse product lines including crude oil, natural gas, and liquids
- Favorable net margin at 13.29%
- Low debt-to-assets at 19.23%
- Strong interest coverage ratio of 11.99
- Favorable quick ratio at 1.14
- Dividend yield of 3.57%
Occidental Petroleum Strengths
- Diverse segments including chemicals, midstream, and oil & gas
- Favorable net margin of 11.23%
- Favorable P/B ratio at 1.32
- Favorable dividend yield at 3.21%
- WACC slightly lower than COP at 4.73%
- Positive P/E ratio of 14.81
ConocoPhillips Weaknesses
- Unfavorable asset turnover at 0.49
- Unfavorable fixed asset turnover at 0.64
- Neutral ROE at 12.3%
- Neutral current ratio at 1.3
- Limited geographic data compared to OXY
Occidental Petroleum Weaknesses
- Unfavorable ROE at 8.91%
- Unfavorable current ratio at 0.95 and quick ratio at 0.73
- Higher debt-to-equity at 0.79
- Unfavorable asset turnover at 0.32 and fixed asset turnover at 0.39
- Interest coverage only neutral at 4.46
ConocoPhillips shows financial strength through profitability and balance sheet metrics but faces efficiency challenges. Occidental displays segment diversification yet struggles with leverage and liquidity ratios. Both companies’ profiles suggest distinct strategic focuses and risk exposures.
The Moat Duel: Analyzing Competitive Defensibility
A structural moat is the only reliable barrier protecting long-term profits from relentless competition erosion. Here’s how ConocoPhillips and Occidental Petroleum stack up:
ConocoPhillips: Diverse Asset Base with Operational Efficiency
ConocoPhillips relies on a broad geographic footprint and operational scale as its moat. This shows in its stable 13% net margin and ROIC exceeding WACC by 2%, though ROIC trends down. New LNG and unconventional plays could either deepen or pressure this advantage in 2026.
Occidental Petroleum Corporation: Growth-Driven Emerging Moat
Occidental’s moat centers on improving capital efficiency, reflected by rapidly growing ROIC despite it currently trailing WACC. Unlike ConocoPhillips’ scale, OXY’s strength lies in margin expansion and diversification into chemicals and midstream. Its upward ROIC trend signals potential for a stronger moat ahead.
Scale and Efficiency vs. Growth Momentum
ConocoPhillips holds a wider moat via consistent value creation and diversified assets, but its declining ROIC warns of margin pressure. Occidental’s moat is narrower but deepening fast, driven by operational improvements and expanding segments. ConocoPhillips remains better positioned today to defend market share, though OXY’s trajectory demands close watch.
Which stock offers better returns?
The past year reveals contrasting stock movements: both ConocoPhillips and Occidental Petroleum face overall declines, yet recent months show accelerating recoveries with distinct buyer dynamics.
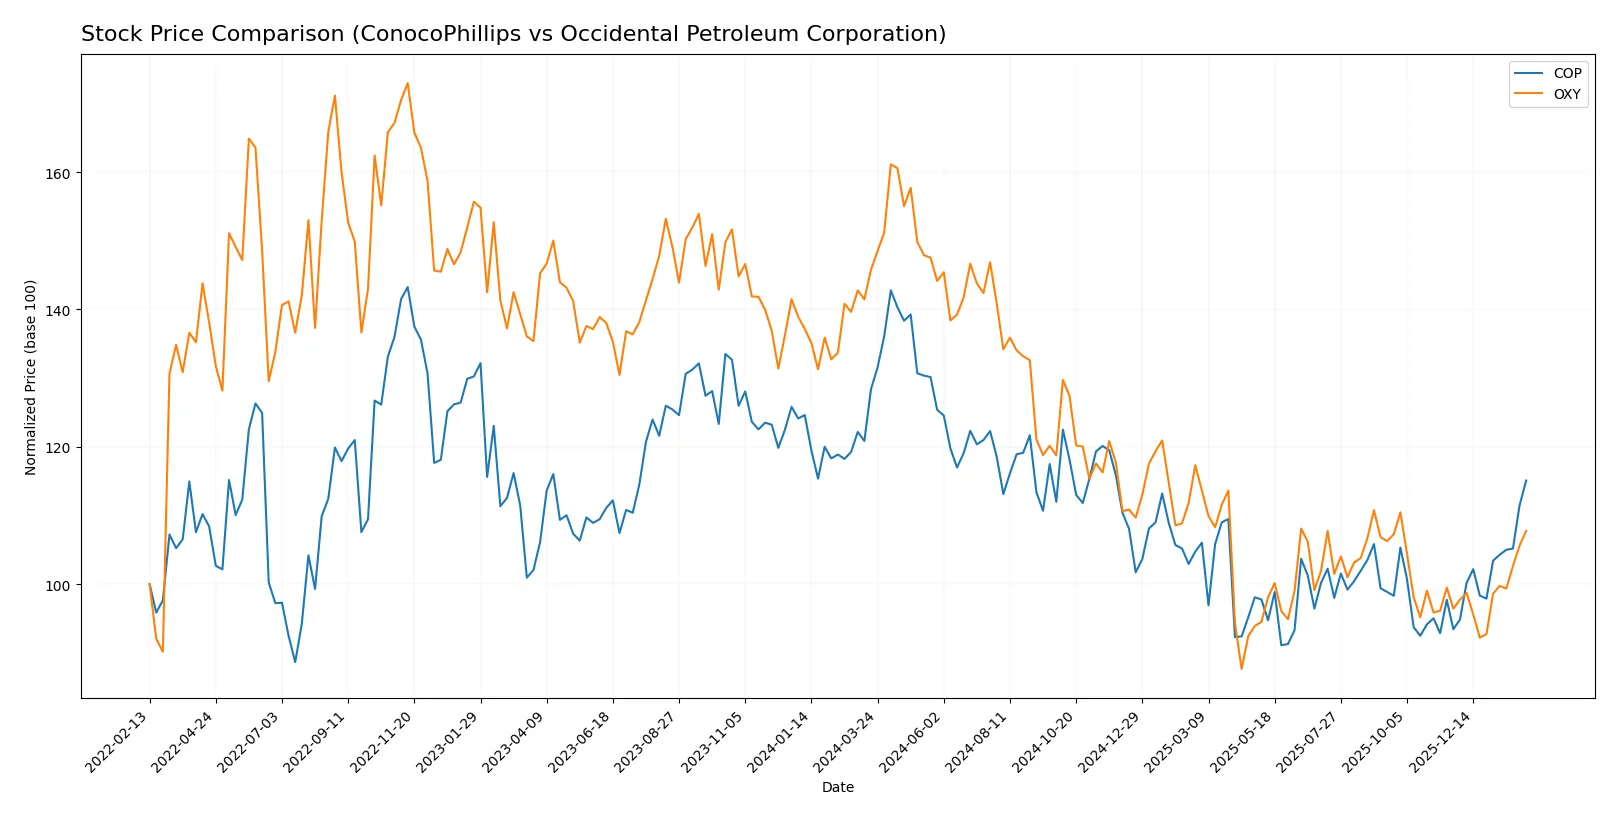
Trend Comparison
ConocoPhillips’ stock declined 10.35% over 12 months, marking a bearish trend with accelerating losses. It hit a high of 133.52 and a low of 85.19, showing significant volatility (std dev 11.69). Recent weeks reversed with a 23.18% gain.
Occidental Petroleum’s stock fell 26.08% in the same period, also bearish with accelerating decline. It ranged between 69.25 and 37.67, exhibiting moderate volatility (std dev 8.14). Its recent 11.75% rise shows a slower recovery slope.
Comparing both, ConocoPhillips outperformed with a smaller yearly loss and stronger recent rebound, delivering the highest market performance among the two.
Target Prices
Analysts present a mixed but generally optimistic outlook for ConocoPhillips and Occidental Petroleum Corporation.
| Company | Target Low | Target High | Consensus |
|---|---|---|---|
| ConocoPhillips | 98 | 133 | 116.07 |
| Occidental Petroleum Corp. | 38 | 64 | 48.91 |
ConocoPhillips’ consensus target at $116.07 suggests moderate upside from its $107.62 price. Occidental’s $48.91 target aligns closely with its current $46.31 price, indicating limited near-term gains.

Don’t Let Luck Decide Your Entry Point
Optimize your entry points with our advanced ProRealTime indicators. You’ll get efficient buy signals with precise price targets for maximum performance. Start outperforming now!
How do institutions grade them?
The following tables summarize recent institutional grades for ConocoPhillips and Occidental Petroleum Corporation:
ConocoPhillips Grades
Here are the latest institutional grades assigned to ConocoPhillips:
| Grading Company | Action | New Grade | Date |
|---|---|---|---|
| Wells Fargo | Maintain | Overweight | 2026-02-06 |
| BMO Capital | Maintain | Outperform | 2026-02-06 |
| Piper Sandler | Maintain | Overweight | 2026-02-06 |
| Susquehanna | Maintain | Positive | 2026-01-26 |
| Morgan Stanley | Maintain | Overweight | 2026-01-23 |
| JP Morgan | Downgrade | Neutral | 2026-01-20 |
| B of A Securities | Downgrade | Underperform | 2026-01-16 |
| JP Morgan | Maintain | Overweight | 2026-01-13 |
| Wells Fargo | Upgrade | Overweight | 2026-01-12 |
| Piper Sandler | Maintain | Overweight | 2026-01-08 |
Occidental Petroleum Corporation Grades
Here are the latest institutional grades assigned to Occidental Petroleum Corporation:
| Grading Company | Action | New Grade | Date |
|---|---|---|---|
| Piper Sandler | Maintain | Neutral | 2026-01-28 |
| Susquehanna | Maintain | Positive | 2026-01-26 |
| Morgan Stanley | Maintain | Overweight | 2026-01-23 |
| UBS | Maintain | Neutral | 2025-12-12 |
| B of A Securities | Maintain | Neutral | 2025-12-11 |
| JP Morgan | Downgrade | Underweight | 2025-12-08 |
| Citigroup | Maintain | Neutral | 2025-11-19 |
| Piper Sandler | Maintain | Neutral | 2025-11-18 |
| Susquehanna | Maintain | Positive | 2025-11-13 |
| Wells Fargo | Maintain | Underweight | 2025-11-12 |
Which company has the best grades?
ConocoPhillips generally receives stronger grades, with multiple Overweight and Outperform ratings. Occidental Petroleum shows more Neutral and Underweight ratings. This divergence may influence investor sentiment and portfolio positioning.
Risks specific to each company
The following categories identify the critical pressure points and systemic threats facing both firms in the 2026 market environment:
1. Market & Competition
ConocoPhillips
- Operates globally with diversified assets, benefiting from scale and portfolio breadth.
Occidental Petroleum Corporation
- Faces competitive pressures in multiple regions, with more concentrated geographic exposure and segmental complexity.
2. Capital Structure & Debt
ConocoPhillips
- Maintains a conservative debt-to-equity ratio (0.36), supporting financial stability.
Occidental Petroleum Corporation
- Higher leverage (0.79 D/E) raises financial risk, limiting flexibility in downturns.
3. Stock Volatility
ConocoPhillips
- Low beta (0.29) indicates lower stock volatility versus market benchmarks.
Occidental Petroleum Corporation
- Slightly higher beta (0.37) suggests more price sensitivity to market swings.
4. Regulatory & Legal
ConocoPhillips
- Faces regulatory scrutiny typical of global oil producers; diversified jurisdictions mitigate concentration risk.
Occidental Petroleum Corporation
- Additional chemical and midstream segments expose it to distinct regulatory frameworks, adding complexity.
5. Supply Chain & Operations
ConocoPhillips
- Broad asset base in conventional and unconventional resources supports operational resilience.
Occidental Petroleum Corporation
- Operations span oil, gas, chemicals, and midstream, increasing supply chain complexity and operational risk.
6. ESG & Climate Transition
ConocoPhillips
- Progresses on ESG initiatives with moderate capital allocation to low-carbon solutions.
Occidental Petroleum Corporation
- Faces greater ESG scrutiny due to chemical operations and carbon-intensive oil production footprint.
7. Geopolitical Exposure
ConocoPhillips
- Global footprint includes stable and emerging markets, balancing geopolitical risks.
Occidental Petroleum Corporation
- Significant exposure to Middle East, Africa, and Latin America introduces heightened geopolitical uncertainty.
Which company shows a better risk-adjusted profile?
ConocoPhillips’ strongest risk is operational asset turnover weakness, but its conservative leverage and low stock volatility improve resilience. Occidental’s most critical risk is its high leverage paired with complex operations, increasing financial and operational vulnerability. ConocoPhillips demonstrates a superior risk-adjusted profile, supported by a robust Altman Z-Score (3.07, safe zone) versus Occidental’s distress-zone score (1.43). This gap highlights ConocoPhillips’ stronger financial stability in a volatile energy market.
Final Verdict: Which stock to choose?
ConocoPhillips (COP) stands out as a robust cash generator with a strong value creation track record, delivering returns above its cost of capital. Its slight decline in profitability signals a need for vigilance. COP fits well in portfolios seeking steady income with moderate growth ambitions.
Occidental Petroleum Corporation (OXY) offers an emerging moat backed by a rising ROIC trend, signaling improving efficiency. Its heavier debt load and weaker liquidity present risks compared to COP, but its growth trajectory suits investors favoring a turnaround story with growth at a reasonable price.
If you prioritize consistent value creation and a safer financial profile, ConocoPhillips outshines due to its proven ability to generate free cash flow and maintain solid returns. However, if you seek growth potential amid improving fundamentals and can tolerate higher leverage, Occidental Petroleum offers a compelling scenario for a growth-focused investor.
Disclaimer: Investment carries a risk of loss of initial capital. The past performance is not a reliable indicator of future results. Be sure to understand risks before making an investment decision.
Go Further
I encourage you to read the complete analyses of ConocoPhillips and Occidental Petroleum Corporation to enhance your investment decisions: