Home > Comparison > Energy > COP vs EQT
The strategic rivalry between ConocoPhillips and EQT Corporation shapes the future of the Energy sector’s Oil & Gas Exploration & Production industry. ConocoPhillips operates as a diversified, global oil and gas giant with a broad asset base spanning conventional and unconventional resources. In contrast, EQT focuses on natural gas production with a concentrated footprint in U.S. shale plays. This analysis evaluates which model delivers superior risk-adjusted returns for a diversified portfolio.
Table of contents
Companies Overview
ConocoPhillips and EQT Corporation anchor the U.S. energy sector with distinct operational footprints and market strategies.
ConocoPhillips: Global Oil & Gas Producer
ConocoPhillips dominates oil & gas exploration and production globally. It generates revenue by extracting and marketing crude oil, natural gas, LNG, and liquids from diverse reserves in North America, Europe, and Asia. In 2026, it focuses heavily on optimizing unconventional and conventional assets to enhance long-term value and operational efficiency.
EQT Corporation: Leading U.S. Natural Gas Producer
EQT Corporation specializes in natural gas production across the United States. Its revenue stems mainly from developing and selling natural gas and NGLs from vast reserves, especially in the Marcellus shale. The company prioritizes expanding its resource base and improving capital discipline to strengthen its position in the domestic gas market.
Strategic Collision: Similarities & Divergences
Both companies pursue upstream energy production but diverge in scope and commodity focus. ConocoPhillips operates a global, diversified portfolio emphasizing multiple hydrocarbons, while EQT concentrates on U.S. natural gas with a narrower resource base. Their primary battleground is market share in energy supply, but ConocoPhillips offers broader commodity exposure, contrasting EQT’s specialization and leaner footprint.
Income Statement Comparison
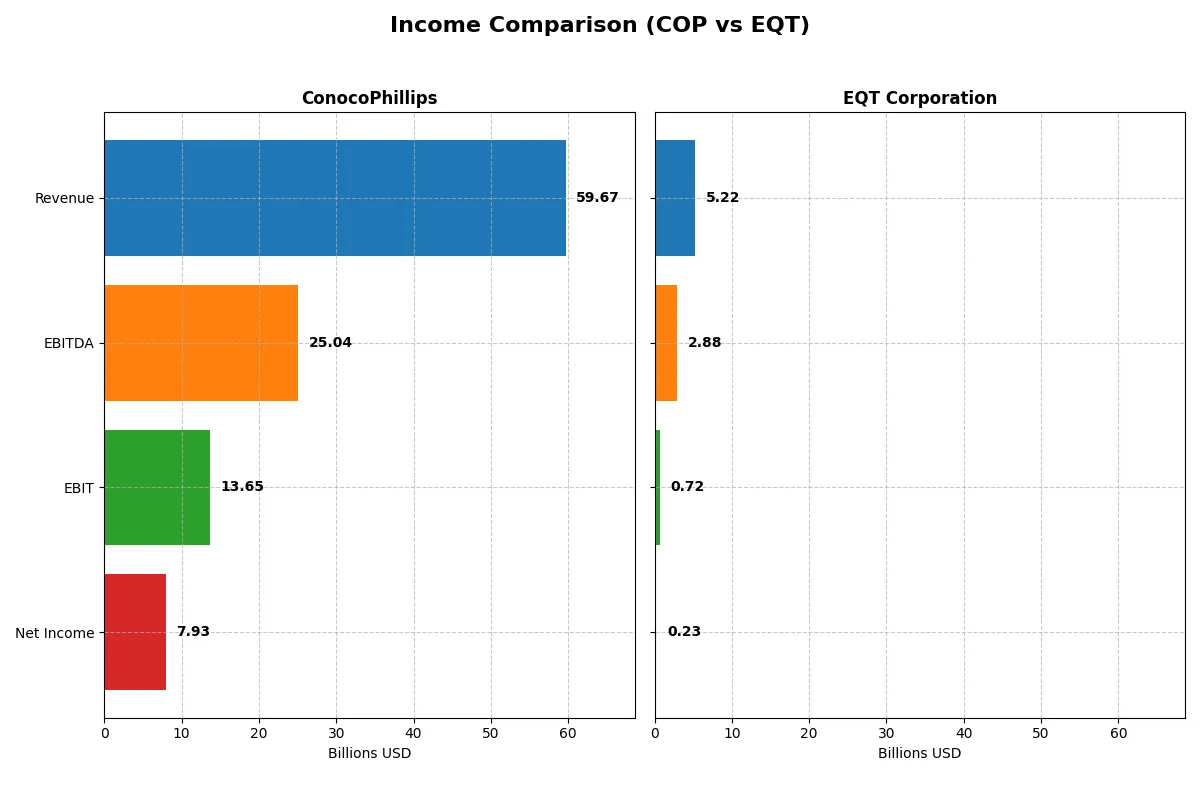
This table dissects the core profitability and scalability of both corporate engines to reveal who dominates the bottom line:
| Metric | ConocoPhillips (COP) | EQT Corporation (EQT) |
|---|---|---|
| Revenue | 59.7B | 5.22B |
| Cost of Revenue | 38.7B | 4.45B |
| Operating Expenses | 9.13B | 82M |
| Gross Profit | 21.0B | 767M |
| EBITDA | 25.0B | 2.88B |
| EBIT | 13.7B | 719M |
| Interest Expense | 1.14B | 455M |
| Net Income | 7.93B | 231M |
| EPS | 6.34 | 0.45 |
| Fiscal Year | 2025 | 2024 |
Income Statement Analysis: The Bottom-Line Duel
This income statement comparison will uncover which company operates its business more efficiently and delivers stronger profitability.
ConocoPhillips Analysis
ConocoPhillips exhibits steady revenue growth, reaching $59.7B in 2025, though net income declined to $7.9B from $9.2B in 2024. The company maintains robust gross and net margins at 35.15% and 13.29%, respectively. Despite a 7.6% drop in EBIT and a 21% decline in net margin year-over-year, ConocoPhillips sustains strong operational efficiency and a favorable overall income profile.
EQT Corporation Analysis
EQT’s revenue grew modestly to $5.22B in 2024, but net income plunged sharply to $231M from $1.74B in 2023. Gross margin remains low at 14.69%, and net margin stands at 4.42%. The company saw a severe 69% EBIT decline and a steep 87% drop in net margin last year, reflecting challenges in controlling costs and maintaining profitability despite growth over the longer term.
Margin Dominance vs. Growth Struggles
ConocoPhillips clearly outperforms EQT in profitability and margin resilience. COP’s superior gross and net margins, despite recent declines, signal a more efficient business model. EQT’s volatile earnings and weaker margins undermine its current profitability. For investors prioritizing steady earnings and margin strength, ConocoPhillips presents a more compelling profile.
Financial Ratios Comparison
These vital ratios act as a diagnostic tool to expose the underlying fiscal health, valuation premiums, and capital efficiency of the companies compared below:
| Ratios | ConocoPhillips (COP) | EQT Corporation (EQT) |
|---|---|---|
| ROE | 12.30% | 1.12% |
| ROIC | 6.86% | 1.66% |
| P/E | 14.13x | 101.91x |
| P/B | 1.74x | 1.14x |
| Current Ratio | 1.30 | 0.70 |
| Quick Ratio | 1.14 | 0.70 |
| D/E (Debt-to-Equity) | 0.36 | 0.45 |
| Debt-to-Assets | 19.23% | 23.51% |
| Interest Coverage | 10.40x | 1.51x |
| Asset Turnover | 0.49 | 0.13 |
| Fixed Asset Turnover | 0.64 | 0.16 |
| Payout Ratio | 50.38% | 141.64% |
| Dividend Yield | 3.57% | 1.39% |
| Fiscal Year | 2025 | 2024 |
Efficiency & Valuation Duel: The Vital Signs
Financial ratios act as a company’s DNA, unveiling hidden risks and operational strengths essential for informed investment decisions.
ConocoPhillips
ConocoPhillips delivers solid profitability with a 12.3% ROE and a favorable 13.3% net margin, reflecting operational efficiency. The stock trades at a reasonable 14.1 P/E, indicating fair valuation. Its 3.57% dividend yield rewards shareholders reliably, supported by a robust balance sheet and prudent capital allocation.
EQT Corporation
EQT Corporation shows weak profitability with a 1.1% ROE and a low 4.4% net margin, signaling operational struggles. The stock appears stretched with a steep 101.9 P/E ratio. Dividend yield stands modest at 1.39%, suggesting limited income return amid ongoing reinvestment challenges and higher financial risk.
Balanced Profitability vs. Stretched Valuation
ConocoPhillips offers a better risk-reward balance with solid returns and attractive valuation metrics. EQT’s ratios expose operational weakness and expensive pricing, fitting more speculative investors comfortable with elevated risk.
Which one offers the Superior Shareholder Reward?
I observe ConocoPhillips (COP) offers a stronger shareholder reward than EQT Corporation (EQT) in 2026. COP yields 3.57% with a sustainable 50% payout ratio and robust FCF coverage (2.82x), supported by consistent buybacks enhancing total return. EQT’s yield is 1.39% with a payout ratio exceeding 140%, signaling unsustainable dividends. EQT’s buyback activity is modest compared to COP’s aggressive capital return. COP balances dividends and buybacks prudently, while EQT’s reinvestment strategy struggles amid weaker free cash flow. For long-term value creation and total return, I favor COP’s disciplined distribution model.
Comparative Score Analysis: The Strategic Profile
The radar chart reveals the fundamental DNA and trade-offs of ConocoPhillips and EQT Corporation, highlighting their financial strengths and valuation challenges:
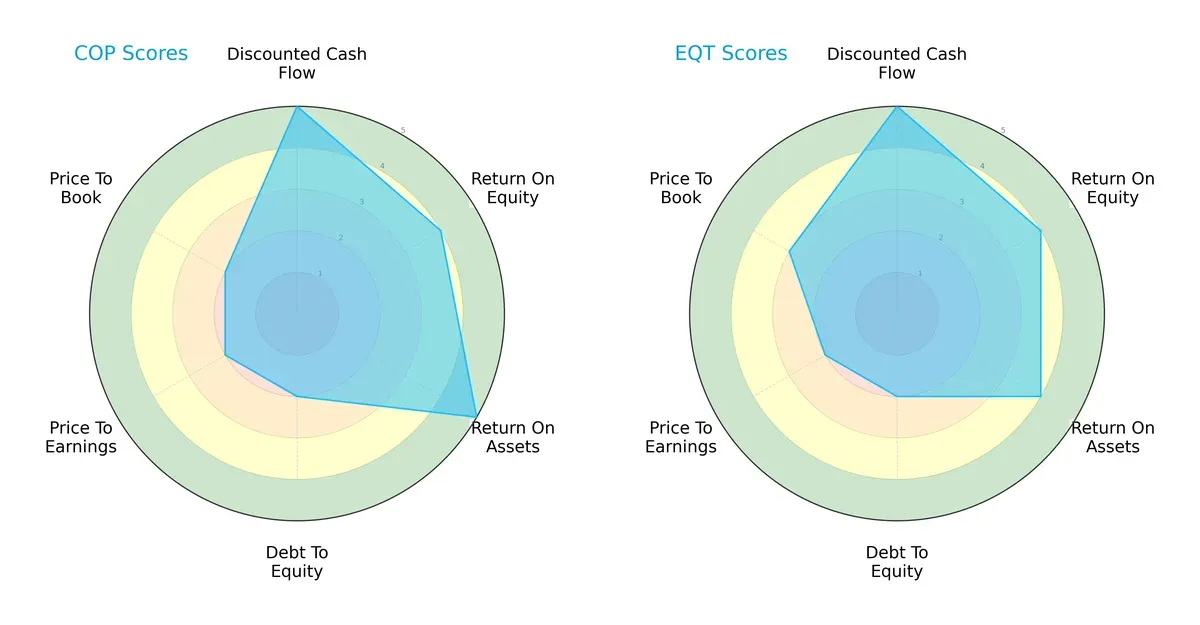
ConocoPhillips excels with a very favorable DCF and ROA score of 5, indicating strong asset efficiency and undervaluation potential. EQT matches the DCF score but has a slightly lower ROA at 4. Both firms share identical ROE scores of 4, showing similar profitability from equity. Both carry unfavorable debt-to-equity and P/E scores, signaling leverage risks and potential overvaluation. EQT shows a modest advantage in price-to-book valuation with a moderate score of 3 versus ConocoPhillips’ unfavorable 2. Overall, ConocoPhillips has a sharper operational edge, while EQT offers a more balanced valuation profile.
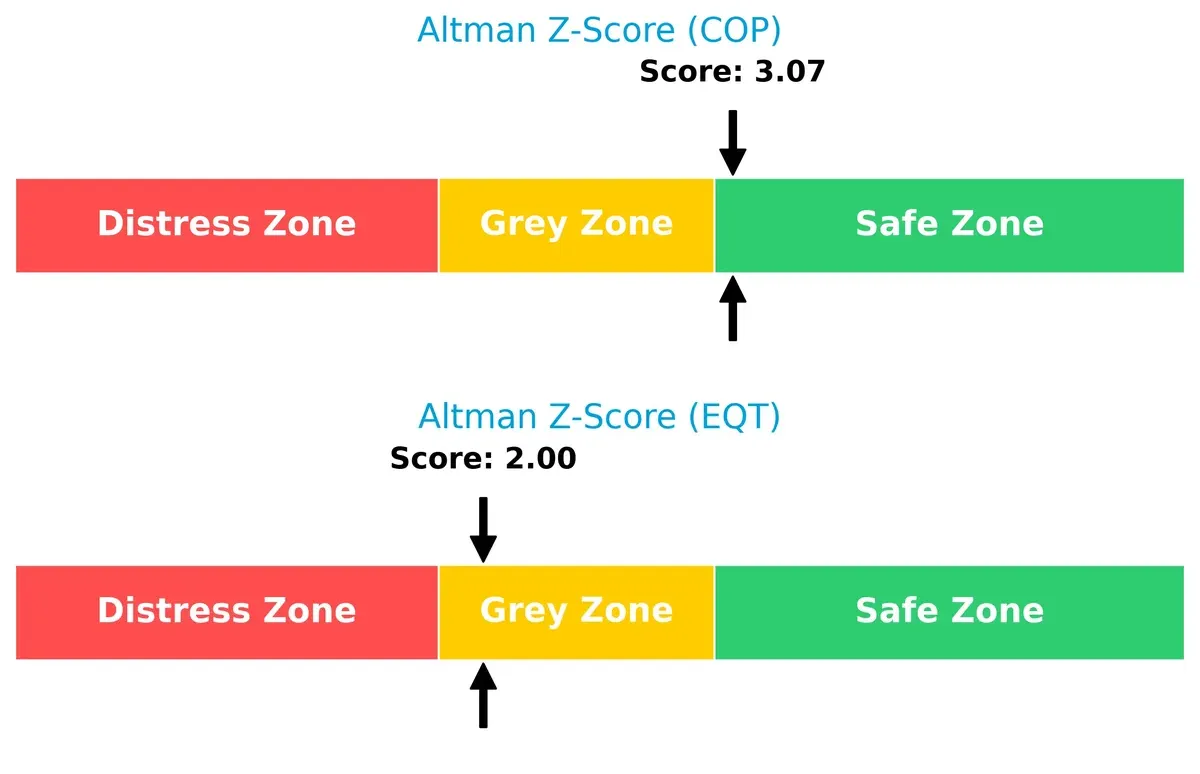
Bankruptcy Risk: Solvency Showdown
ConocoPhillips’ Altman Z-Score of 3.07 places it safely above the distress threshold, while EQT’s 2.00 lingers in the grey zone, raising moderate solvency concerns in this cycle:
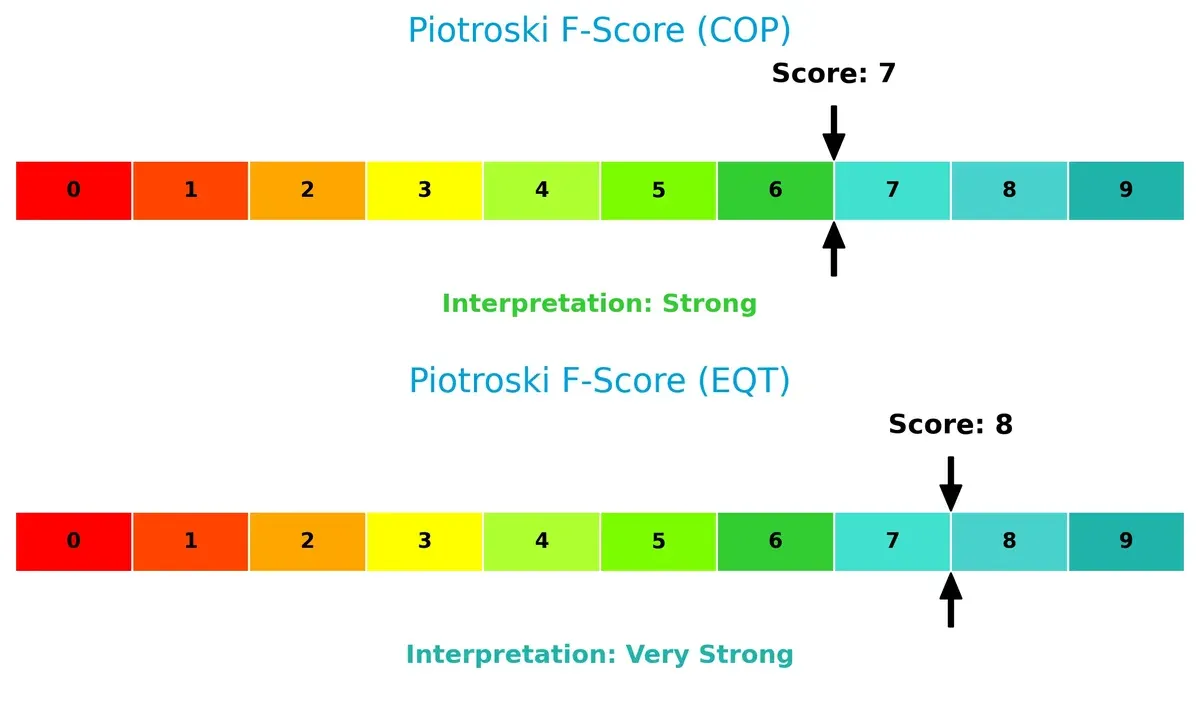
Financial Health: Quality of Operations
EQT’s Piotroski F-Score of 8 reflects very strong financial health, slightly outperforming ConocoPhillips’ strong score of 7, which suggests minor red flags in internal metrics:
How are the two companies positioned?
This section dissects the operational DNA of COP and EQT by comparing their revenue distribution and internal dynamics. The goal is to confront their economic moats and identify which model offers the most resilient competitive advantage.
Revenue Segmentation: The Strategic Mix
This visual comparison dissects how ConocoPhillips and EQT Corporation diversify their income streams and where their primary sector bets lie:
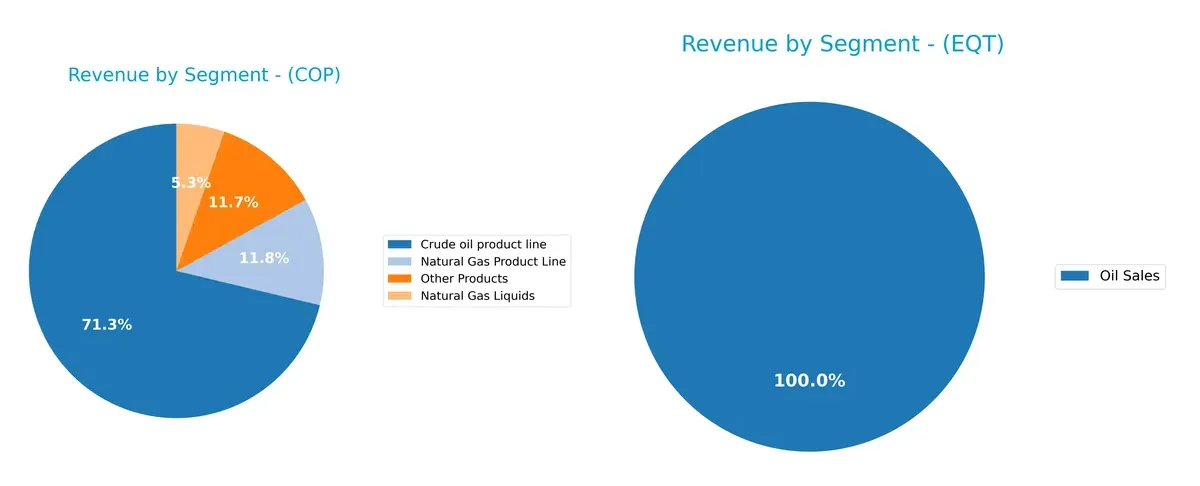
ConocoPhillips anchors revenue heavily in its Crude Oil Product Line, generating $39B in 2024, dwarfing other segments like Natural Gas ($6.44B). EQT leans almost exclusively on Natural Gas Sales at $4.52B, with Oil Sales barely reaching $49M. COP’s diversified portfolio mitigates concentration risk, while EQT’s focus signals infrastructure dominance but exposes it to commodity price swings in natural gas.
Strengths and Weaknesses Comparison
This table compares the Strengths and Weaknesses of ConocoPhillips and EQT Corporation:
ConocoPhillips Strengths
- Diversified revenue streams including crude oil, natural gas, and liquids
- Favorable net margin at 13.29%
- Strong interest coverage at 11.99
- Favorable debt metrics with D/E at 0.36
- Favorable WACC at 4.83%
- Global presence across multiple countries including Canada and UK
EQT Corporation Strengths
- Favorable WACC at 6.43%
- Favorable debt-to-equity ratio at 0.45
- Favorable PB ratio at 1.14
- Presence in natural gas and NGLs sales
- Some midstream asset revenues
- Focused product line with oil sales of 4.9B USD
ConocoPhillips Weaknesses
- Unfavorable asset turnover at 0.49
- Unfavorable fixed asset turnover at 0.64
- Neutral ROE and ROIC indicate moderate capital efficiency
- Medium current ratio at 1.3 limits liquidity buffer
EQT Corporation Weaknesses
- Unfavorable net margin at 4.42%
- Very low ROE at 1.12% and ROIC at 1.66%
- High PE ratio at 101.91 indicating high valuation risk
- Poor liquidity with current and quick ratio at 0.7
- Low interest coverage at 1.58 raises solvency concerns
- Very low asset turnover of 0.13 and fixed asset turnover of 0.16
ConocoPhillips benefits from diversified operations and stronger profitability metrics. EQT shows financial leverage strengths but struggles with profitability and liquidity. These contrasts highlight different operational and financial risk profiles shaping their strategic options.
The Moat Duel: Analyzing Competitive Defensibility
A structural moat is the only true barrier protecting long-term profits from relentless competitive erosion. Let’s dissect two energy giants’ moats:
ConocoPhillips: Diversified Resource Portfolio and Operational Scale
I see ConocoPhillips’ moat rooted in its broad geographic footprint and cost advantage in unconventional and conventional oil production. This manifests as a solid ROIC exceeding WACC by 2%, reflecting value creation despite a declining trend. New LNG projects and unconventional plays in 2026 could deepen its moat, though margin pressures linger.
EQT Corporation: Focused Natural Gas Expertise with Rising Efficiency
EQT contrasts with ConocoPhillips by leveraging a specialized natural gas niche, particularly in the Marcellus shale. Despite currently shedding value (ROIC below WACC), its improving ROIC trend signals strengthening operational efficiency. Expansion into NGLs and infrastructure upgrades may unlock growth and improve competitive positioning.
Scale and Diversification vs. Specialized Efficiency
ConocoPhillips holds a wider moat through scale and diversified assets, creating stable margins and value despite some ROIC erosion. EQT’s narrower but deepening moat offers potential upside if operational gains continue. Overall, ConocoPhillips is better equipped to defend market share against cyclical and competitive shocks.
Which stock offers better returns?
The stock prices of ConocoPhillips and EQT Corporation show contrasting dynamics over the past year, with one facing sustained declines and the other exhibiting strong gains despite recent moderation.
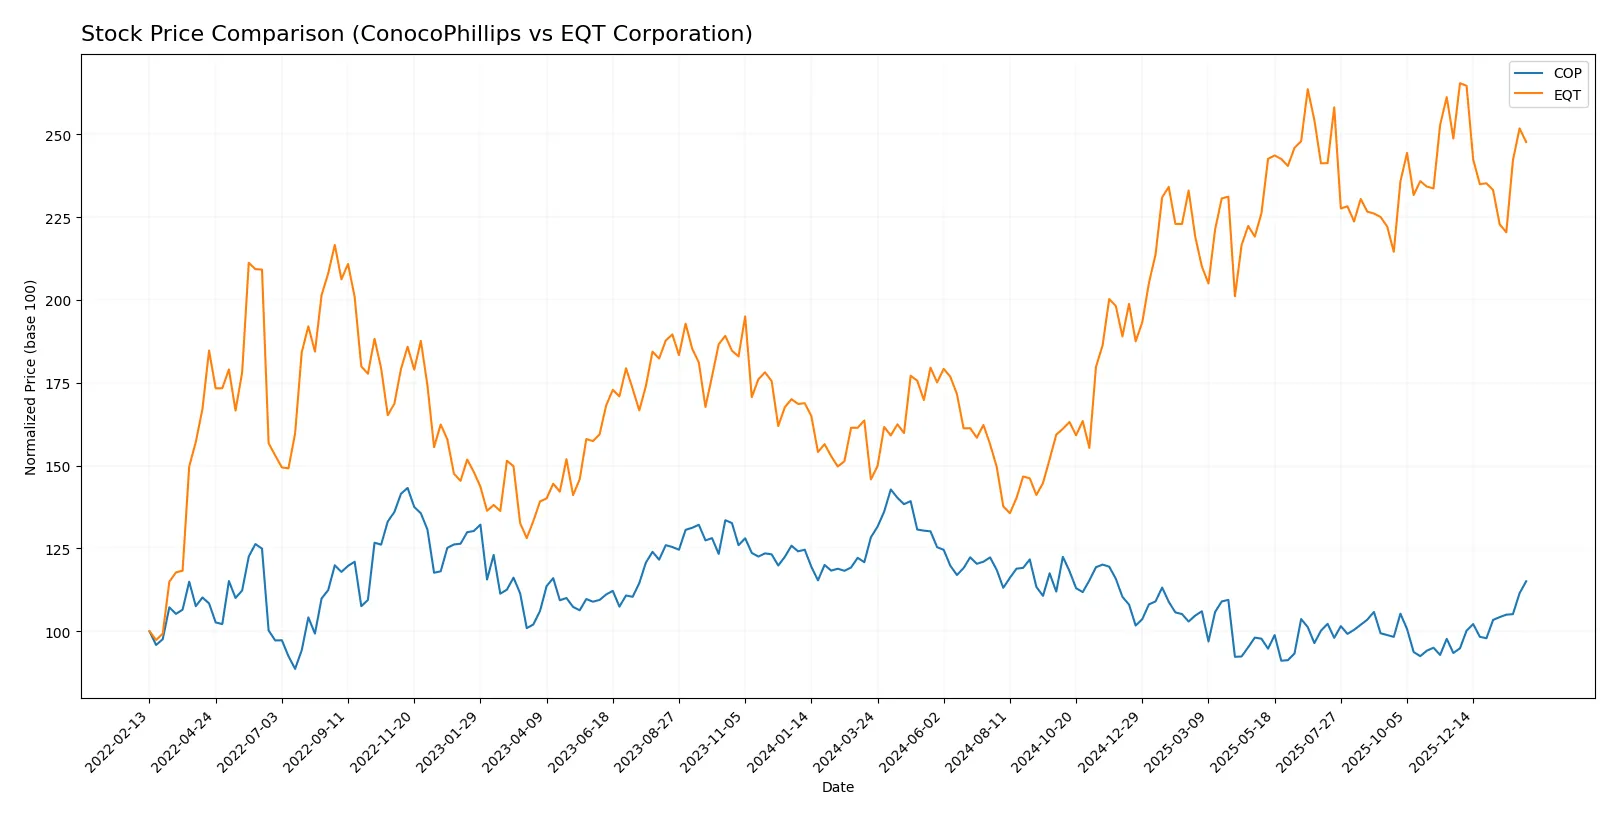
Trend Comparison
ConocoPhillips’ stock fell 10.35% over the past year, marking a bearish trend with accelerating losses. It ranged between $85.19 and $133.52, showing high volatility (std dev 11.69%).
EQT Corporation’s stock rose 69.88% over the same period, indicating a bullish trend with decelerating gains. Its price fluctuated from $31.1 to $60.86, with moderate volatility (std dev 8.57%).
EQT outperformed ConocoPhillips in market performance, delivering strong growth while COP experienced a significant decline.
Target Prices
Analysts provide a cautiously optimistic consensus for these energy sector players, reflecting moderate upside potential.
| Company | Target Low | Target High | Consensus |
|---|---|---|---|
| ConocoPhillips | 98 | 133 | 116.07 |
| EQT Corporation | 23 | 55 | 41.11 |
ConocoPhillips trades below its consensus target, indicating room for appreciation. EQT’s current price exceeds its consensus, suggesting a cautious stance among analysts.

Don’t Let Luck Decide Your Entry Point
Optimize your entry points with our advanced ProRealTime indicators. You’ll get efficient buy signals with precise price targets for maximum performance. Start outperforming now!
How do institutions grade them?
This section compares the recent institutional grades assigned to ConocoPhillips and EQT Corporation:
ConocoPhillips Grades
The following table summarizes institutional grades for ConocoPhillips as of early 2026:
| Grading Company | Action | New Grade | Date |
|---|---|---|---|
| Wells Fargo | Maintain | Overweight | 2026-02-06 |
| BMO Capital | Maintain | Outperform | 2026-02-06 |
| Piper Sandler | Maintain | Overweight | 2026-02-06 |
| Susquehanna | Maintain | Positive | 2026-01-26 |
| Morgan Stanley | Maintain | Overweight | 2026-01-23 |
| JP Morgan | Downgrade | Neutral | 2026-01-20 |
| B of A Securities | Downgrade | Underperform | 2026-01-16 |
| JP Morgan | Maintain | Overweight | 2026-01-13 |
| Wells Fargo | Upgrade | Overweight | 2026-01-12 |
| Piper Sandler | Maintain | Overweight | 2026-01-08 |
EQT Corporation Grades
Below are the latest institutional grades for EQT Corporation through late 2025 and early 2026:
| Grading Company | Action | New Grade | Date |
|---|---|---|---|
| Stephens & Co. | Maintain | Overweight | 2026-01-22 |
| Barclays | Maintain | Overweight | 2026-01-21 |
| Bernstein | Maintain | Outperform | 2026-01-05 |
| Citigroup | Maintain | Buy | 2025-12-19 |
| Mizuho | Maintain | Outperform | 2025-12-12 |
| UBS | Maintain | Buy | 2025-12-12 |
| Scotiabank | Maintain | Sector Perform | 2025-11-21 |
| Piper Sandler | Maintain | Neutral | 2025-11-18 |
| Wells Fargo | Maintain | Overweight | 2025-10-23 |
| UBS | Maintain | Buy | 2025-10-17 |
Which company has the best grades?
EQT Corporation consistently receives strong buy and outperform ratings, while ConocoPhillips shows mixed opinions with some downgrades. EQT’s more uniformly positive grades may signal greater institutional confidence, influencing investor sentiment accordingly.
Risks specific to each company
The following categories identify critical pressure points and systemic threats facing ConocoPhillips and EQT Corporation in the 2026 market environment:
1. Market & Competition
ConocoPhillips
- Diversified global portfolio reduces market risk but faces intense oil & gas competition.
EQT Corporation
- Focused on U.S. natural gas; niche exposure to Marcellus may limit diversification.
2. Capital Structure & Debt
ConocoPhillips
- Low debt-to-equity (0.36) and strong interest coverage (12x) support financial flexibility.
EQT Corporation
- Higher debt-to-equity (0.45) and weak interest coverage (1.58x) increase refinancing risks.
3. Stock Volatility
ConocoPhillips
- Low beta (0.29) indicates stable stock performance relative to market swings.
EQT Corporation
- Higher beta (0.73) signals greater sensitivity to market fluctuations and risk.
4. Regulatory & Legal
ConocoPhillips
- Global operations expose COP to complex regulatory regimes, increasing compliance costs.
EQT Corporation
- U.S.-centric operations face regulatory pressure on methane emissions and fracking practices.
5. Supply Chain & Operations
ConocoPhillips
- Broad asset base and conventional plus unconventional plays help mitigate operational disruptions.
EQT Corporation
- Concentration in Marcellus shale exposes EQT to regional supply chain bottlenecks.
6. ESG & Climate Transition
ConocoPhillips
- Actively investing in transition strategies but faces pressure to reduce carbon footprint globally.
EQT Corporation
- Focused on natural gas, a cleaner fossil fuel, but ESG risks remain from fracking controversies.
7. Geopolitical Exposure
ConocoPhillips
- Global footprint includes volatile regions, raising geopolitical and sovereign risk concerns.
EQT Corporation
- Primarily domestic operations reduce geopolitical risk but increase exposure to U.S. policy shifts.
Which company shows a better risk-adjusted profile?
ConocoPhillips faces its greatest risk in geopolitical exposure due to its global presence. EQT’s critical vulnerability lies in its weak capital structure and operational concentration. I see ConocoPhillips as having a better risk-adjusted profile, supported by its strong interest coverage and low beta. EQT’s low liquidity ratios and elevated P/E ratio highlight financial strain, warranting caution despite its strong Piotroski score.
Final Verdict: Which stock to choose?
ConocoPhillips (COP) excels as a cash-generating powerhouse with a solid economic moat. Its ability to consistently create value above its cost of capital stands out. However, a cautious eye on its declining profitability trend is warranted. COP fits portfolios seeking aggressive growth backed by operational strength and resilience.
EQT Corporation offers a strategic moat rooted in growth potential, marked by improving profitability despite current value erosion. Its recurring revenue safety appears limited, and a weaker liquidity profile introduces risk. EQT suits investors who prefer GARP—growth at a reasonable price—with tolerance for moderate volatility.
If you prioritize stable value creation and robust cash flow, ConocoPhillips outshines with better operational efficiency and financial stability. However, if your strategy leans toward capitalizing on turnaround potential and growth acceleration, EQT offers superior upside despite its current weaknesses. Each presents a distinct analytical scenario aligned with different investor risk profiles.
Disclaimer: Investment carries a risk of loss of initial capital. The past performance is not a reliable indicator of future results. Be sure to understand risks before making an investment decision.
Go Further
I encourage you to read the complete analyses of ConocoPhillips and EQT Corporation to enhance your investment decisions: