Home > Comparison > Energy > COP vs EOG
The strategic rivalry between ConocoPhillips and EOG Resources defines the current trajectory of the Energy sector’s exploration and production landscape. ConocoPhillips operates as a capital-intensive global oil and gas giant with diversified assets across continents. By contrast, EOG Resources focuses on high-efficiency, primarily U.S.-based upstream production with a leaner operational footprint. This analysis will assess which company’s model delivers superior risk-adjusted returns for a balanced portfolio amid evolving energy dynamics.
Table of contents
Companies Overview
ConocoPhillips and EOG Resources dominate the U.S. energy sector with distinct market footprints and strategic priorities.
ConocoPhillips: Global Energy Powerhouse
ConocoPhillips leads as a diversified oil and gas producer with a portfolio spanning conventional and unconventional assets worldwide. It generates revenue through exploration, production, transportation, and marketing of crude oil, LNG, and natural gas liquids. In 2026, the company emphasizes optimizing its global asset base by focusing on efficient production and LNG project development.
EOG Resources, Inc.: Focused U.S. Producer
EOG Resources specializes in exploration and production of crude oil and natural gas, primarily in Texas, New Mexico, and Trinidad and Tobago. Its revenue stems from developing and selling hydrocarbons with a strong emphasis on crude oil. The company’s 2026 strategy centers on maximizing returns in core U.S. shale plays while maintaining disciplined capital allocation.
Strategic Collision: Similarities & Divergences
Both firms operate in oil and gas exploration and production but diverge in scale and geographic reach. ConocoPhillips pursues a global, diversified asset model, while EOG adopts a focused, onshore U.S. shale strategy. Their primary battleground lies in efficient resource development and production cost control. Investors find ConocoPhillips offers broad exposure and scale, whereas EOG provides a more concentrated, high-growth profile.
Income Statement Comparison
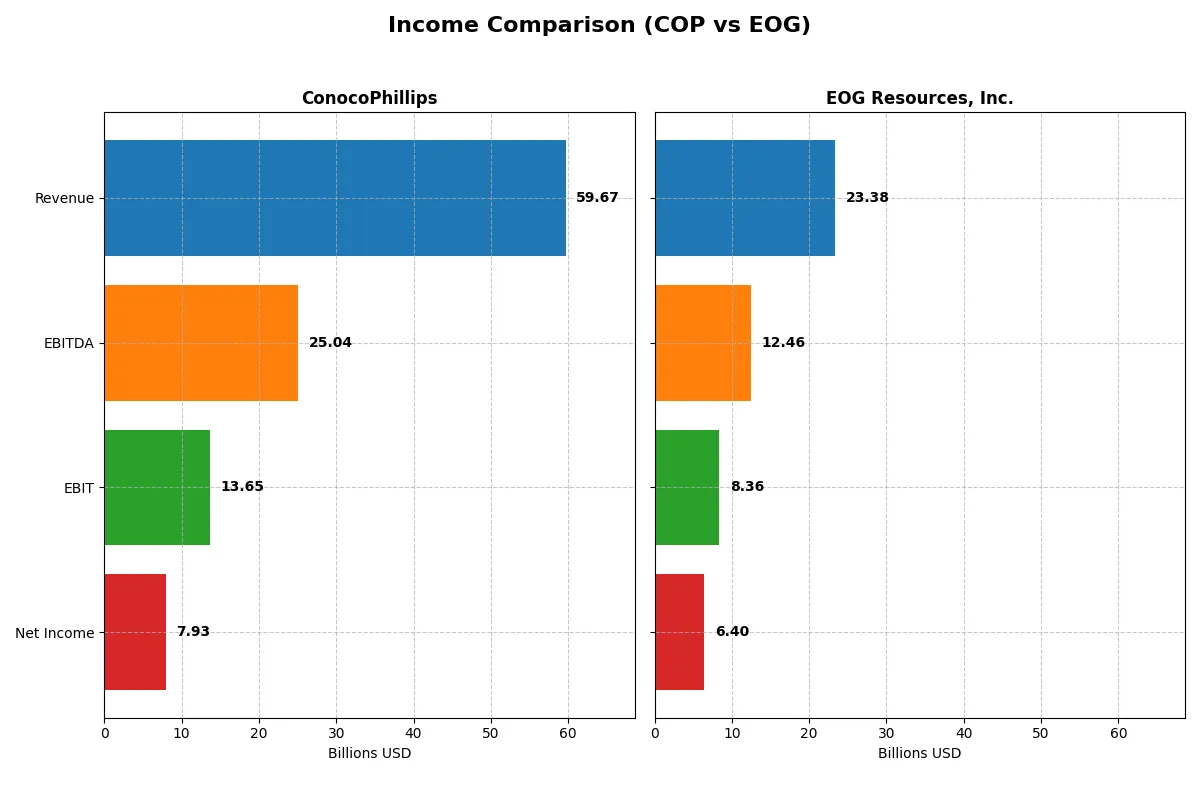
The following data dissects the core profitability and scalability of both corporate engines to reveal who dominates the bottom line:
| Metric | ConocoPhillips (COP) | EOG Resources, Inc. (EOG) |
|---|---|---|
| Revenue | 59.7B | 23.4B |
| Cost of Revenue | 38.7B | 5.7B |
| Operating Expenses | 9.1B | 9.6B |
| Gross Profit | 21.0B | 17.7B |
| EBITDA | 25.0B | 12.5B |
| EBIT | 13.7B | 8.4B |
| Interest Expense | 1.1B | 0.1B |
| Net Income | 7.9B | 6.4B |
| EPS | 6.34 | 11.31 |
| Fiscal Year | 2025 | 2024 |
Income Statement Analysis: The Bottom-Line Duel
This income statement comparison reveals which company drives superior operational efficiency and growth in their core business engine.
ConocoPhillips Analysis
ConocoPhillips grew revenue 9% in 2025, reaching $59.7B, but net income slipped 14% to $7.9B. Gross margin remains solid at 35%, yet net margin declined to 13%, signaling margin pressure despite revenue gains. The 2025 dip in EBIT and net income suggests emerging challenges in cost control and profitability momentum.
EOG Resources, Inc. Analysis
EOG’s 2024 revenue held steady near $23.4B with net income falling 16% to $6.4B. Gross margin remains exceptionally high at 76%, and net margin stands at 27%, reflecting strong cost discipline. However, recent slight declines in revenue and profits indicate some loss of growth momentum despite historically robust margin expansion.
Margin Power vs. Revenue Scale
EOG commands superior margins with a 27% net margin versus ConocoPhillips’ 13%, highlighting more efficient operations. Conversely, ConocoPhillips delivers nearly triple EOG’s revenue but faces margin compression and profit decline. For investors, EOG’s high-margin, disciplined profile offers lean profitability, while ConocoPhillips presents scale with margin risks amid recent earnings softness.
Financial Ratios Comparison
These vital ratios act as a diagnostic tool to expose the underlying fiscal health, valuation premiums, and capital efficiency of the companies compared:
| Ratios | ConocoPhillips (COP) | EOG Resources, Inc. (EOG) |
|---|---|---|
| ROE | 12.3% | 21.8% |
| ROIC | 6.9% | 14.8% |
| P/E | 14.1 | 10.8 |
| P/B | 1.74 | 2.36 |
| Current Ratio | 1.30 | 2.10 |
| Quick Ratio | 1.14 | 1.91 |
| D/E | 0.36 | 0.17 |
| Debt-to-Assets | 19.2% | 10.7% |
| Interest Coverage | 10.4 | 58.6 |
| Asset Turnover | 0.49 | 0.50 |
| Fixed Asset Turnover | 0.64 | 0.68 |
| Payout Ratio | 50.4% | 32.6% |
| Dividend Yield | 3.57% | 3.01% |
| Fiscal Year | 2025 | 2024 |
Efficiency & Valuation Duel: The Vital Signs
Financial ratios serve as a company’s DNA, exposing hidden risks and operational strengths critical for investment analysis.
ConocoPhillips
ConocoPhillips posts a solid net margin of 13.3% and a moderate ROE of 12.3%, reflecting stable profitability. Its P/E ratio at 14.1 suggests a fairly valued stock, neither stretched nor cheap. The 3.6% dividend yield rewards shareholders while maintaining prudent reinvestment, balancing growth with capital returns.
EOG Resources, Inc.
EOG Resources delivers robust profitability with a 27.4% net margin and a strong 21.8% ROE, signaling operational efficiency. Trading at a low P/E of 10.8, the stock appears attractively valued. Its 3.0% dividend yield complements healthy free cash flow, indicating disciplined capital return alongside growth investments.
Balanced Profitability Meets Valuation Discipline
EOG Resources exhibits superior profitability and a more favorable valuation multiple, enhancing its risk-reward profile. ConocoPhillips offers steady returns with a slightly higher dividend yield but more neutral profitability metrics. Investors prioritizing growth and efficiency may lean toward EOG, while those valuing income stability might prefer ConocoPhillips.
Which one offers the Superior Shareholder Reward?
I see ConocoPhillips (COP) yields 3.57% with a 50% payout ratio, backed by strong free cash flow (FCF) coverage of 85%. Its buybacks are modest but consistent, supporting steady returns. EOG Resources (EOG) offers a slightly lower 3.01% yield and a 33% payout ratio, but it invests heavily in buybacks and growth capex, maintaining a robust FCF yield and return on equity. Historically in energy, high buyback intensity often outperforms pure dividends over cycles. I find COP’s balanced distribution with sustainable dividends and moderate buybacks safer during volatility. EOG’s aggressive buybacks boost total returns but carry reinvestment risk. For 2026, I favor COP’s superior total return profile due to dividend sustainability and prudent capital allocation.
Comparative Score Analysis: The Strategic Profile
The radar chart reveals the fundamental DNA and trade-offs of ConocoPhillips and EOG Resources, highlighting their strategic strengths and vulnerabilities:
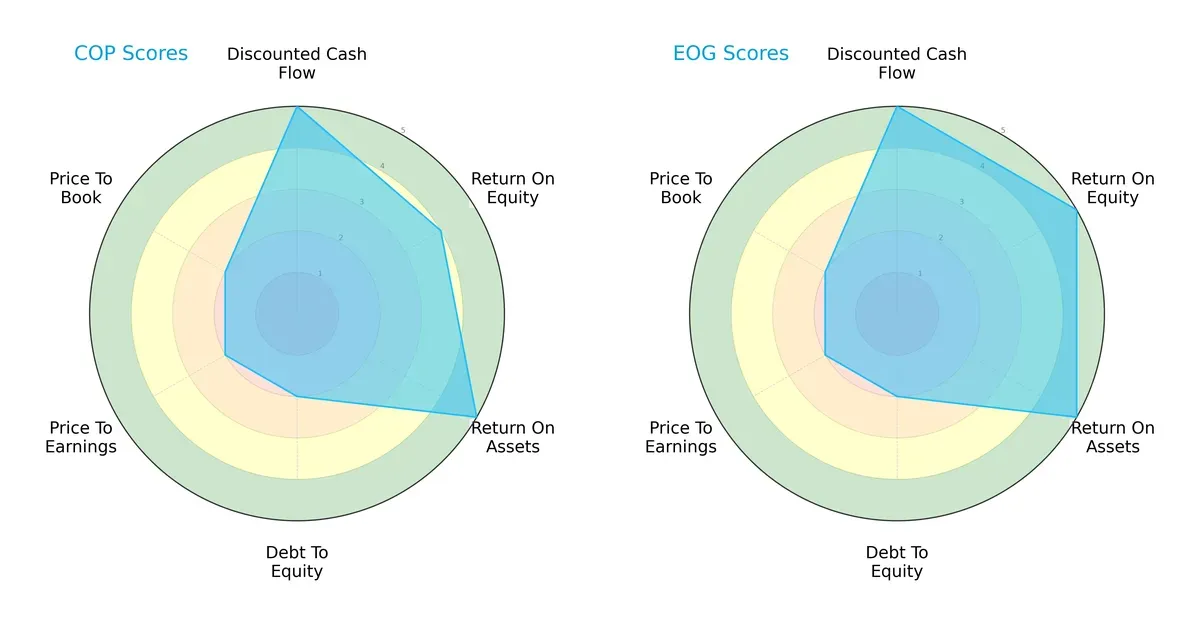
Both firms share strong discounted cash flow scores (5), signaling robust future cash generation prospects. EOG edges ahead with a superior return on equity score (5 vs. 4) and matches ConocoPhillips on return on assets (5 each). However, both companies face balance sheet pressures, reflected in weak debt-to-equity scores (2) and undervaluation signals, as P/E and P/B scores are equally low (2). ConocoPhillips shows a more balanced operational efficiency, while EOG leans on higher profitability metrics.
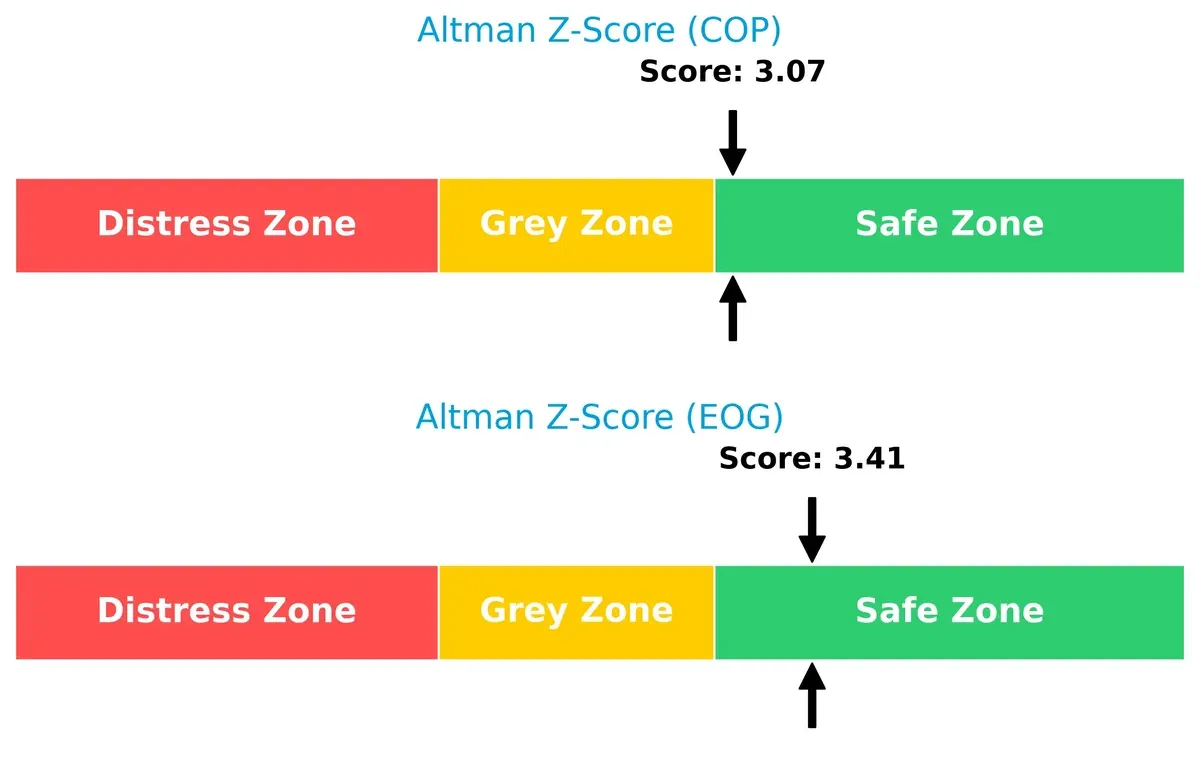
Bankruptcy Risk: Solvency Showdown
The Altman Z-Score gap indicates EOG Resources (3.41) holds a marginally stronger solvency position than ConocoPhillips (3.07), both comfortably in the safe zone amid current market volatility:
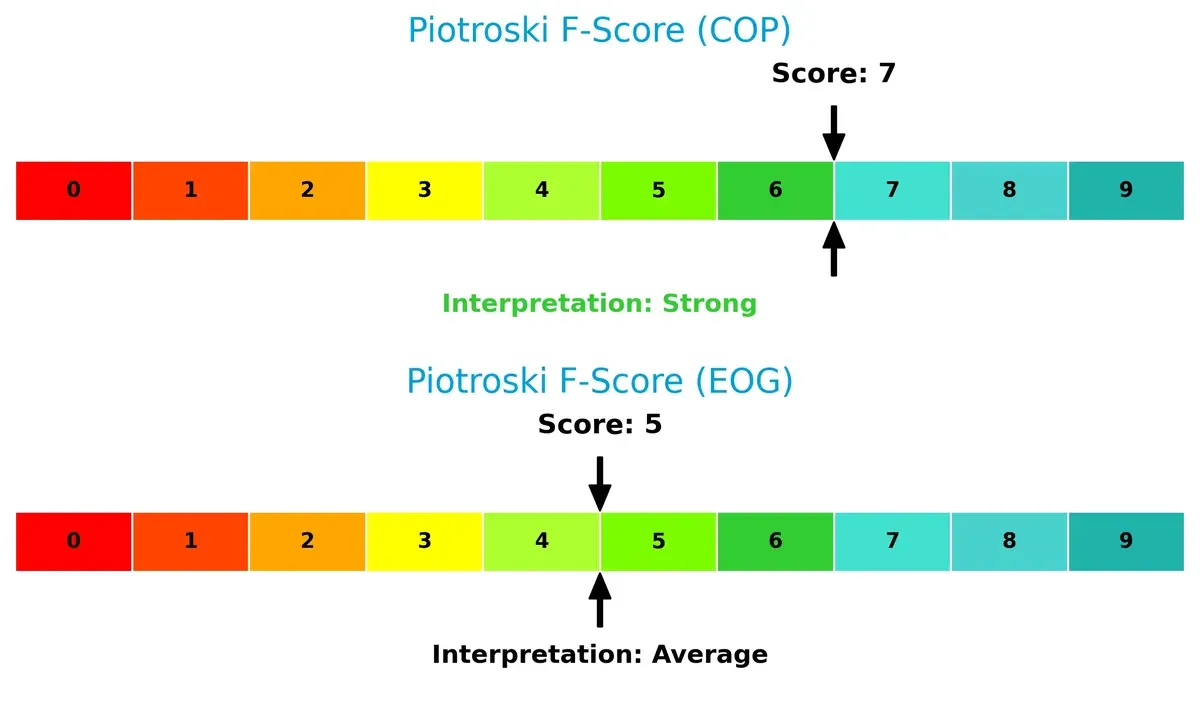
Financial Health: Quality of Operations
ConocoPhillips leads with a Piotroski F-Score of 7, signaling strong financial health and operational quality, while EOG Resources scores a moderate 5, suggesting some internal metric weaknesses:
How are the two companies positioned?
This section dissects the operational DNA of COP and EOG by comparing their revenue distribution and internal dynamics. The goal is to confront their economic moats and identify which model offers the most resilient competitive advantage today.
Revenue Segmentation: The Strategic Mix
The following visual comparison dissects how ConocoPhillips and EOG Resources diversify their income streams and where their primary sector bets lie:
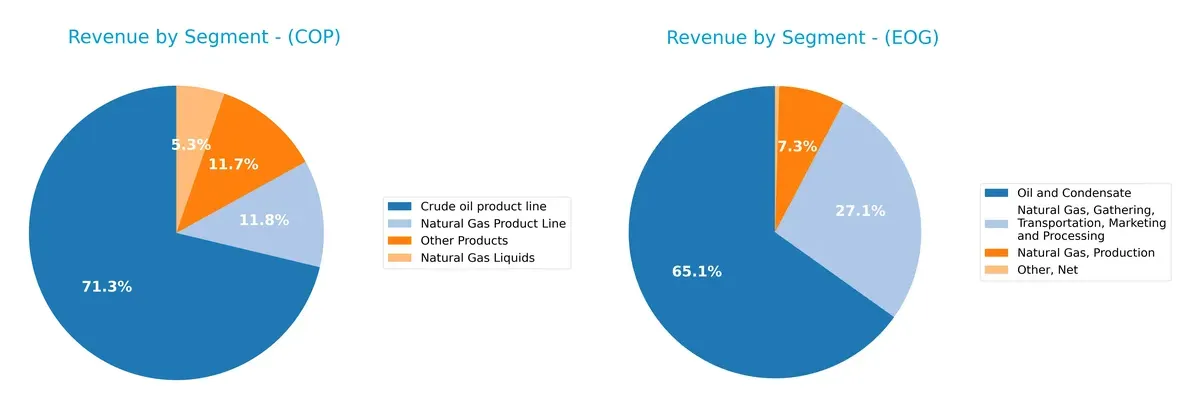
ConocoPhillips anchors its revenue heavily in the Crude Oil product line at $39B, with Natural Gas and Other Products providing solid but smaller contributions. EOG Resources, by contrast, shows a more diversified mix: Oil and Condensate leads at $13.9B, but significant revenue flows from Natural Gas gathering ($5.8B) and production ($1.55B). ConocoPhillips’ concentration poses concentration risk, while EOG’s spread suggests strategic flexibility and ecosystem integration.
Strengths and Weaknesses Comparison
This table compares the strengths and weaknesses of ConocoPhillips and EOG Resources, Inc.:
ConocoPhillips Strengths
- Diversified revenue with multiple product lines including crude oil and natural gas
- Favorable net margin at 13.29% and low WACC at 4.83%
- Strong dividend yield at 3.57%
- Solid debt metrics with D/E at 0.36 and interest coverage near 12x
- Global presence across multiple countries including Canada, UK, and Norway
EOG Resources Strengths
- Higher profitability with net margin of 27.39% and ROE at 21.82%
- Very favorable liquidity ratios with current ratio of 2.1 and quick ratio of 1.91
- Low leverage with D/E of 0.17 and excellent interest coverage at 60.55x
- Focused market share in U.S. with significant oil and condensate revenue
- Favorable valuation multiples including P/E of 10.84
ConocoPhillips Weaknesses
- Asset turnover ratios are unfavorable, indicating less efficient asset use
- Neutral ROIC at 6.86%, only slightly above WACC
- Moderate current ratio of 1.3 may limit short-term flexibility
- Neutral ROE at 12.3%, less robust than peers
EOG Resources Weaknesses
- Asset turnover also unfavorable, suggesting efficiency challenges
- Higher P/B ratio at 2.36, potentially indicating premium valuation
- Concentrated geographic exposure mainly in the U.S. and Trinidad and Tobago
- Dividend yield slightly lower at 3.01%
Overall, ConocoPhillips demonstrates a balanced global diversification and sound financial health but faces efficiency challenges. EOG Resources excels in profitability and liquidity with a focused geographic footprint yet shares efficiency concerns. Both companies must consider these dynamics in capital allocation and operational strategy.
The Moat Duel: Analyzing Competitive Defensibility
A structural moat is the only reliable shield protecting a company’s long-term profits from relentless competitive erosion:
ConocoPhillips: Diversified Asset Portfolio Moat
ConocoPhillips leverages a broad global footprint and diverse resources, reflected in a slightly favorable moat with ROIC above WACC but declining profitability. Expansion into LNG and unconventional plays could deepen its moat in 2026.
EOG Resources, Inc.: Operational Efficiency Moat
EOG’s moat stems from superior operational efficiency and high margin stability, showing a very favorable moat with soaring ROIC well above WACC. Its focus on U.S. shale and disciplined capital allocation supports strong growth prospects.
Global Scale vs. Efficiency Edge
EOG Resources possesses a deeper and more sustainable moat, driven by rapidly growing ROIC and operational excellence. ConocoPhillips creates value but faces declining profitability, making EOG better equipped to defend its market share.
Which stock offers better returns?
The past year reveals divergent dynamics: ConocoPhillips shows a pronounced overall decline with recent strong gains, while EOG Resources exhibits a smaller overall drop and moderate recent recovery.
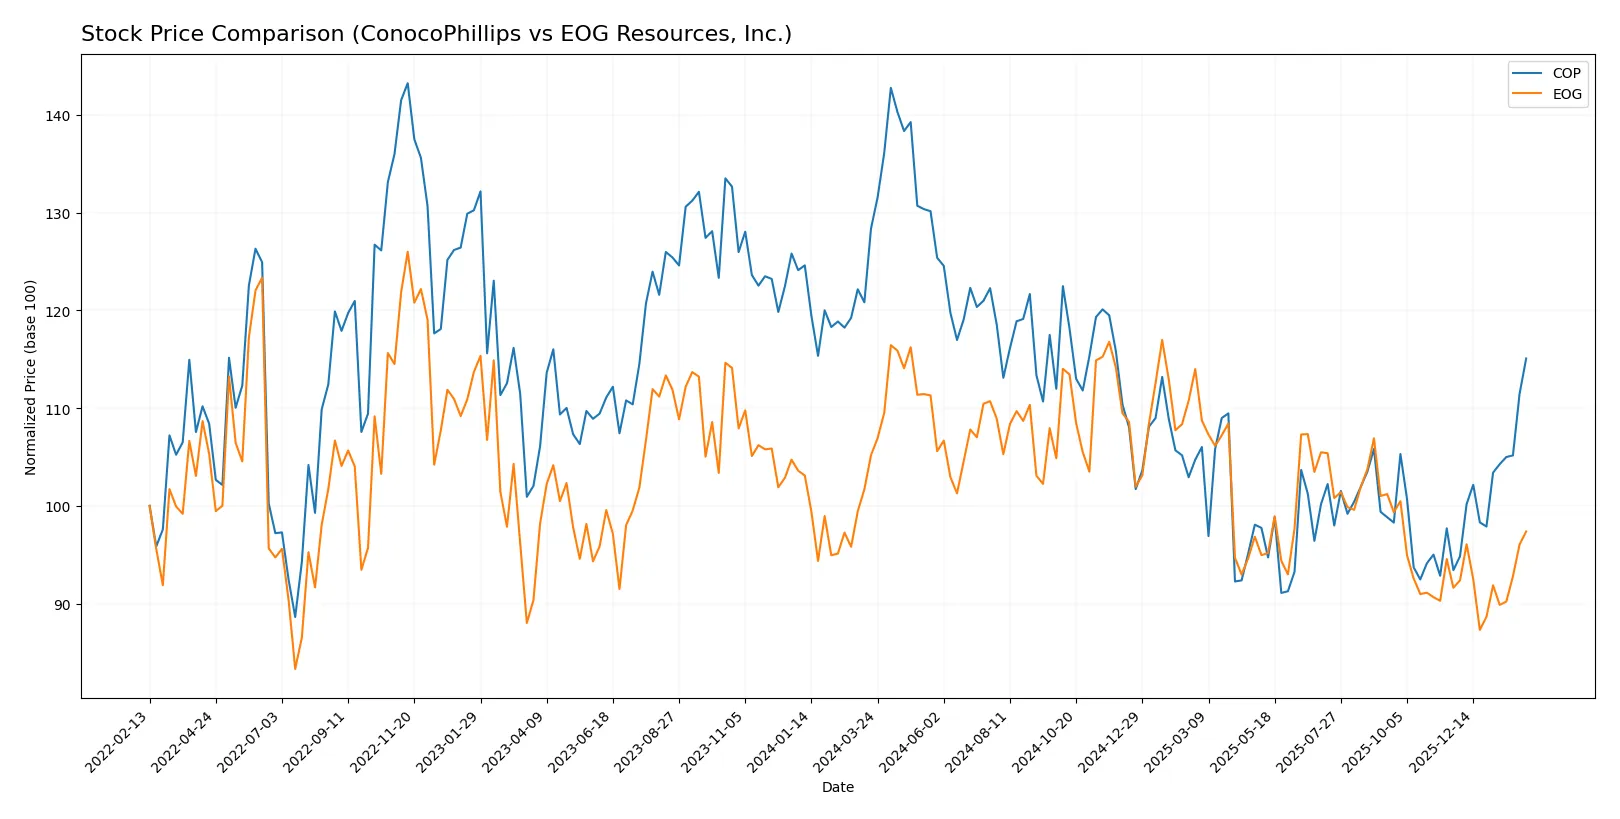
Trend Comparison
ConocoPhillips’ stock price fell 10.35% overall in 12 months, marking a bearish trend with accelerating decline. It ranged between 85.19 and 133.52, showing high volatility (11.69 std deviation).
EOG Resources’ share price dropped 7.4% over the same period, also bearish with accelerating loss. It traded between 101.93 and 136.58, with lower volatility (9.11 std deviation).
ConocoPhillips experienced a stronger overall loss but sharper recent rebound (+23.18%) versus EOG’s smaller decline and modest recent gain (+6.29%). COP’s market performance shows higher amplitude.
Target Prices
Analyst consensus points to solid upside potential for both ConocoPhillips and EOG Resources.
| Company | Target Low | Target High | Consensus |
|---|---|---|---|
| ConocoPhillips | 98 | 133 | 116.07 |
| EOG Resources, Inc. | 123 | 153 | 135 |
ConocoPhillips’ consensus target exceeds its current price of $107.62, implying moderate upside. EOG Resources shows a stronger target premium over its $113.70 share price, suggesting more aggressive growth expectations.

Don’t Let Luck Decide Your Entry Point
Optimize your entry points with our advanced ProRealTime indicators. You’ll get efficient buy signals with precise price targets for maximum performance. Start outperforming now!
How do institutions grade them?
ConocoPhillips Grades
The latest institutional grades for ConocoPhillips are summarized below:
| Grading Company | Action | New Grade | Date |
|---|---|---|---|
| Wells Fargo | Maintain | Overweight | 2026-02-06 |
| BMO Capital | Maintain | Outperform | 2026-02-06 |
| Piper Sandler | Maintain | Overweight | 2026-02-06 |
| Susquehanna | Maintain | Positive | 2026-01-26 |
| Morgan Stanley | Maintain | Overweight | 2026-01-23 |
| JP Morgan | Downgrade | Neutral | 2026-01-20 |
| B of A Securities | Downgrade | Underperform | 2026-01-16 |
| JP Morgan | Maintain | Overweight | 2026-01-13 |
| Wells Fargo | Upgrade | Overweight | 2026-01-12 |
| Piper Sandler | Maintain | Overweight | 2026-01-08 |
EOG Resources, Inc. Grades
The recent institutional grades for EOG Resources, Inc. are detailed as follows:
| Grading Company | Action | New Grade | Date |
|---|---|---|---|
| Piper Sandler | Maintain | Neutral | 2026-01-28 |
| Wells Fargo | Maintain | Overweight | 2026-01-27 |
| Susquehanna | Maintain | Positive | 2026-01-26 |
| Morgan Stanley | Maintain | Equal Weight | 2026-01-23 |
| Barclays | Maintain | Equal Weight | 2026-01-21 |
| Keybanc | Downgrade | Sector Weight | 2026-01-16 |
| RBC Capital | Maintain | Outperform | 2026-01-13 |
| Bernstein | Maintain | Market Perform | 2026-01-05 |
| Citigroup | Maintain | Neutral | 2025-12-17 |
| UBS | Maintain | Buy | 2025-12-12 |
Which company has the best grades?
ConocoPhillips holds generally stronger grades with multiple Overweight and Outperform ratings. EOG Resources, Inc. shows more Neutral and Equal Weight grades, indicating a comparatively cautious outlook. Investors may interpret ConocoPhillips’ higher ratings as a signal of greater institutional confidence.
Risks specific to each company
The following categories identify the critical pressure points and systemic threats facing both firms in the 2026 market environment:
1. Market & Competition
ConocoPhillips
- Larger market cap at $133B provides scale advantages in global energy markets.
EOG Resources, Inc.
- Smaller $62B cap limits scale but supports nimble operations in key U.S. basins.
2. Capital Structure & Debt
ConocoPhillips
- Debt-to-assets at 19.2% is higher but manageable; interest coverage of 12x signals solid debt service capacity.
EOG Resources, Inc.
- Stronger leverage profile with 10.7% debt-to-assets and exceptional 60x interest coverage.
3. Stock Volatility
ConocoPhillips
- Low beta of 0.29 indicates lower market volatility and risk relative to the sector.
EOG Resources, Inc.
- Higher beta at 0.47 suggests more price sensitivity and potential volatility.
4. Regulatory & Legal
ConocoPhillips
- Global footprint exposes it to diverse and complex regulatory regimes, increasing compliance risk.
EOG Resources, Inc.
- More focused U.S. and Trinidad operations reduce regulatory complexity but still subject to U.S. energy regulations.
5. Supply Chain & Operations
ConocoPhillips
- Broad asset base including LNG and oil sands may face operational challenges and cost pressures.
EOG Resources, Inc.
- Concentrated operations in shale and conventional plays may benefit from operational efficiency but risk regional disruption.
6. ESG & Climate Transition
ConocoPhillips
- Larger carbon footprint demands aggressive climate transition strategies to meet investor and regulatory expectations.
EOG Resources, Inc.
- Smaller scale allows potentially faster adaptation to ESG mandates but limited by core fossil fuel exposure.
7. Geopolitical Exposure
ConocoPhillips
- Significant international presence increases geopolitical risk, especially in volatile regions.
EOG Resources, Inc.
- Primarily U.S.-based operations limit geopolitical risk but remain exposed to domestic policy shifts.
Which company shows a better risk-adjusted profile?
EOG Resources faces less leverage and stronger liquidity, with superior interest coverage and higher profitability margins. However, its higher stock volatility and narrower operational footprint introduce concentrated risks. ConocoPhillips benefits from scale and lower beta but carries higher geopolitical and regulatory complexity. EOG’s stronger debt metrics and profitability grant it a better risk-adjusted profile despite volatility concerns. The recent data highlights EOG’s exceptional interest coverage ratio (60.5x) as a key buffer against financial distress, while ConocoPhillips’ broader global exposure remains a persistent risk factor.
Final Verdict: Which stock to choose?
ConocoPhillips showcases a robust cash-generation engine, driving consistent value creation despite a recent dip in profitability. Its slightly declining ROIC signals a point of vigilance. This company suits investors seeking steady income with moderate growth appetite, fitting well within an Income & Value-oriented portfolio.
EOG Resources impresses with a formidable strategic moat, evidenced by its soaring ROIC and strong balance sheet liquidity. Its recurring operational efficiency and expanding profitability offer better safety compared to ConocoPhillips. EOG fits investors focused on GARP—Growth at a Reasonable Price—with a tilt toward capital appreciation.
If you prioritize income stability and a proven cash machine, ConocoPhillips is the compelling choice due to its favorable dividend yield and solid value creation. However, if you seek growth with a durable competitive advantage and superior capital efficiency, EOG outshines by delivering accelerating profitability and stronger financial resilience.
Disclaimer: Investment carries a risk of loss of initial capital. The past performance is not a reliable indicator of future results. Be sure to understand risks before making an investment decision.
Go Further
I encourage you to read the complete analyses of ConocoPhillips and EOG Resources, Inc. to enhance your investment decisions: