Home > Comparison > Energy > COP vs FANG
The strategic rivalry between ConocoPhillips and Diamondback Energy shapes the competitive dynamics of the Energy sector. ConocoPhillips operates as a diversified global oil and gas exploration and production giant, while Diamondback Energy focuses on unconventional, onshore assets within the Permian Basin. This analysis pits broad international scale against regional operational specialization, aiming to identify which trajectory delivers superior risk-adjusted returns for a diversified portfolio.
Table of contents
Companies Overview
ConocoPhillips and Diamondback Energy dominate the US oil and gas exploration landscape with distinct scales and strategies.
ConocoPhillips: Global Energy Giant
ConocoPhillips stands as a major global player in oil and gas exploration and production. It generates revenue by exploiting a diversified portfolio of conventional and unconventional energy assets worldwide. In 2026, the company emphasizes broad geographic exposure and integrated operations, balancing tight oil, LNG, and oil sands to maintain its competitive edge.
Diamondback Energy, Inc.: Permian Basin Specialist
Diamondback Energy focuses on the development of unconventional reserves in the Permian Basin. Its revenue engine centers on acquiring and optimizing onshore oil and gas assets, including extensive midstream infrastructure. The firm’s 2026 strategy prioritizes maximizing production efficiency and expanding its acreage and pipeline network within West Texas and New Mexico’s prolific basins.
Strategic Collision: Similarities & Divergences
Both firms excel in oil and gas production but differ sharply in scope—ConocoPhillips pursues a diversified global footprint, while Diamondback targets concentrated Permian assets with integrated infrastructure. Their primary battleground lies in shale and tight oil extraction efficiency. This contrast yields distinct investment profiles: ConocoPhillips offers broad energy exposure, whereas Diamondback delivers focused growth potential within a key US basin.
Income Statement Comparison
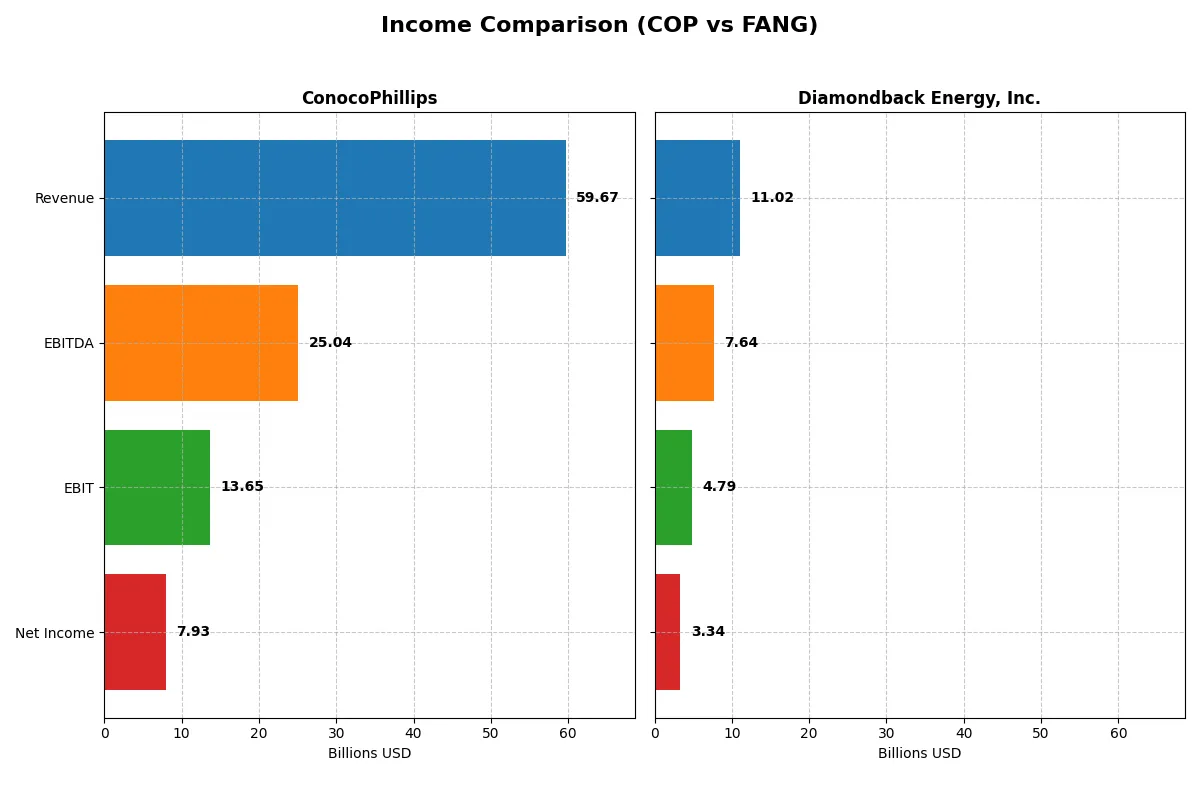
This data dissects the core profitability and scalability of both corporate engines to reveal who dominates the bottom line:
| Metric | ConocoPhillips (COP) | Diamondback Energy, Inc. (FANG) |
|---|---|---|
| Revenue | 59.7B | 11.0B |
| Cost of Revenue | 38.7B | 6.1B |
| Operating Expenses | 9.1B | 0.6B |
| Gross Profit | 21.0B | 5.0B |
| EBITDA | 25.0B | 7.6B |
| EBIT | 13.7B | 4.8B |
| Interest Expense | 1.1B | 0.3B |
| Net Income | 7.9B | 3.3B |
| EPS | 6.34 | 15.53 |
| Fiscal Year | 2025 | 2024 |
Income Statement Analysis: The Bottom-Line Duel
The income statement comparison reveals each company’s ability to convert revenue into profit, showing the true efficiency of their corporate engines.
ConocoPhillips Analysis
ConocoPhillips grew revenue by 9% in 2025 to $59.7B, but net income fell 14% to $7.9B, indicating margin pressure. Its gross margin remains healthy at 35%, yet net margin declined to 13.3%. The drop in EBIT and net margin signals challenges in operating efficiency despite stable revenue momentum.
Diamondback Energy, Inc. Analysis
Diamondback surged revenue 32% in 2024 to $11.0B, with net income up 6% to $3.3B, maintaining robust margin health. Gross margin stands at 45%, and net margin at 30%, reflecting strong profitability. EBIT margin improved 8%, showing operational leverage and solid momentum in profit growth.
Margin Efficiency vs. Growth Momentum
Diamondback leads with superior margin expansion and higher net margin at 30% versus ConocoPhillips’ 13%. ConocoPhillips boasts larger revenue but faces declining net income and margin compression. For investors, Diamondback’s combination of sharp growth and margin efficiency signals a more attractive profit engine in this comparison.
Financial Ratios Comparison
These vital ratios act as a diagnostic tool to expose the underlying fiscal health, valuation premiums, and capital efficiency of the companies analyzed:
| Ratios | ConocoPhillips (COP) | Diamondback Energy (FANG) |
|---|---|---|
| ROE | 12.3% | 8.8% |
| ROIC | 6.9% | 5.8% |
| P/E | 14.1 | 10.5 |
| P/B | 1.74 | 0.93 |
| Current Ratio | 1.30 | 0.44 |
| Quick Ratio | 1.14 | 0.41 |
| D/E | 0.36 | 0.33 |
| Debt-to-Assets | 19.2% | 18.5% |
| Interest Coverage | 10.4 | 15.1 |
| Asset Turnover | 0.49 | 0.16 |
| Fixed Asset Turnover | 0.64 | 0.17 |
| Payout ratio | 50.4% | 47.3% |
| Dividend yield | 3.57% | 4.51% |
| Fiscal Year | 2025 | 2024 |
Efficiency & Valuation Duel: The Vital Signs
Financial ratios serve as a company’s DNA, uncovering hidden risks and shining light on operational excellence.
ConocoPhillips
ConocoPhillips shows solid profitability with a 12.3% ROE and a favorable 13.29% net margin. Its P/E of 14.13 suggests a fairly valued stock, while a 3.57% dividend yield rewards shareholders. The company balances efficient capital use (ROIC at 6.86%) with prudent leverage, supporting steady returns amid moderate asset turnover.
Diamondback Energy, Inc.
Diamondback Energy commands a robust 30.28% net margin but a weaker 8.85% ROE, indicating profitability concentrated in fewer equity returns. The stock trades cheaply at a P/E of 10.48 and offers a higher 4.51% dividend yield. However, its low current and quick ratios flag liquidity concerns, despite favorable debt management and interest coverage.
Valuation Stability vs. Margin Strength
Both firms exhibit favorable overall ratios, but ConocoPhillips provides a balanced risk-reward profile with stable returns and sound liquidity. Diamondback’s impressive margin contrasts with liquidity red flags, appealing to investors prioritizing yield and margin over operational safety. Each fits distinct investor risk appetites.
Which one offers the Superior Shareholder Reward?
I compare ConocoPhillips (COP) and Diamondback Energy (FANG) on dividends and buybacks. COP yields 3.57% with a 50% payout ratio, sustainably covered by 85% free cash flow. FANG yields 4.51%, but free cash flow is negative, raising sustainability concerns. COP’s disciplined buybacks complement dividends, while FANG’s capex-heavy reinvestment limits buybacks. Historically, COP’s balanced distribution and strong cash flow imply a more reliable total return in 2026. I conclude COP offers the superior shareholder reward due to its sustainable dividend and prudent capital allocation.
Comparative Score Analysis: The Strategic Profile
The radar chart reveals the fundamental DNA and trade-offs of ConocoPhillips and Diamondback Energy, Inc., highlighting their financial strengths and valuation nuances:
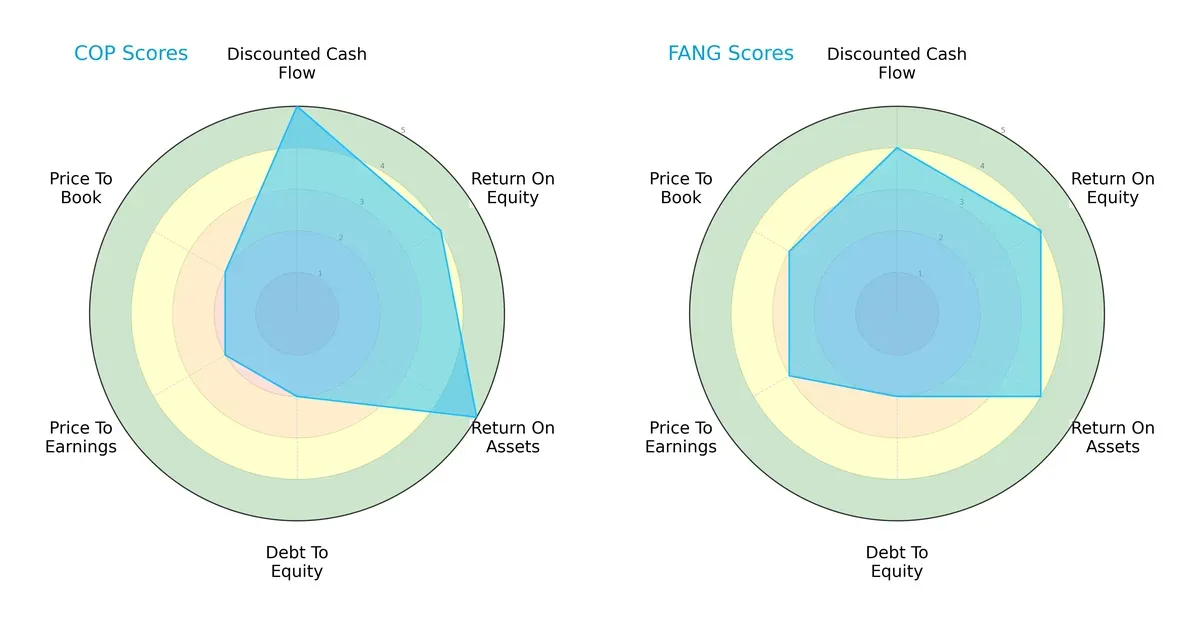
ConocoPhillips leads with a stronger DCF (5 vs. 4) and ROA (5 vs. 4), indicating superior cash flow generation and asset efficiency. Both firms share equal ROE scores (4), showing comparable equity returns. However, both face balance sheet risks with weak debt-to-equity scores (2). Diamondback edges slightly on valuation metrics (PE/PB scores 3 vs. 2), suggesting a more reasonable market pricing. Overall, ConocoPhillips presents a more balanced profile anchored by operational efficiency, while Diamondback relies on modest valuation advantages.
Bankruptcy Risk: Solvency Showdown
The Altman Z-Score gap highlights ConocoPhillips’ safer financial footing versus Diamondback’s distress signals in this cycle:
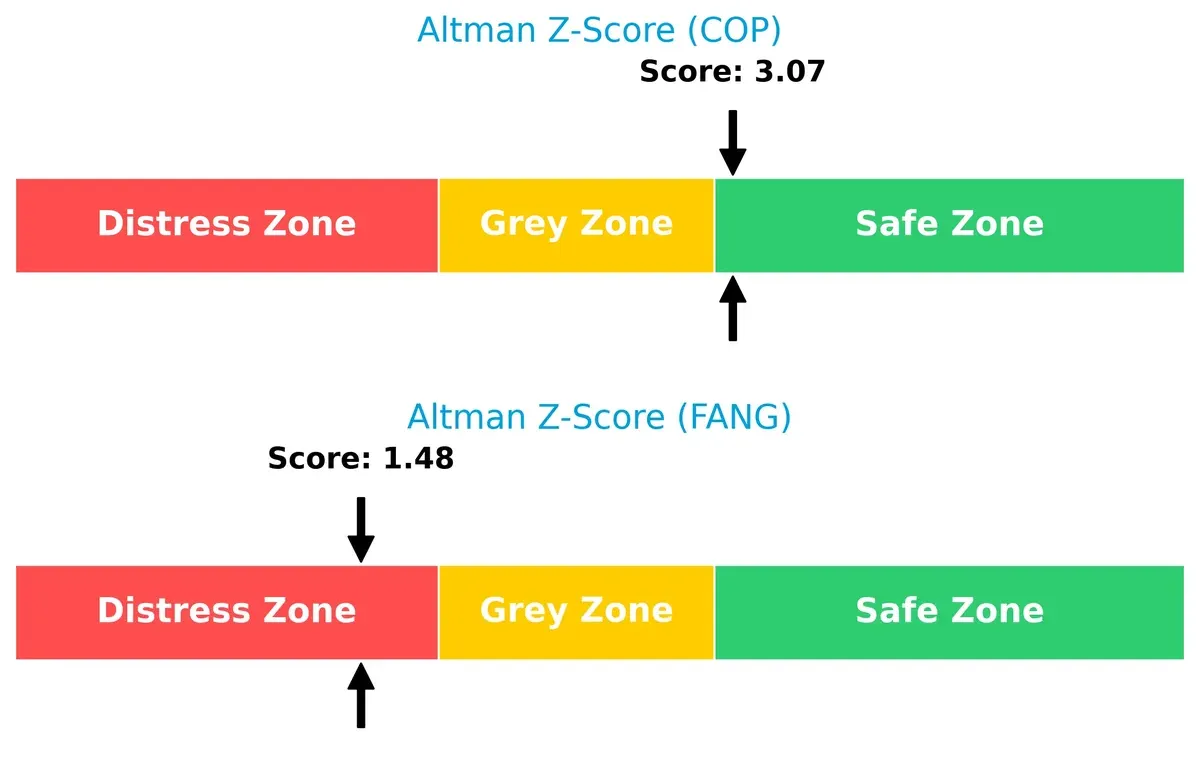
ConocoPhillips scores 3.07, safely above the distress threshold, signaling robust solvency and low bankruptcy risk. Diamondback’s 1.48 places it in the distress zone, implying heightened vulnerability under current market pressures. This disparity underscores ConocoPhillips’ superior resilience for long-term survival.
Financial Health: Quality of Operations
Piotroski F-Scores reveal ConocoPhillips’ stronger operational health compared to Diamondback’s average metrics:
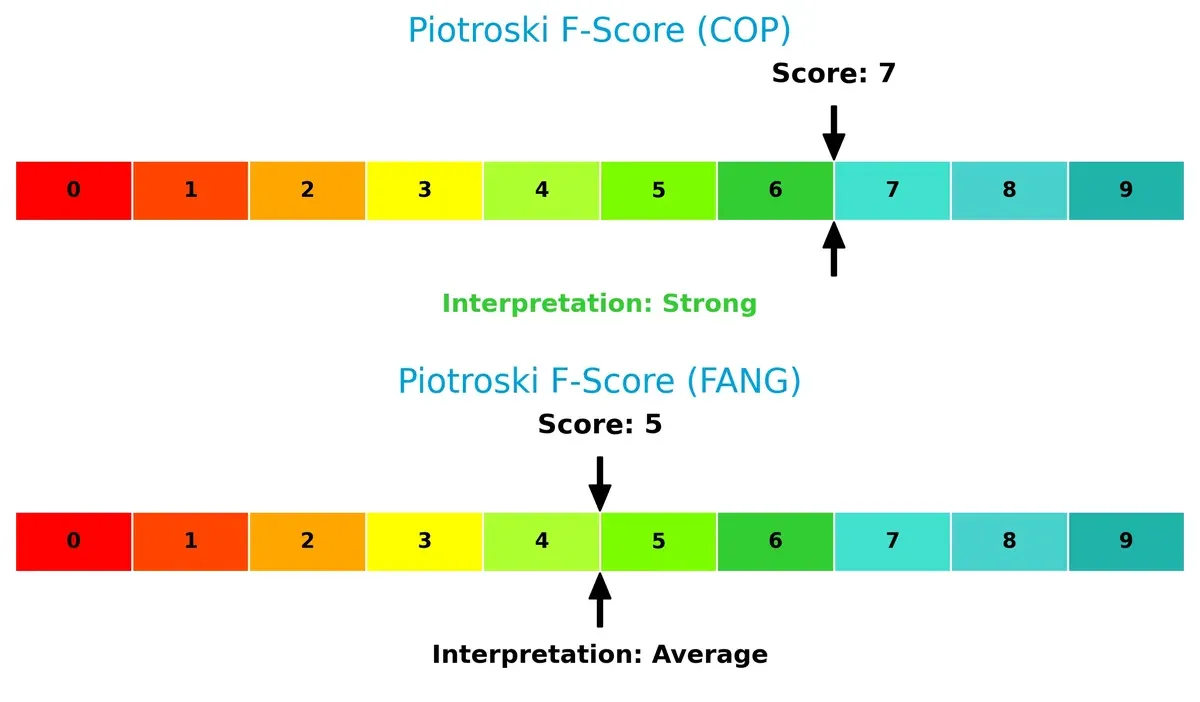
ConocoPhillips scores 7, indicating strong internal financial controls and profitability. Diamondback’s 5 signals average health and potential red flags in operational efficiency or leverage. This internal strength gap favors ConocoPhillips for disciplined capital allocation and sustainable performance.
How are the two companies positioned?
This section dissects the operational DNA of COP and FANG by comparing their revenue distribution and internal strengths and weaknesses. The goal is to confront their economic moats and identify which model delivers the most resilient competitive advantage today.
Revenue Segmentation: The Strategic Mix
This visual comparison dissects how ConocoPhillips and Diamondback Energy diversify income streams and reveals where each company places its primary sector bets:
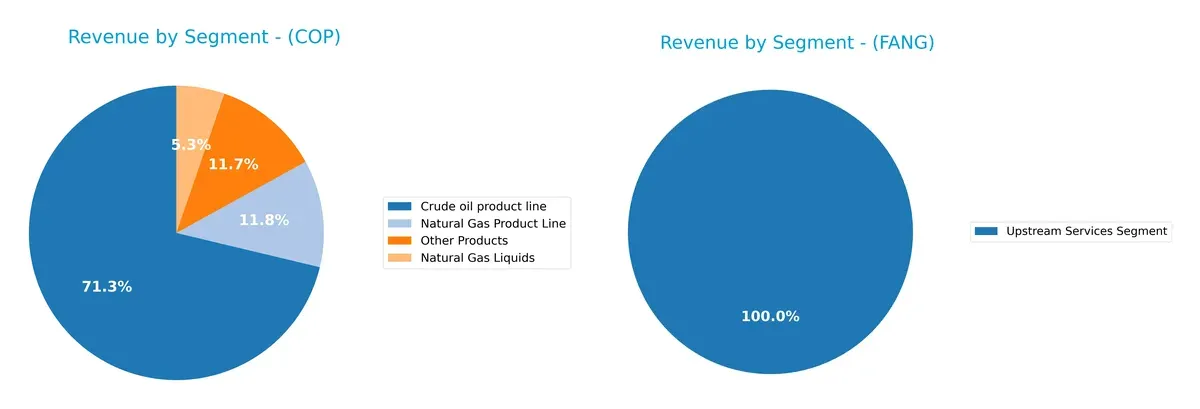
ConocoPhillips anchors revenue in crude oil at $39B, complemented by natural gas ($6.4B) and liquids ($2.9B), showing a balanced energy portfolio. Diamondback Energy relies heavily on upstream services at $8.3B, with minimal midstream exposure. ConocoPhillips’ diversified mix reduces concentration risk and leverages integrated operations. Diamondback’s upstream focus increases vulnerability to oil price swings but benefits from operational specialization.
Strengths and Weaknesses Comparison
This table compares the Strengths and Weaknesses of ConocoPhillips and Diamondback Energy, Inc.:
ConocoPhillips Strengths
- Diversified product lines across crude oil, natural gas, liquids, and other products
- Robust global presence including Canada, Norway, UK, and Asia
- Favorable net margin of 13.29%
- Strong interest coverage ratio at 11.99
- Favorable debt metrics with debt-to-assets at 19.23% and DE at 0.36
- Dividend yield of 3.57%
Diamondback Energy Strengths
- High net margin of 30.28% signaling strong profitability
- Favorable PE and PB ratios at 10.48 and 0.93 respectively
- Favorable debt metrics with debt-to-assets at 18.47% and DE at 0.33
- Strong interest coverage ratio at 16.46
- Dividend yield of 4.51%
- Focused upstream segment with consistent revenue
ConocoPhillips Weaknesses
- Unfavorable asset and fixed asset turnover ratios at 0.49 and 0.64
- Neutral ROE and ROIC close to WACC, limiting value creation
- Neutral current ratio at 1.3 indicating moderate liquidity
- Limited innovation indicators available
Diamondback Energy Weaknesses
- Unfavorable ROE at 8.85% below sector average
- Weak liquidity with current ratio at 0.44 and quick ratio at 0.41
- Unfavorable asset and fixed asset turnover ratios at 0.16 and 0.17
- Less diversified revenue streams, mostly upstream services
ConocoPhillips benefits from broad diversification and global reach, balancing profitability with conservative leverage. Diamondback excels in high margins and lean operations but faces liquidity and diversification challenges. Both companies show favorable overall financial health but with distinct strategic profiles.
The Moat Duel: Analyzing Competitive Defensibility
A structural moat is the only reliable shield protecting long-term profits from relentless competitive pressure and market disruption:
ConocoPhillips (COP): Diversified Asset Base with Moderate Value Creation
I see ConocoPhillips’ moat rooted in its broad global footprint and diversified conventional and unconventional assets. This spreads risk and sustains stable margins. Its ROIC exceeds WACC by 2%, signaling value creation despite a recent decline in profitability. Expansion in LNG and tight oil could deepen its moat in 2026, but margin pressures loom.
Diamondback Energy, Inc. (FANG): Focused Permian Basin Cost Advantage
Diamondback’s moat derives from operational efficiency and scale in the Permian Basin, delivering a superior EBIT margin of 43%. Unlike COP, it lacks broad geographic diversification but exhibits accelerating ROIC growth (+122%), indicating improving capital efficiency. Continued expansion of midstream assets and drilling efficiencies could fortify its cost advantage.
Geographic Reach vs. Cost Leadership: Who Holds the Defensive Edge?
ConocoPhillips boasts a wider moat through global diversification and consistent value creation, while Diamondback’s narrower but deepening moat reflects focused cost leadership. COP is better positioned to defend market share against global shocks; FANG’s moat is strengthening but remains geographically concentrated.
Which stock offers better returns?
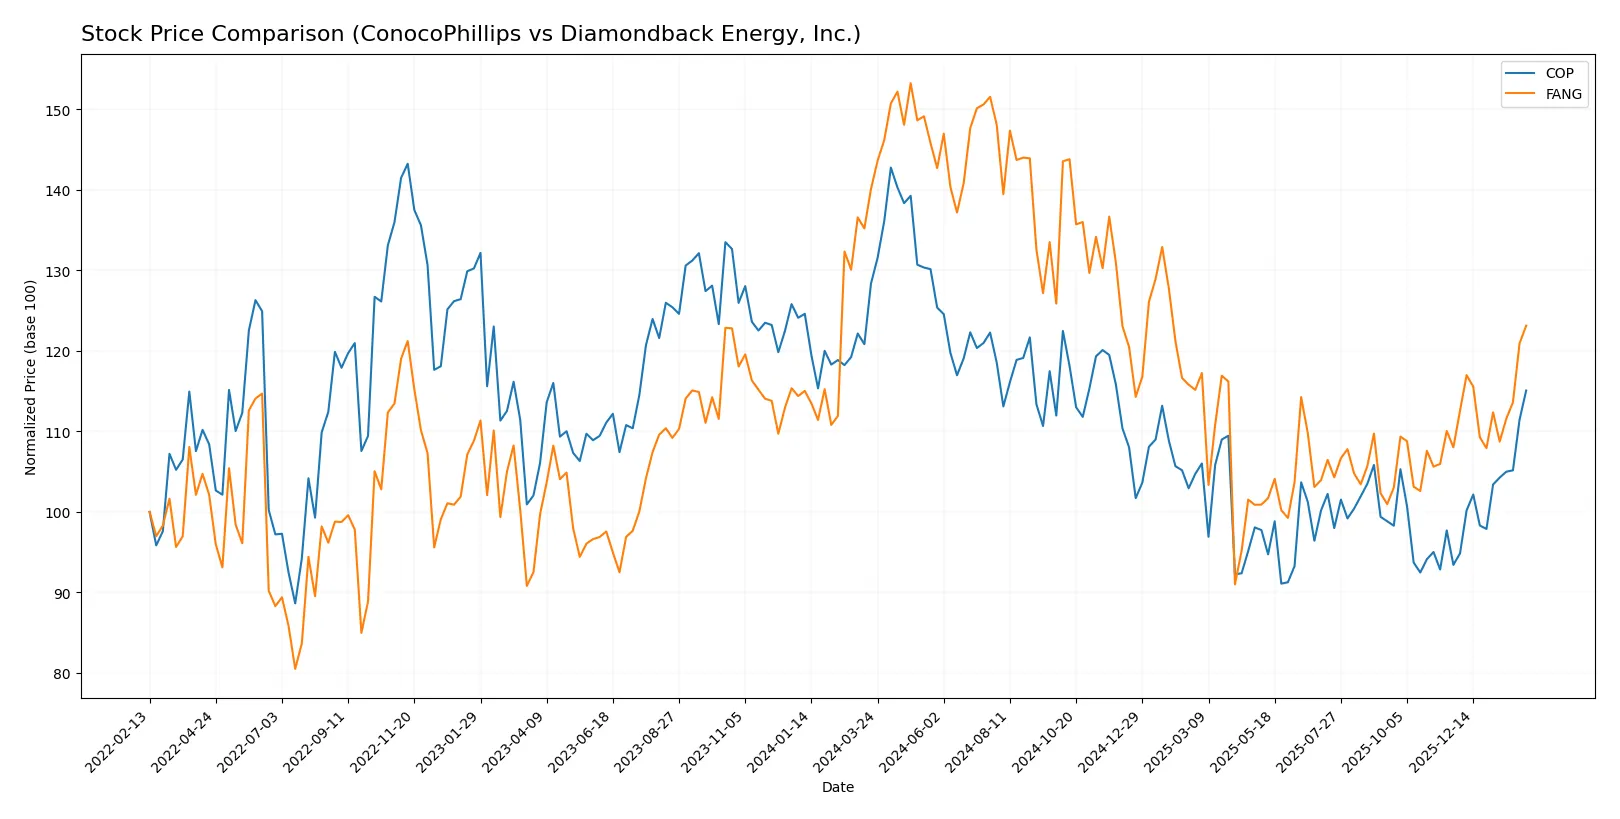
The past year reveals contrasting price movements for ConocoPhillips and Diamondback Energy, with both showing bearish overall trends but notable recent price accelerations.
Trend Comparison
ConocoPhillips’ stock declined 10.35% over the last 12 months, marking a bearish trend with accelerating decline and a high volatility of 11.69. The price ranged between 85.19 and 133.52.
Diamondback Energy’s stock fell 12.11% in the same period, also bearish with accelerating losses and greater volatility at 23.64. Its price fluctuated from 123.37 to 207.76.
Both stocks show recent positive momentum, with ConocoPhillips up 23.18% and Diamondback up 13.99%, but ConocoPhillips delivered the superior market performance overall.
Target Prices
Analysts present a bullish consensus for ConocoPhillips and Diamondback Energy with solid upside potential.
| Company | Target Low | Target High | Consensus |
|---|---|---|---|
| ConocoPhillips | 98 | 133 | 116.07 |
| Diamondback Energy, Inc. | 162 | 218 | 181.77 |
The target consensus for ConocoPhillips is about 8% above the current price of 107.62, indicating moderate upside. Diamondback Energy’s consensus target is roughly 9% above its current 166.93, reflecting positive analyst expectations.

Don’t Let Luck Decide Your Entry Point
Optimize your entry points with our advanced ProRealTime indicators. You’ll get efficient buy signals with precise price targets for maximum performance. Start outperforming now!
How do institutions grade them?
ConocoPhillips Grades
Below is a summary of recent institutional grades for ConocoPhillips.
| Grading Company | Action | New Grade | Date |
|---|---|---|---|
| Wells Fargo | Maintain | Overweight | 2026-02-06 |
| BMO Capital | Maintain | Outperform | 2026-02-06 |
| Piper Sandler | Maintain | Overweight | 2026-02-06 |
| Susquehanna | Maintain | Positive | 2026-01-26 |
| Morgan Stanley | Maintain | Overweight | 2026-01-23 |
| JP Morgan | Downgrade | Neutral | 2026-01-20 |
| B of A Securities | Downgrade | Underperform | 2026-01-16 |
| JP Morgan | Maintain | Overweight | 2026-01-13 |
| Wells Fargo | Upgrade | Overweight | 2026-01-12 |
| Piper Sandler | Maintain | Overweight | 2026-01-08 |
Diamondback Energy, Inc. Grades
Here are the latest institutional grades reported for Diamondback Energy, Inc.
| Grading Company | Action | New Grade | Date |
|---|---|---|---|
| Wells Fargo | Maintain | Overweight | 2024-10-18 |
| Susquehanna | Maintain | Positive | 2024-10-18 |
| Truist Securities | Maintain | Buy | 2024-10-16 |
| Keybanc | Maintain | Overweight | 2024-10-16 |
| Piper Sandler | Maintain | Overweight | 2024-10-15 |
| Scotiabank | Maintain | Sector Outperform | 2024-10-10 |
| BMO Capital | Upgrade | Outperform | 2024-10-04 |
| Benchmark | Maintain | Buy | 2024-10-03 |
| Barclays | Upgrade | Overweight | 2024-10-02 |
| Wells Fargo | Maintain | Overweight | 2024-10-01 |
Which company has the best grades?
ConocoPhillips shows a mix of recent upgrades and downgrades, with some firms lowering ratings to Neutral or Underperform. Diamondback Energy holds consistently positive grades, mostly Overweight and Buy, with several upgrades. Investors may interpret Diamondback’s steadier positive consensus as reflecting stronger near-term confidence.
Risks specific to each company
The following categories identify the critical pressure points and systemic threats facing both firms in the 2026 market environment:
1. Market & Competition
ConocoPhillips
- Diversified global portfolio softens competitive pressure.
Diamondback Energy, Inc.
- Concentrated Permian Basin exposure increases market risk.
2. Capital Structure & Debt
ConocoPhillips
- Low debt-to-equity (0.36) and strong interest coverage (11.99).
Diamondback Energy, Inc.
- Slightly lower leverage (0.33) but weaker liquidity ratios.
3. Stock Volatility
ConocoPhillips
- Low beta (0.29) signals defensive stock profile.
Diamondback Energy, Inc.
- Higher beta (0.58) implies more price volatility.
4. Regulatory & Legal
ConocoPhillips
- Global operations expose to diverse regulatory regimes.
Diamondback Energy, Inc.
- Focused U.S. operations reduce regulatory complexity but increase local risk.
5. Supply Chain & Operations
ConocoPhillips
- Complex global supply chains may face geopolitical and logistical disruptions.
Diamondback Energy, Inc.
- Integrated midstream assets improve operational control but add capital intensity.
6. ESG & Climate Transition
ConocoPhillips
- Broader asset base faces higher ESG scrutiny globally.
Diamondback Energy, Inc.
- Regional focus may ease ESG compliance but limits diversification.
7. Geopolitical Exposure
ConocoPhillips
- Exposure to multiple international markets increases geopolitical risk.
Diamondback Energy, Inc.
- Concentrated U.S. Permian Basin operations lower geopolitical exposure.
Which company shows a better risk-adjusted profile?
ConocoPhillips faces significant geopolitical and regulatory risks but benefits from strong liquidity and low volatility. Diamondback’s concentrated Permian focus heightens operational and market risks, compounded by weak liquidity ratios. ConocoPhillips’ Altman Z-Score in the safe zone at 3.07 contrasts with Diamondback’s distress zone score of 1.48, signaling higher bankruptcy risk for Diamondback. I see ConocoPhillips as the better risk-adjusted choice given its diversified assets, stronger financial stability, and lower stock volatility. Diamondback’s low current ratio (0.44) flags liquidity concerns that amplify its risk profile.
Final Verdict: Which stock to choose?
ConocoPhillips stands out for its robust capital efficiency and consistent value creation, underscored by a ROIC comfortably above its WACC. Its superpower lies in disciplined capital allocation, driving steady free cash flow despite cyclic pressures. The key point of vigilance is its declining ROIC trend, which could signal margin pressures ahead. It fits well within a portfolio geared toward stable, income-oriented growth.
Diamondback Energy’s strategic moat emerges from its impressive net margins and accelerating profitability, reflecting operational leverage in a volatile sector. It offers a more dynamic growth profile but carries higher liquidity risk, as evidenced by weaker current ratios. This makes it suitable for investors seeking growth at a reasonable price with a tolerance for greater volatility relative to ConocoPhillips.
If you prioritize resilient cash generation and a proven track record of value creation, ConocoPhillips is the compelling choice due to its superior financial stability and dividend yield. However, if you seek higher growth potential and can absorb liquidity risk, Diamondback Energy offers better upside with its improving profitability and expanding ROIC trend. Both warrant close monitoring of sector cyclicality and balance sheet health.
Disclaimer: Investment carries a risk of loss of initial capital. The past performance is not a reliable indicator of future results. Be sure to understand risks before making an investment decision.
Go Further
I encourage you to read the complete analyses of ConocoPhillips and Diamondback Energy, Inc. to enhance your investment decisions: