Home > Comparison > Energy > COP vs DVN
The strategic rivalry between ConocoPhillips and Devon Energy defines the current trajectory of the oil and gas exploration sector. ConocoPhillips operates as a global energy giant with diversified conventional and unconventional assets. Devon Energy focuses on U.S.-based, independent exploration and production with a leaner operational footprint. This analysis assesses which company’s strategic path offers superior risk-adjusted returns for a diversified energy portfolio in 2026.
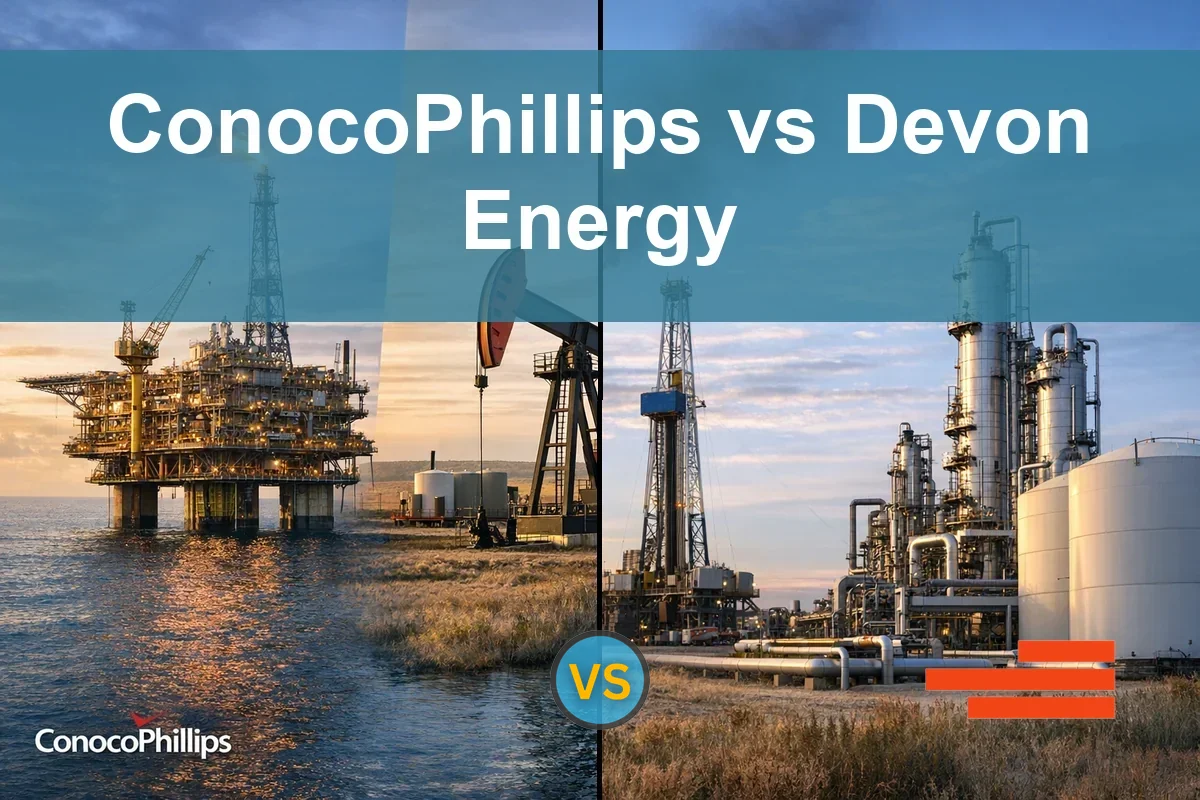
Table of contents
Companies Overview
ConocoPhillips and Devon Energy Corporation are pivotal players shaping the US oil and gas exploration landscape.
ConocoPhillips: Global Energy Giant
ConocoPhillips stands as a global leader in oil and gas exploration. Its core revenue derives from producing and marketing crude oil, LNG, natural gas, and liquids worldwide. In 2026, the company focuses strategically on balancing conventional and unconventional assets across North America, Europe, Asia, and Australia, leveraging its diverse portfolio to optimize production and market reach.
Devon Energy Corporation: US Independent Producer
Devon Energy operates as a dominant independent in the US oil and gas sector. It generates revenue mainly through exploration, development, and production of oil, natural gas, and liquids across 5,134 gross wells. The company’s 2026 strategy centers on maximizing output efficiency within the US, emphasizing operational discipline and asset optimization in its domestic footprint.
Strategic Collision: Similarities & Divergences
Both firms compete fiercely in oil and gas exploration but diverge in scale and scope. ConocoPhillips pursues a global diversified portfolio while Devon Energy emphasizes a focused, domestic approach. Their primary battleground lies in production efficiency and resource allocation. Consequently, their investment profiles differ: one offers broad exposure and scale, the other targets concentrated operational leverage.
Income Statement Comparison
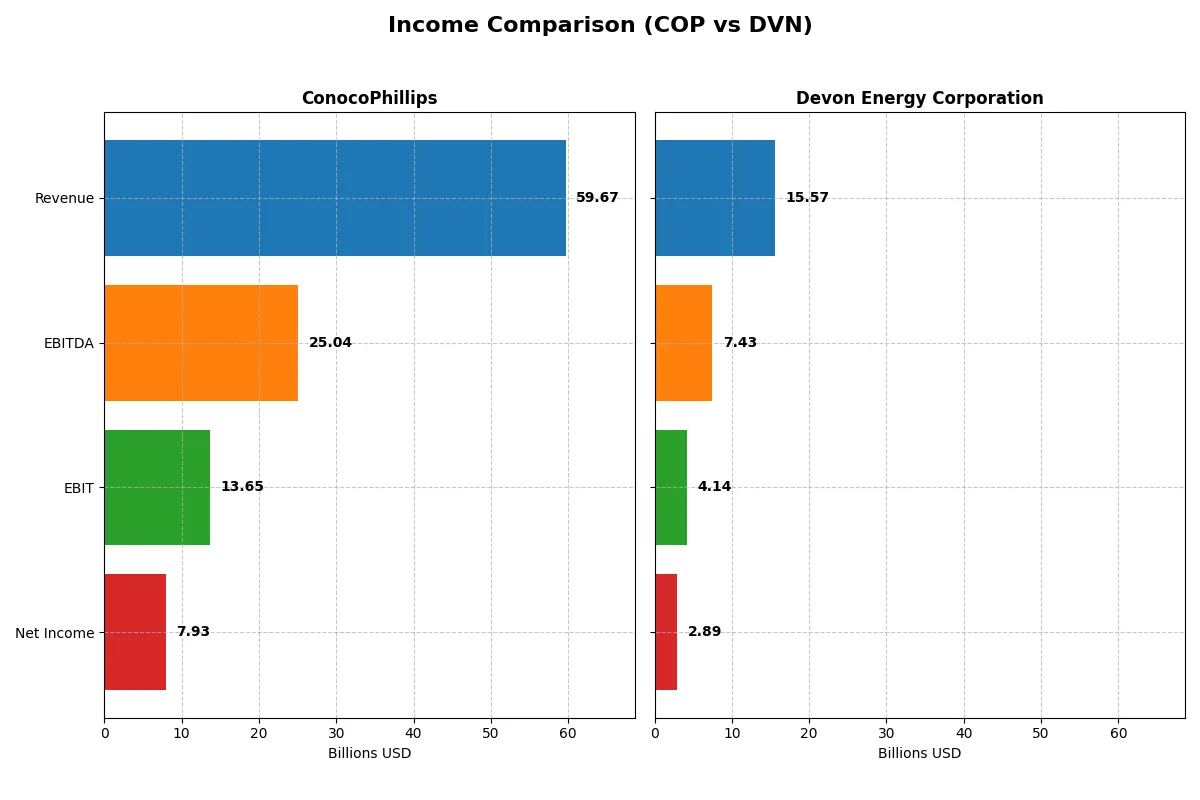
This table dissects the core profitability and scalability of both corporate engines to reveal who dominates the bottom line:
| Metric | ConocoPhillips (COP) | Devon Energy Corporation (DVN) |
|---|---|---|
| Revenue | 59.7B | 15.6B |
| Cost of Revenue | 38.7B | 11.3B |
| Operating Expenses | 9.1B | 0.5B |
| Gross Profit | 21.0B | 4.3B |
| EBITDA | 25.0B | 7.4B |
| EBIT | 13.7B | 4.1B |
| Interest Expense | 1.1B | 0.4B |
| Net Income | 7.9B | 2.9B |
| EPS | 6.34 | 4.57 |
| Fiscal Year | 2025 | 2024 |
Income Statement Analysis: The Bottom-Line Duel
This income statement comparison reveals which company converts revenue into profit with greater efficiency and sustainable momentum.
ConocoPhillips Analysis
ConocoPhillips posted steady revenue growth from $46B in 2021 to $59.7B in 2025, though net income declined from $18.6B in 2022 to $7.9B in 2025. The company maintains strong gross and net margins at 35.2% and 13.3%, respectively. However, a 7.6% drop in EBIT and 21.3% net margin contraction in the latest year signal margin pressures despite top-line growth.
Devon Energy Corporation Analysis
Devon Energy’s revenue grew from $4.4B in 2020 to $15.6B in 2024, with net income rising sharply from negative $2.7B in 2020 to $2.9B in 2024. Gross and net margins stand at 27.4% and 18.6%, respectively, reflecting improved cost control. Despite a 17% EBIT decline and 25% net margin drop in 2024, the company’s overall five-year net income growth exceeds 200%, showcasing strong recovery and operational leverage.
Margin Strength vs. Growth Resilience
ConocoPhillips delivers superior margins but faces recent margin and net income erosion. Devon Energy shows remarkable net income and margin growth over five years, despite short-term dips. The fundamental winner depends on investor preference for stable margin power or aggressive growth momentum. I find Devon’s recovery profile more attractive for growth-oriented investors.
Financial Ratios Comparison
These vital ratios act as a diagnostic tool to expose the underlying fiscal health, valuation premiums, and capital efficiency of the companies compared:
| Ratios | ConocoPhillips (COP) | Devon Energy Corporation (DVN) |
|---|---|---|
| ROE | 12.3% | 19.9% |
| ROIC | 6.9% | 10.8% |
| P/E | 14.1 | 7.1 |
| P/B | 1.74 | 1.41 |
| Current Ratio | 1.30 | 1.04 |
| Quick Ratio | 1.14 | 0.95 |
| D/E | 0.36 | 0.63 |
| Debt-to-Assets | 19.2% | 30.2% |
| Interest Coverage | 10.4 | 9.4 |
| Asset Turnover | 0.49 | 0.51 |
| Fixed Asset Turnover | 0.64 | 0.61 |
| Payout Ratio | 50.4% | 32.4% |
| Dividend Yield | 3.57% | 4.60% |
| Fiscal Year | 2025 | 2024 |
Efficiency & Valuation Duel: The Vital Signs
Financial ratios act as the company’s DNA, exposing hidden risks and operational strengths critical for investment decisions. They decode profitability, valuation, and capital efficiency in a compact snapshot.
ConocoPhillips
ConocoPhillips delivers a solid 12.3% ROE and a favorable 13.3% net margin, signaling consistent profitability. Its P/E of 14.13 suggests a fairly valued stock, neither stretched nor cheap. The company returns value via a 3.57% dividend yield, balancing shareholder payouts with prudent reinvestment in stable operations.
Devon Energy Corporation
Devon Energy impresses with a robust 19.9% ROE and a strong 18.6% net margin, reflecting superior profitability. Its P/E of 7.05 marks the stock as attractively priced. Devon offers a higher 4.6% dividend yield, indicating aggressive shareholder returns alongside efficient capital allocation.
Balanced Profitability Meets Compelling Valuation
Both companies present favorable ratio profiles, but Devon Energy pairs higher profitability with a more attractive valuation and dividend yield. ConocoPhillips offers steadiness and moderate returns. Investors favoring growth and yield might lean towards Devon, while those seeking stability may prefer ConocoPhillips.
Which one offers the Superior Shareholder Reward?
I see ConocoPhillips (COP) balances dividends and buybacks more sustainably than Devon Energy (DVN). COP yields ~3.6% with a 50% payout ratio, backed by strong free cash flow coverage (2.8x). Its buyback program is robust, enhancing total returns. DVN offers higher yield (~4.6%) but free cash flow is negative, signaling dividend risk and weaker buyback capacity. COP’s disciplined capital allocation and healthier coverage ratios make it the superior choice for long-term shareholder reward in 2026.
Comparative Score Analysis: The Strategic Profile
The radar chart reveals the fundamental DNA and trade-offs of ConocoPhillips and Devon Energy Corporation, highlighting their financial strengths and valuation nuances:
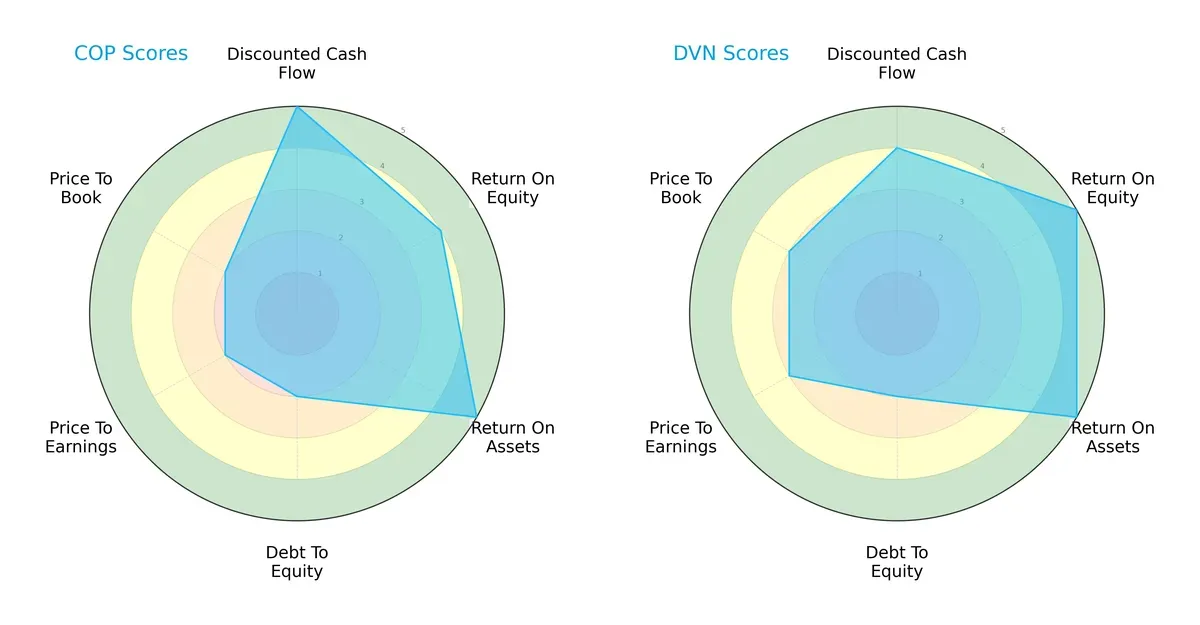
ConocoPhillips excels in discounted cash flow and asset efficiency (DCF 5, ROA 5) but struggles with leverage and valuation (Debt/Equity 2, P/E 2, P/B 2). Devon Energy offers a more balanced profile with strong profitability (ROE 5, ROA 5) and moderately better valuation metrics (P/E 3, P/B 3). Devon leans on operational efficiency, while ConocoPhillips depends on cash flow strength but faces valuation headwinds.
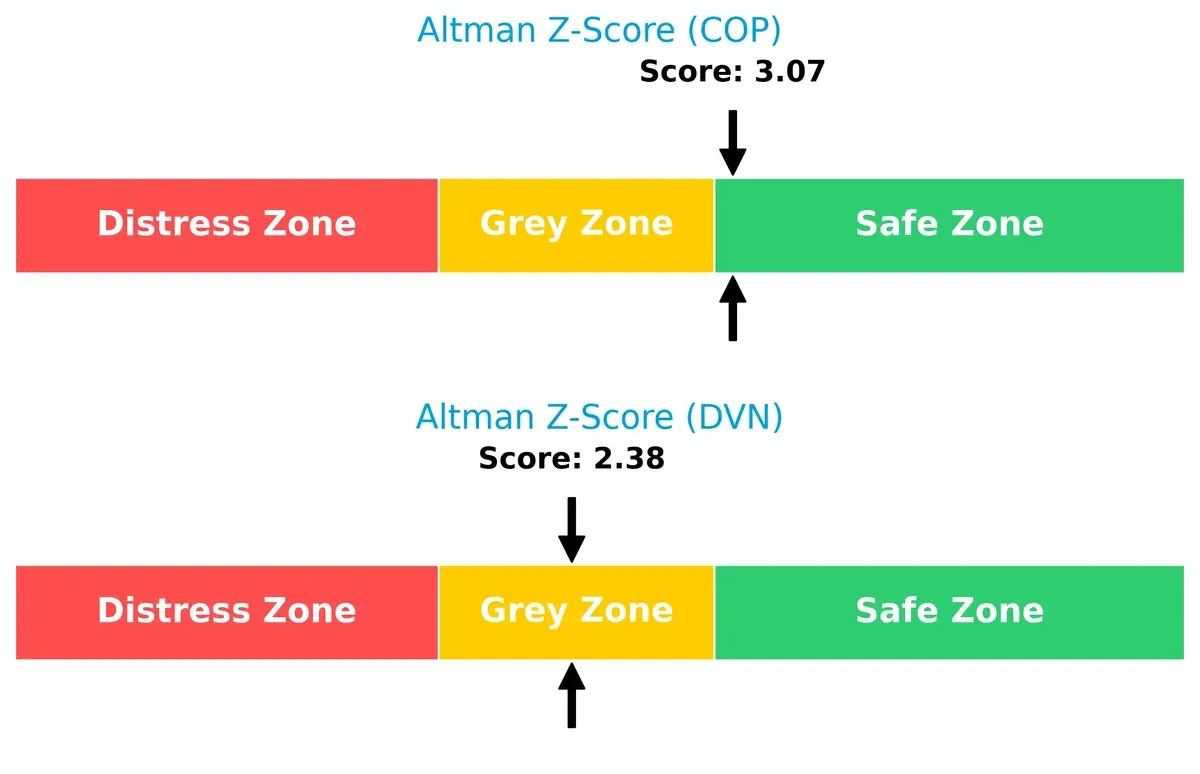
Bankruptcy Risk: Solvency Showdown
ConocoPhillips’ Altman Z-Score of 3.07 places it securely in the safe zone, signaling strong solvency. Devon Energy’s 2.38 score lands in the grey zone, indicating moderate bankruptcy risk and caution is warranted:
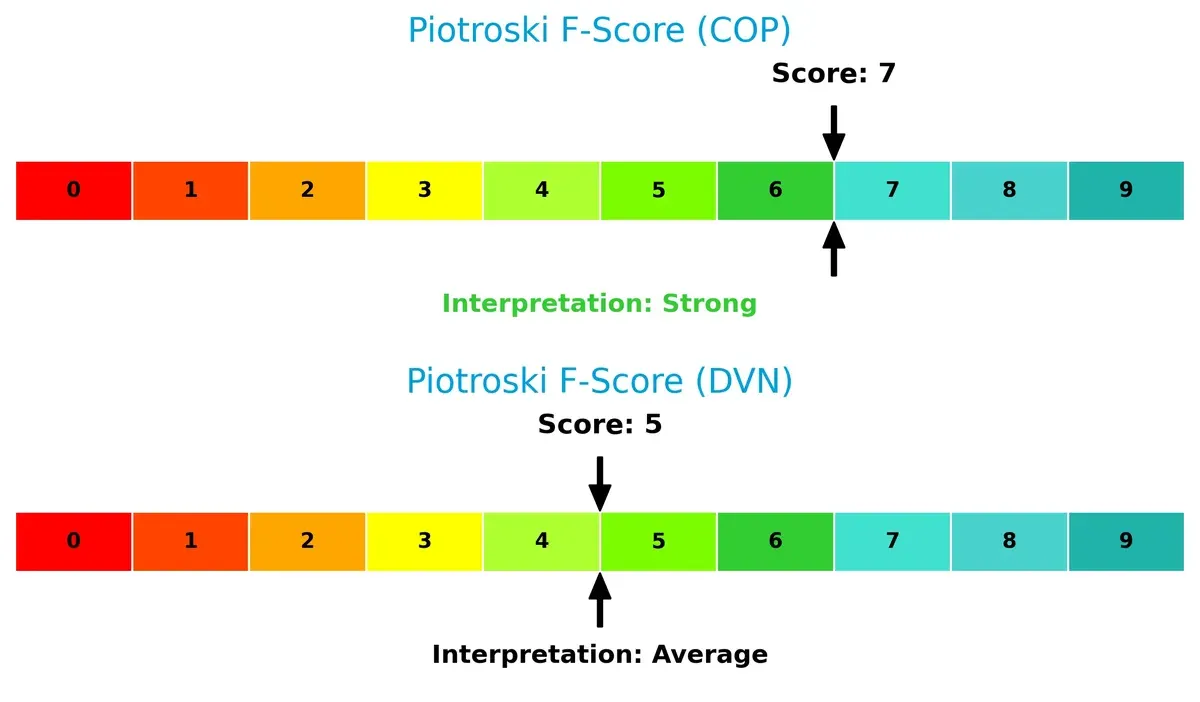
Financial Health: Quality of Operations
ConocoPhillips scores a robust 7 on the Piotroski F-Score, reflecting solid financial health and operational quality. Devon Energy’s 5 signals average strength, with potential red flags in internal metrics compared to its peer:
How are the two companies positioned?
This section dissects the operational DNA of ConocoPhillips and Devon Energy by comparing their revenue distribution and internal strengths and weaknesses. The goal is to confront their economic moats to identify which model offers the most resilient, sustainable advantage today.
Revenue Segmentation: The Strategic Mix
This visual comparison dissects how ConocoPhillips and Devon Energy diversify their income streams and reveals their primary sector bets:
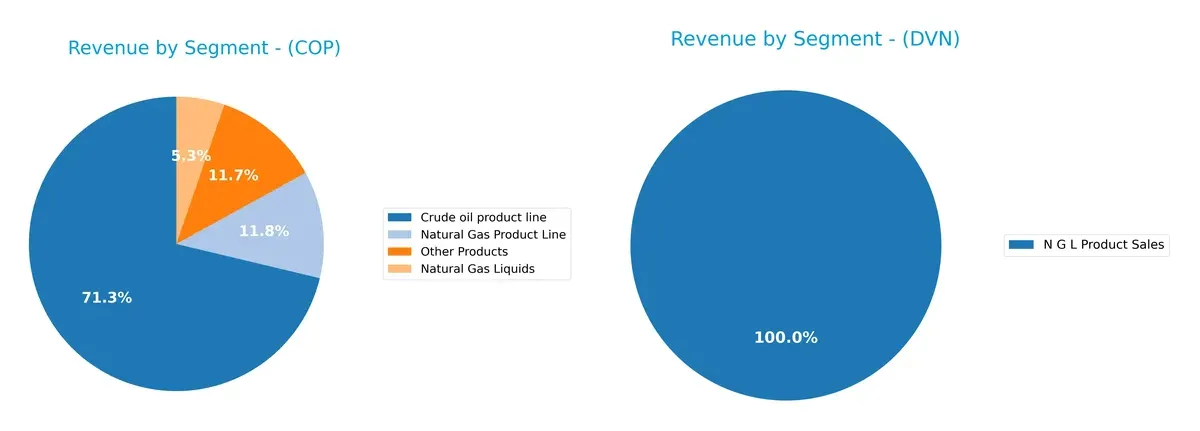
ConocoPhillips anchors revenue in crude oil, generating $39B in 2024, complemented by $6.4B from other products and $6.4B from natural gas. Devon Energy pivots almost entirely on $11.2B from NGL product sales in 2024. ConocoPhillips shows more diversification across hydrocarbons, lowering concentration risk. Devon’s reliance on a single segment increases exposure but may reflect focused operational efficiency in natural gas liquids.
Strengths and Weaknesses Comparison
This table compares the Strengths and Weaknesses of ConocoPhillips and Devon Energy Corporation:
ConocoPhillips Strengths
- Diversified product lines across crude oil, natural gas, liquids, and other products
- Favorable net margin at 13.29%
- Strong interest coverage ratio at 11.99
- Favorable debt-to-assets ratio at 19.23%
- Global presence including Canada, UK, Norway, China, Libya, Malaysia
- Consistent dividend yield of 3.57%
Devon Energy Corporation Strengths
- Higher net margin at 18.57% and ROE of 19.94% indicating superior profitability
- Favorable ROIC at 10.8% above WACC
- Lower P/E ratio at 7.05 suggesting valuation appeal
- Favorable price-to-book at 1.41
- Sizable NGL product sales of $11.2B
- Dividend yield of 4.6% with favorable interest coverage
ConocoPhillips Weaknesses
- Unfavorable asset and fixed asset turnover ratios indicate lower operational efficiency
- Neutral ROE and ROIC close to WACC limit value creation
- Neutral current and quick ratios highlight moderate liquidity
- Lower P/E relative to peers could signal slower growth expectations
Devon Energy Corporation Weaknesses
- Higher debt-to-assets ratio at 30.18% may increase financial risk
- Neutral debt/equity ratio at 0.63 suggests leverage concerns
- Quick ratio below 1.0 signals lower short-term liquidity buffer
- Limited geographic diversification mainly focused on North America
Both companies show favorable overall financial health with distinct strategic profiles. ConocoPhillips leverages global diversification and capital structure strength. Devon Energy emphasizes higher profitability and operational returns but faces liquidity and leverage challenges. These factors shape their competitive positioning and capital allocation priorities.
The Moat Duel: Analyzing Competitive Defensibility
A structural moat is the only fortress protecting long-term profits from relentless competition erosion. Let’s dissect the economic moats of two leading energy producers:
ConocoPhillips: Diversified Asset Base Moat
ConocoPhillips leverages a broad geographic footprint and diversified resource base, supporting stable margins and a 2% ROIC premium over WACC. However, its declining ROIC signals margin pressures heading into 2026.
Devon Energy Corporation: Operational Efficiency Moat
Devon Energy relies on a high ROIC gap of nearly 5% above WACC, fueled by operational efficiency and lean asset management. Its improving ROIC trend points to a strengthening moat and growth opportunities in U.S. shale plays.
Geographic Reach vs. Operational Excellence: Which Moat Holds Stronger?
Devon’s growing ROIC and efficient capital use create a deeper moat compared to ConocoPhillips’ broader but margin-pressured portfolio. Devon is better positioned to defend market share amid evolving energy dynamics.
Which stock offers better returns?
Over the past 12 months, both ConocoPhillips and Devon Energy Corporation experienced overall bearish trends, with recent months showing strong bullish recoveries and accelerating price momentum.
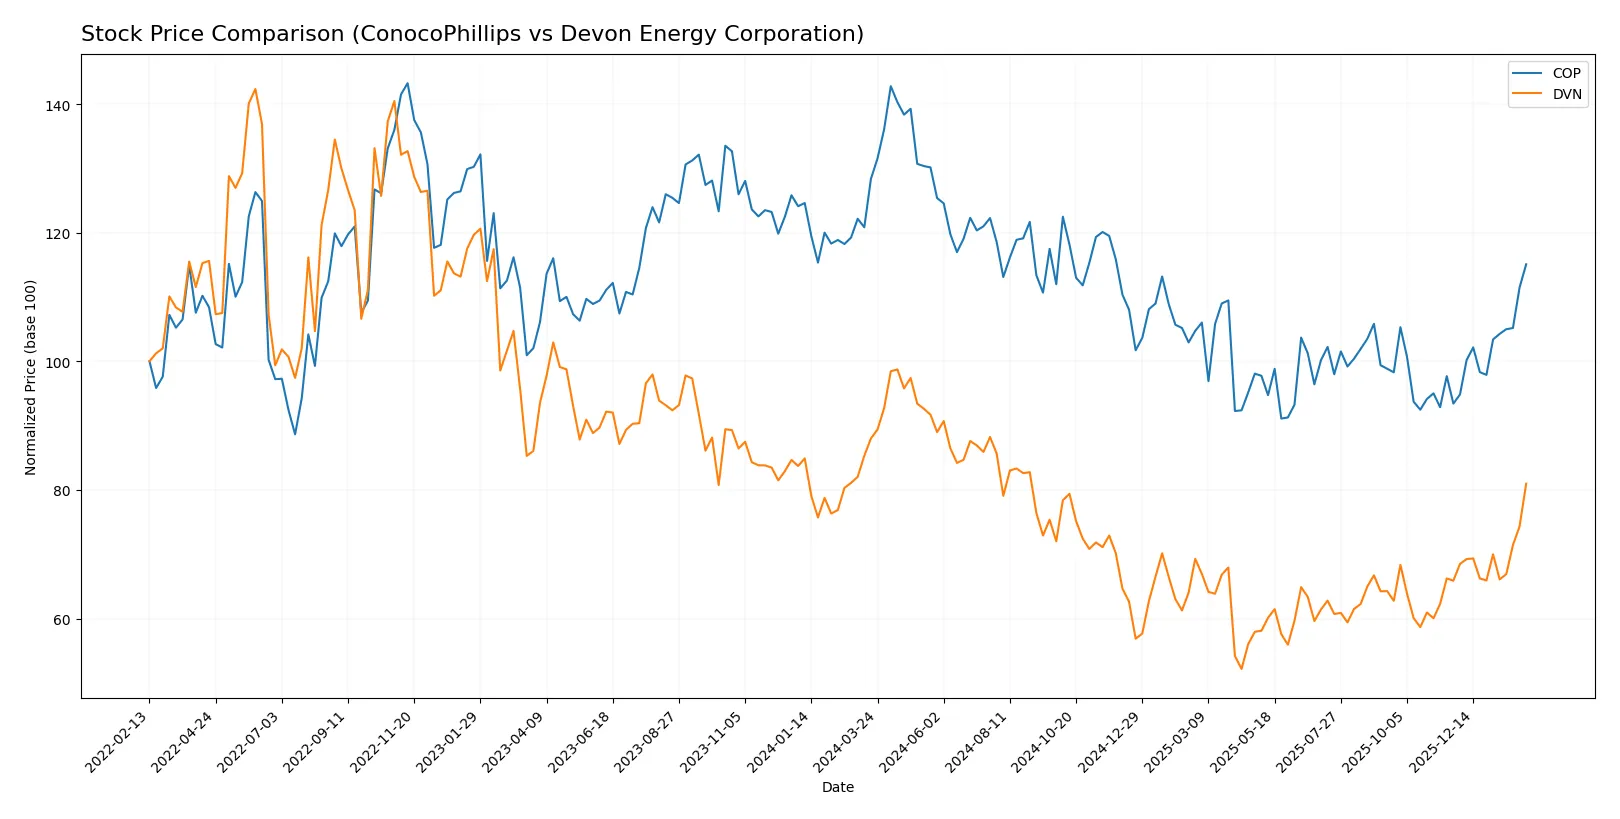
Trend Comparison
ConocoPhillips’ stock declined 10.35% over the past year, marking a bearish trend with accelerating downward momentum. It hit a high of 133.52 and a low of 85.19, reflecting elevated volatility with an 11.69 standard deviation.
Devon Energy’s stock fell 8.0% over the same period, also bearish with accelerating decline. Its price ranged between 53.42 and 28.23, showing lower volatility at a 6.32 standard deviation.
Both stocks reversed recent losses with 23.18% (COP) and 22.89% (DVN) gains since November 2025. ConocoPhillips slightly outperformed Devon Energy in recent market recovery and overall price movement.
Target Prices
Analysts present a cautiously optimistic consensus for ConocoPhillips and Devon Energy.
| Company | Target Low | Target High | Consensus |
|---|---|---|---|
| ConocoPhillips | 98 | 133 | 116.07 |
| Devon Energy Corporation | 42 | 51 | 45.6 |
ConocoPhillips’ consensus target price sits about 8% above its current price of $107.62, indicating moderate upside potential. Devon Energy’s target consensus similarly suggests a slight gain from its current $43.81, reflecting steady analyst confidence.

Don’t Let Luck Decide Your Entry Point
Optimize your entry points with our advanced ProRealTime indicators. You’ll get efficient buy signals with precise price targets for maximum performance. Start outperforming now!
How do institutions grade them?
ConocoPhillips Grades
Below is a summary of recent institutional grades for ConocoPhillips.
| Grading Company | Action | New Grade | Date |
|---|---|---|---|
| Wells Fargo | Maintain | Overweight | 2026-02-06 |
| BMO Capital | Maintain | Outperform | 2026-02-06 |
| Piper Sandler | Maintain | Overweight | 2026-02-06 |
| Susquehanna | Maintain | Positive | 2026-01-26 |
| Morgan Stanley | Maintain | Overweight | 2026-01-23 |
| JP Morgan | Downgrade | Neutral | 2026-01-20 |
| B of A Securities | Downgrade | Underperform | 2026-01-16 |
| JP Morgan | Maintain | Overweight | 2026-01-13 |
| Wells Fargo | Upgrade | Overweight | 2026-01-12 |
| Piper Sandler | Maintain | Overweight | 2026-01-08 |
Devon Energy Corporation Grades
Below is a summary of recent institutional grades for Devon Energy Corporation.
| Grading Company | Action | New Grade | Date |
|---|---|---|---|
| Barclays | Upgrade | Overweight | 2026-02-04 |
| Scotiabank | Maintain | Sector Perform | 2026-02-03 |
| Susquehanna | Maintain | Positive | 2026-02-03 |
| Wells Fargo | Maintain | Overweight | 2026-01-27 |
| Susquehanna | Maintain | Positive | 2026-01-26 |
| Morgan Stanley | Maintain | Overweight | 2026-01-23 |
| Barclays | Maintain | Equal Weight | 2026-01-21 |
| Scotiabank | Downgrade | Sector Perform | 2026-01-16 |
| Bernstein | Maintain | Outperform | 2026-01-05 |
| Roth Capital | Maintain | Buy | 2025-12-31 |
Which company has the best grades?
ConocoPhillips shows consistent Overweight and Outperform grades, though with notable recent downgrades. Devon Energy also holds mostly Overweight and Positive ratings, with fewer downgrades. Investors may view ConocoPhillips’ mixed signals as higher risk, while Devon’s steadier trend suggests cautious optimism.
Risks specific to each company
The following categories identify the critical pressure points and systemic threats facing both firms in the 2026 market environment:
1. Market & Competition
ConocoPhillips
- Diversified global portfolio reduces competitive pressure.
Devon Energy Corporation
- Focused US operations limit market reach but concentrate expertise.
2. Capital Structure & Debt
ConocoPhillips
- Lower debt-to-equity ratio (0.36), signaling conservative leverage.
Devon Energy Corporation
- Higher debt ratio (0.63) increases financial risk amid volatility.
3. Stock Volatility
ConocoPhillips
- Beta of 0.29 indicates low stock volatility and defensive traits.
Devon Energy Corporation
- Beta of 0.63 shows moderate volatility, reflecting cyclical sensitivity.
4. Regulatory & Legal
ConocoPhillips
- Exposure to multiple jurisdictions increases regulatory complexity.
Devon Energy Corporation
- Primarily US-focused, facing concentrated but stable regulatory risks.
5. Supply Chain & Operations
ConocoPhillips
- Complex global supply chain vulnerable to geopolitical disruptions.
Devon Energy Corporation
- More streamlined domestic operations reduce supply chain risks.
6. ESG & Climate Transition
ConocoPhillips
- Larger carbon footprint poses transition risk but drives innovation.
Devon Energy Corporation
- Smaller scale eases ESG compliance but may limit green investments.
7. Geopolitical Exposure
ConocoPhillips
- Operations in diverse regions increase geopolitical risk.
Devon Energy Corporation
- US-only footprint limits exposure but also growth opportunities.
Which company shows a better risk-adjusted profile?
ConocoPhillips faces significant geopolitical and regulatory complexity but boasts stronger balance sheet metrics and lower stock volatility. Devon Energy shows higher financial leverage and stock volatility but benefits from focused operations and robust profitability ratios. The most impactful risk for ConocoPhillips is geopolitical exposure; for Devon Energy, it is capital structure risk. Given its stronger liquidity, lower beta, and safe-zone Altman Z-Score (3.07), ConocoPhillips offers a better risk-adjusted profile despite operational scale risks. Devon’s higher debt and grey-zone bankruptcy risk (Altman Z-Score 2.38) raise caution, especially amid market uncertainties.
Final Verdict: Which stock to choose?
ConocoPhillips (COP) stands out as a cash-generating powerhouse with a solid value creation moat, consistently producing returns above its capital cost. Its point of vigilance lies in a slightly declining profitability trend and modest asset turnover, requiring close monitoring. COP suits portfolios aiming for steady income with moderate growth.
Devon Energy Corporation (DVN) boasts a robust and growing moat, marked by superior return on invested capital relative to its cost and a strong earnings yield. Its strategic advantage lies in operational efficiency and improving profitability, offering better stability than COP. DVN fits well with investors seeking growth at a reasonable price (GARP).
If you prioritize resilient cash flow and dividend income, ConocoPhillips is the compelling choice due to its reliable capital allocation and income profile. However, if you seek a dynamic growth opportunity with expanding profitability and operational leverage, Devon Energy offers better stability and a stronger moat. Both demand vigilant risk assessment amid sector cyclicality.
Disclaimer: Investment carries a risk of loss of initial capital. The past performance is not a reliable indicator of future results. Be sure to understand risks before making an investment decision.
Go Further
I encourage you to read the complete analyses of ConocoPhillips and Devon Energy Corporation to enhance your investment decisions: