Home > Comparison > Energy > COP vs CTRA
The strategic rivalry between ConocoPhillips and Coterra Energy shapes the Energy sector’s exploration and production landscape. ConocoPhillips operates as a global, diversified oil and gas giant with a broad asset base, while Coterra Energy focuses on U.S.-centric natural gas and liquids development with a leaner operational model. This analysis examines their contrasting approaches to capital allocation and growth, aiming to identify which offers superior risk-adjusted prospects for a balanced portfolio.
Table of contents
Companies Overview
ConocoPhillips and Coterra Energy stand as key players in the U.S. oil and gas sector, shaping energy supply dynamics.
ConocoPhillips: Global Oil & Gas Giant
ConocoPhillips dominates as a global explorer and producer of crude oil, natural gas, and LNG. It generates revenue through diversified operations spanning conventional and unconventional assets worldwide. The company’s 2026 strategy emphasizes leveraging its broad portfolio, including shale, oil sands, and LNG developments, to optimize production and cash flow stability.
Coterra Energy Inc.: Focused U.S. Producer
Coterra Energy operates as an independent U.S. oil and gas developer, focusing on natural gas and liquids from its Marcellus Shale, Permian, and Anadarko Basin assets. Its revenue model centers on selling natural gas to industrial and pipeline customers. In 2026, Coterra targets operational efficiency and asset optimization to strengthen its foothold in key domestic basins.
Strategic Collision: Similarities & Divergences
Both companies revolve around oil and gas exploration and production but differ in scope and scale. ConocoPhillips pursues a diversified global portfolio, while Coterra adopts a concentrated U.S.-focused approach. Their primary battleground lies in natural gas and liquids production efficiency. Investors encounter contrasting profiles: ConocoPhillips offers scale and diversification; Coterra presents nimbleness and regional specialization.
Income Statement Comparison
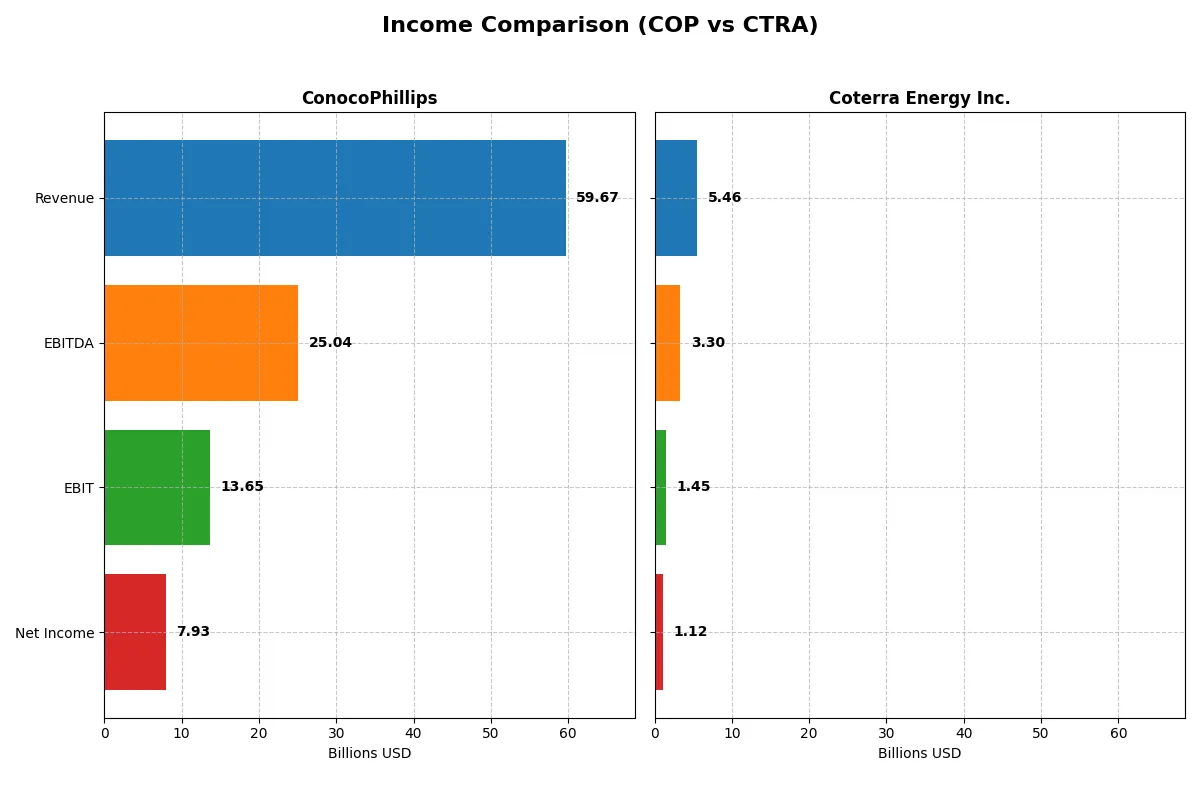
This data dissects the core profitability and scalability of both corporate engines to reveal who dominates the bottom line:
| Metric | ConocoPhillips (COP) | Coterra Energy Inc. (CTRA) |
|---|---|---|
| Revenue | 59.7B | 5.46B |
| Cost of Revenue | 38.7B | 3.77B |
| Operating Expenses | 9.13B | 302M |
| Gross Profit | 21.0B | 1.69B |
| EBITDA | 25.0B | 3.30B |
| EBIT | 13.7B | 1.45B |
| Interest Expense | 1.14B | 106M |
| Net Income | 7.93B | 1.12B |
| EPS | 6.34 | 1.51 |
| Fiscal Year | 2025 | 2024 |
Income Statement Analysis: The Bottom-Line Duel
This income statement comparison highlights which company converts revenue into profits most efficiently over recent years.
ConocoPhillips Analysis
ConocoPhillips shows solid revenue growth, rising nearly 30% from 2021 to 2025, with 2025 revenue at $59.7B. Net income declined slightly overall, with $7.9B in 2025, reflecting margin pressure. Its 35.1% gross margin and 13.3% net margin remain favorable, although net margin contracted 21% in the last year, signalling tightening profitability despite growing top-line.
Coterra Energy Inc. Analysis
Coterra’s revenue grew dramatically over the 2020–2024 period, surging 289% to $5.46B in 2024, but dipped 3.9% from 2023 to 2024. Net income expanded even faster, up 459% overall, with $1.12B in 2024. Its 31.0% gross margin and strong 20.5% net margin reflect efficient cost management, though earnings and margins declined sharply last year, indicating some momentum loss.
Margin Strength vs. Growth Momentum
ConocoPhillips delivers robust scale and maintains strong gross and net margins, despite recent margin erosion. Coterra outpaces on revenue and net income growth, boasting higher net margins but faces sharper recent declines. For investors, ConocoPhillips offers steadier profitability while Coterra presents a higher-growth but more volatile earnings profile.
Financial Ratios Comparison
These vital ratios act as a diagnostic tool to expose the underlying fiscal health, valuation premiums, and capital efficiency of the companies analyzed below:
| Ratios | ConocoPhillips (COP) | Coterra Energy Inc. (CTRA) |
|---|---|---|
| ROE | 12.3% | 8.5% |
| ROIC | 6.9% | 5.6% |
| P/E | 14.1x | 16.9x |
| P/B | 1.74x | 1.44x |
| Current Ratio | 1.30 | 2.92 |
| Quick Ratio | 1.14 | 2.88 |
| D/E | 0.36 | 0.29 |
| Debt-to-Assets | 19.2% | 17.6% |
| Interest Coverage | 10.4x | 13.1x |
| Asset Turnover | 0.49 | 0.25 |
| Fixed Asset Turnover | 0.64 | 0.30 |
| Payout Ratio | 50.4% | 55.8% |
| Dividend Yield | 3.57% | 3.30% |
| Fiscal Year | 2025 | 2024 |
Efficiency & Valuation Duel: The Vital Signs
Financial ratios act as a company’s DNA, unveiling hidden risks and operational excellence that drive investment decisions.
ConocoPhillips
ConocoPhillips shows solid profitability with a 12.3% ROE and a strong 13.3% net margin, signaling efficient core operations. Its P/E of 14.13 suggests a favorable valuation, neither expensive nor cheap. The 3.57% dividend yield underscores shareholder returns, reflecting a balanced capital allocation between dividends and steady reinvestment.
Coterra Energy Inc.
Coterra displays a robust 20.5% net margin but a lower 8.5% ROE, indicating mixed profitability signals. Its P/E of 16.91 is fair but slightly stretched relative to peers. The 3.3% dividend yield provides consistent income, while a high current ratio of 2.92 highlights strong liquidity, supporting operational resilience.
Balanced Profitability Meets Liquidity Edge
ConocoPhillips offers a better risk-reward balance with a stronger ROE and attractive valuation metrics. Coterra’s superior margins and liquidity suit investors prioritizing operational safety but at a higher valuation. Risk-tolerant investors may prefer ConocoPhillips’ efficient capital deployment and steadier returns.
Which one offers the Superior Shareholder Reward?
I find ConocoPhillips (COP) delivers a more balanced shareholder reward than Coterra Energy (CTRA) in 2026. COP pays a solid 3.57% dividend yield with a sustainable 50% payout ratio and covers dividends well with strong free cash flow (14B FCF, payout ratio 0.50). Its aggressive share buybacks add significant total return. CTRA offers a slightly higher 3.30% yield but with a higher 56% payout ratio and weaker free cash flow coverage, signaling less dividend sustainability. CTRA’s buyback program is modest by comparison. Historically in energy sectors, COP’s disciplined capital allocation and buyback intensity create superior long-term value. I conclude COP offers a more attractive total return profile for prudent investors in 2026.
Comparative Score Analysis: The Strategic Profile
The radar chart reveals the fundamental DNA and trade-offs of ConocoPhillips and Coterra Energy Inc., highlighting their financial strengths and valuation nuances:
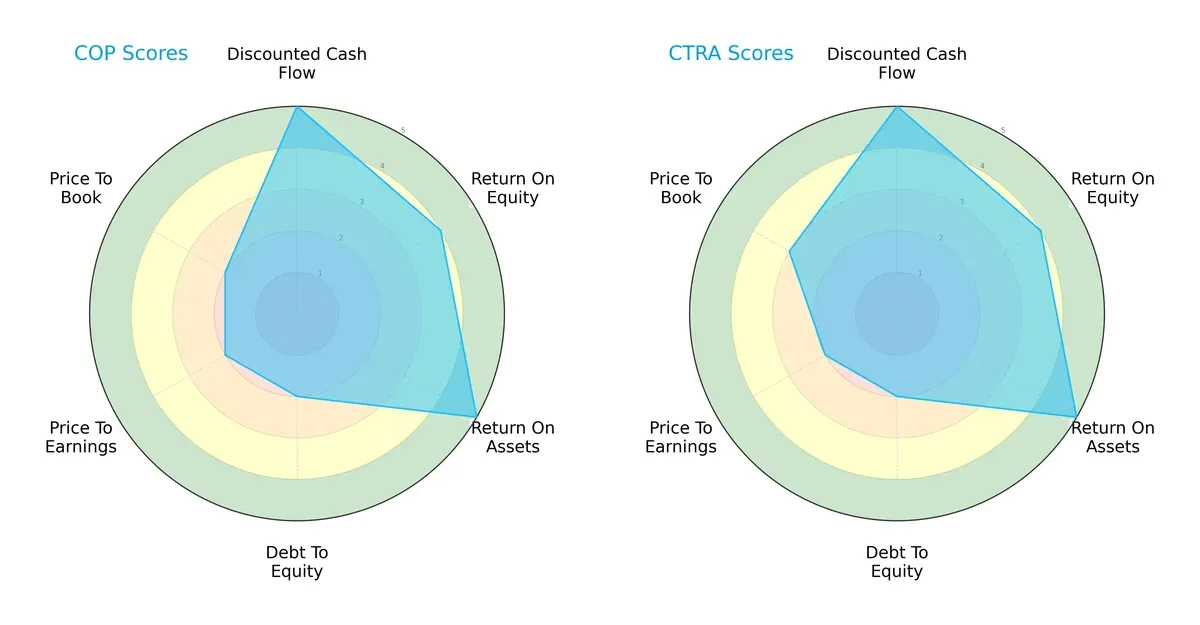
Both firms share identical top scores in discounted cash flow (5), return on equity (4), and return on assets (5), signaling robust profitability and asset efficiency. However, both struggle with debt-to-equity (2) and price-to-earnings (2) ratios, reflecting higher leverage and less attractive valuation metrics. Coterra edges out slightly on price-to-book (3 vs. 2), suggesting a marginally better market valuation relative to book value. Overall, ConocoPhillips and Coterra display balanced profiles, with neither relying on a single financial edge.
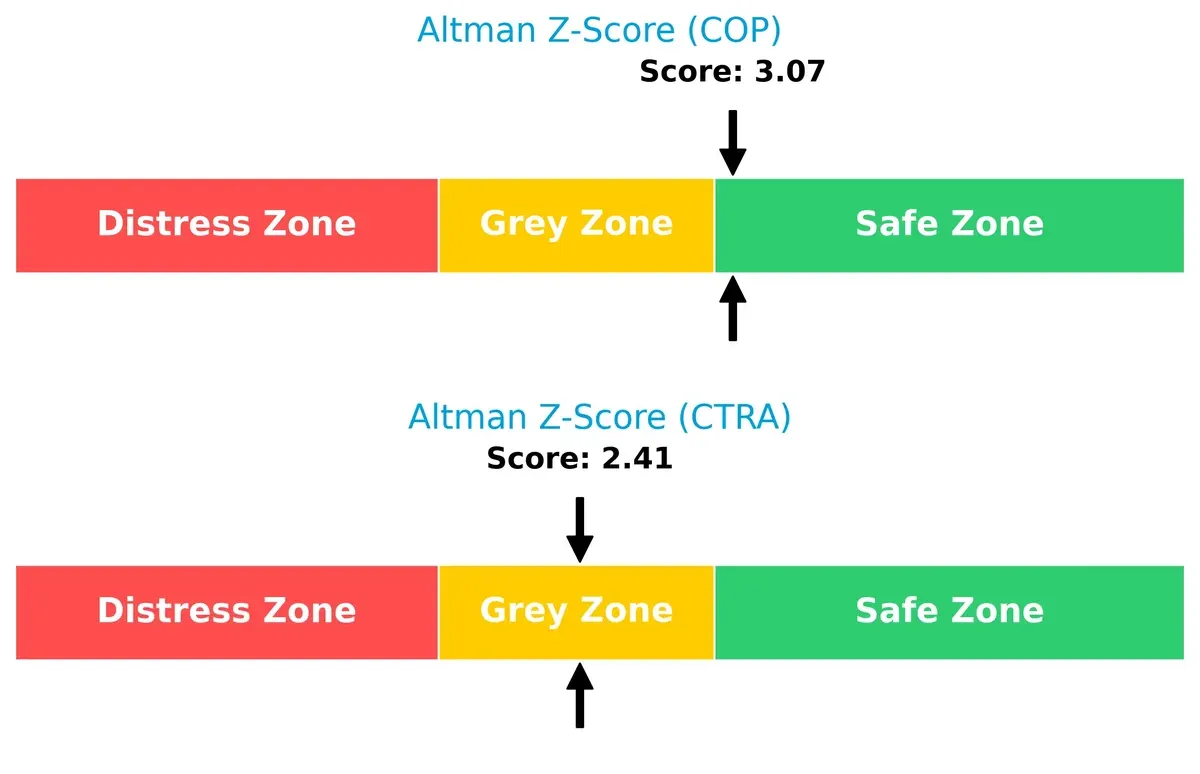
Bankruptcy Risk: Solvency Showdown
ConocoPhillips’ Altman Z-Score of 3.07 places it comfortably in the safe zone, while Coterra’s 2.41 situates it in the grey zone, implying moderate bankruptcy risk for Coterra in this economic cycle:
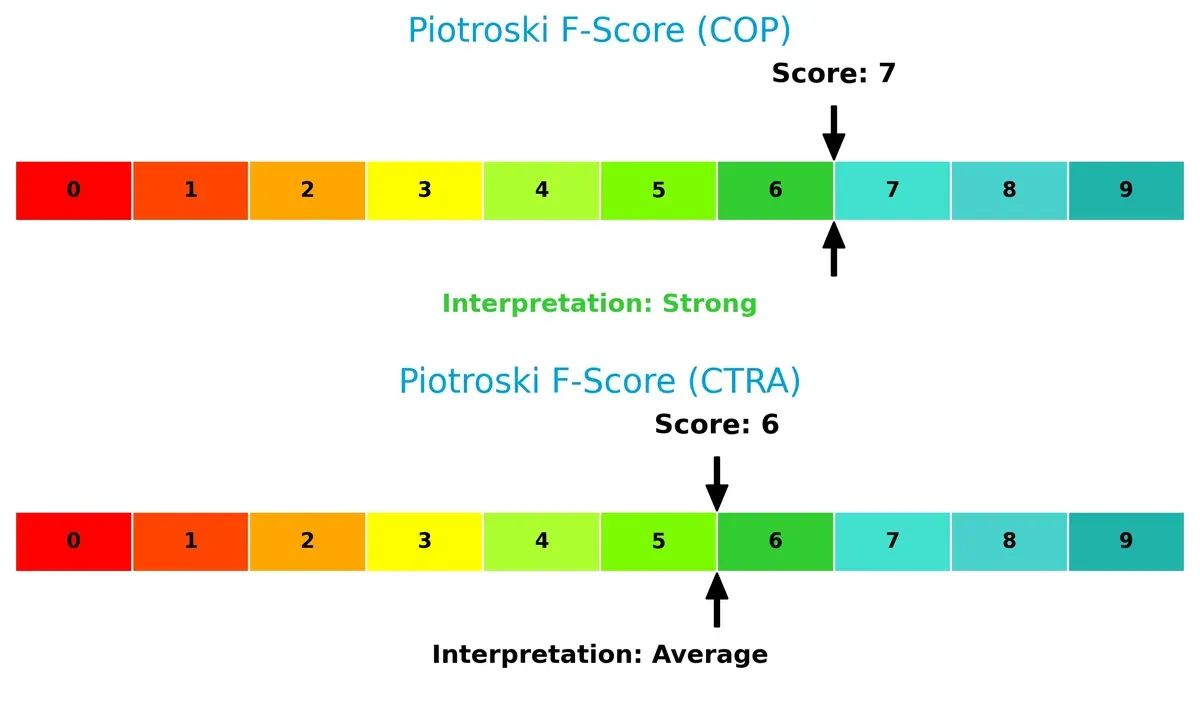
Financial Health: Quality of Operations
ConocoPhillips scores a strong 7 on the Piotroski F-Score, outperforming Coterra’s average 6. This difference indicates better operational quality and fewer internal red flags for ConocoPhillips:
How are the two companies positioned?
This section dissects the operational DNA of ConocoPhillips and Coterra by comparing their revenue distribution and internal dynamics. The goal is to confront their economic moats to identify which offers the most resilient competitive advantage today.
Revenue Segmentation: The Strategic Mix
This visual comparison dissects how ConocoPhillips and Coterra Energy diversify income streams and highlights their primary sector bets:
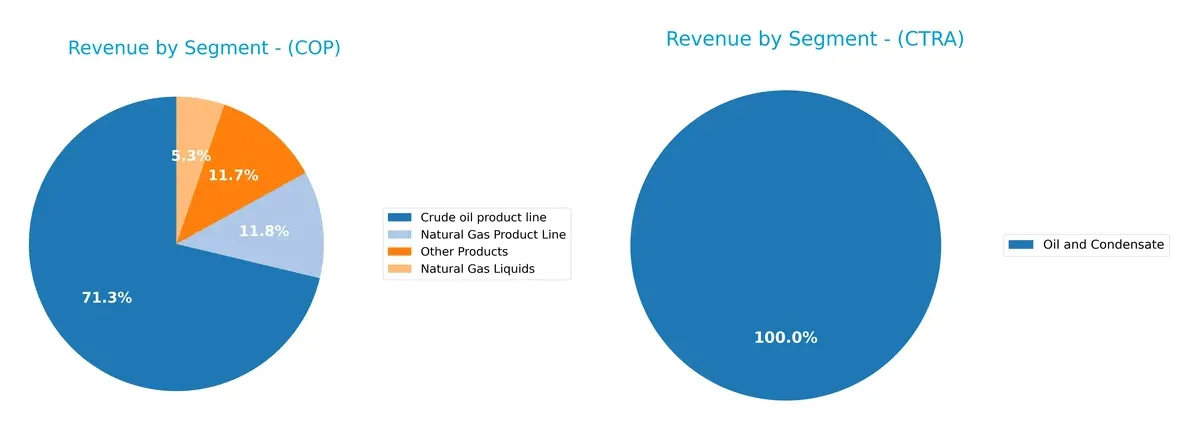
ConocoPhillips anchors revenue in its Crude Oil product line with $39B in 2024, complemented by Natural Gas ($6.4B) and Other Products ($6.4B). This mix shows moderate diversification. Coterra Energy relies heavily on Oil and Condensate, generating $2.95B in 2024, with minimal contribution from Natural Gas Liquids. ConocoPhillips’ broader portfolio reduces concentration risk, while Coterra’s focus suggests stronger exposure to oil price volatility.
Strengths and Weaknesses Comparison
This table compares the Strengths and Weaknesses of ConocoPhillips and Coterra Energy Inc.:
ConocoPhillips Strengths
- Diversified product lines with crude oil, natural gas, and liquids
- Favorable net margin at 13.29%
- Strong global presence across multiple countries
- Solid financial ratios with low debt and favorable interest coverage
- Stable dividend yield of 3.57%
Coterra Energy Inc. Strengths
- High net margin at 20.53% indicating strong profitability
- Favorable liquidity ratios, current 2.92 and quick 2.88
- Low debt-to-assets at 17.58% and strong interest coverage
- Favorable price-to-book ratio at 1.44
- Consistent dividend yield of 3.3%
ConocoPhillips Weaknesses
- Unfavorable asset and fixed asset turnover ratios limit efficiency
- Neutral return on equity at 12.3% and return on invested capital at 6.86%
- Moderate current ratio at 1.3 may pose liquidity constraints
Coterra Energy Inc. Weaknesses
- Unfavorable return on equity at 8.54%, below industry norms
- Lower asset turnover ratios at 0.25 and 0.3 impact capital use
- Slightly higher weighted average cost of capital at 5.11%
Both companies show solid profitability and prudent capital structures, yet each faces operational efficiency challenges. ConocoPhillips benefits from global diversification, while Coterra’s strengths lie in liquidity and net margin. These factors influence their strategic focus on asset utilization and regional expansion.
The Moat Duel: Analyzing Competitive Defensibility
A structural moat is the only durable shield protecting long-term profits from relentless competition erosion. Let’s dissect the competitive moats of these two energy giants:
ConocoPhillips: Diversified Asset Base and Scale Advantage
ConocoPhillips leverages its vast, geographically diversified asset portfolio as a cost advantage moat. This manifests in steady gross margins near 35% and a ROIC exceeding WACC by 2%, though ROIC trends down. Expansion in LNG and unconventional plays could deepen this moat but requires vigilant capital allocation.
Coterra Energy Inc.: Focused Operational Efficiency
Coterra’s moat stems from operational efficiency in key U.S. shale plays, reflected in a superior EBIT margin of 26.6% and a sharply improving ROIC trajectory despite current value destruction. Its concentrated acreage in Marcellus and Permian offers potential for margin expansion and scale-driven growth if it can sustain rising profitability.
Scale and Diversification vs. Focused Execution
ConocoPhillips possesses a wider moat supported by scale and global diversification, though its profitability is under pressure. Coterra’s moat is narrower but strengthening, driven by operational focus and improving returns. I see ConocoPhillips better equipped today to defend market share, but Coterra’s rising ROIC signals a moat possibly broadening in the near future.
Which stock offers better returns?
The past year shows divergent price dynamics: ConocoPhillips faces a bearish trend with accelerating losses, while Coterra Energy exhibits a sustained bullish trajectory marked by steady gains.
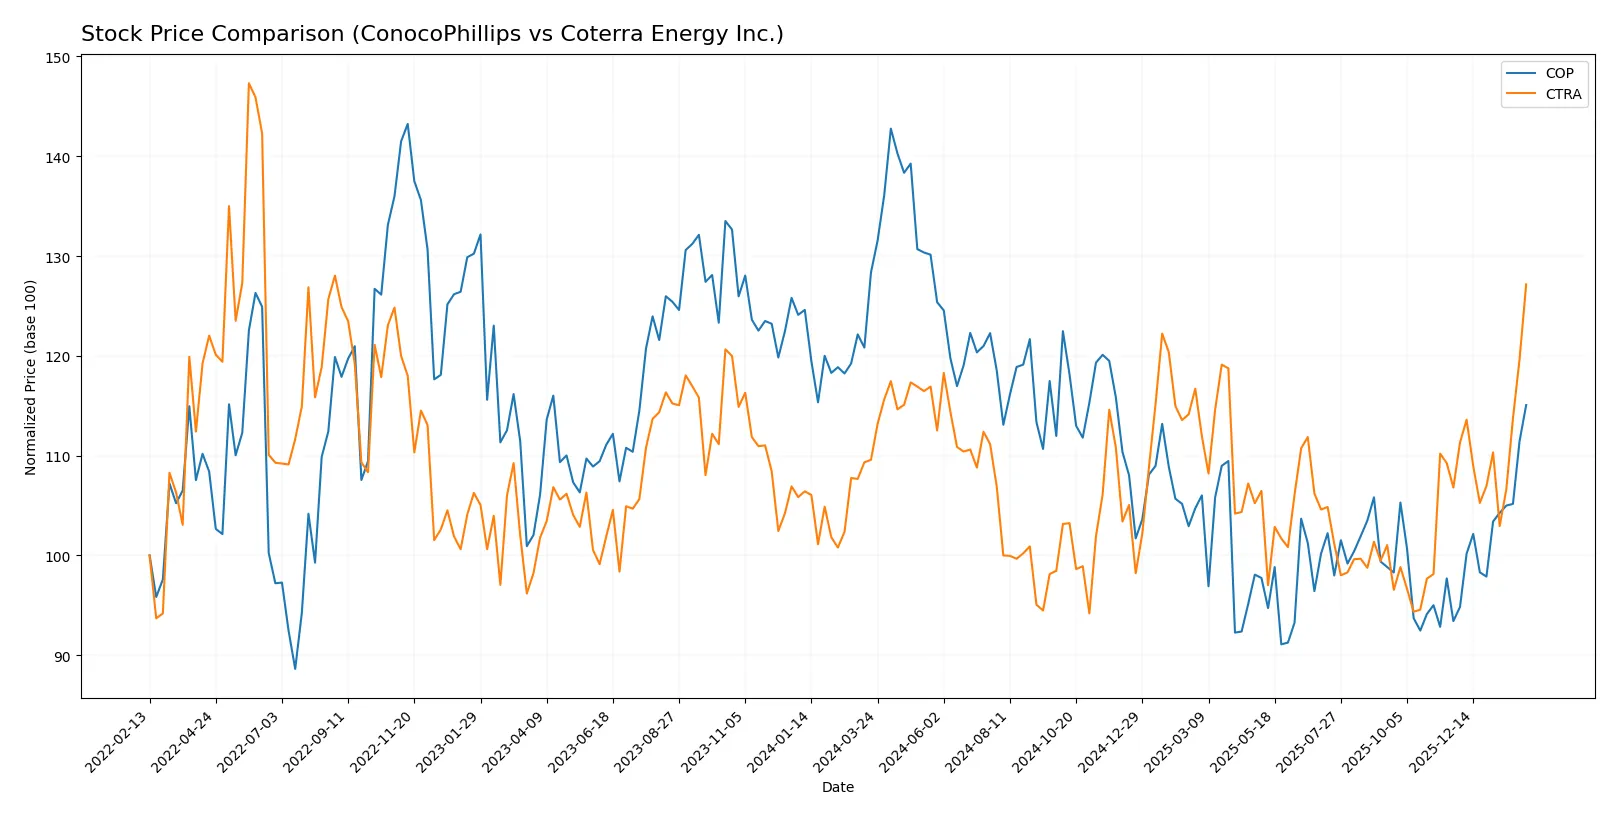
Trend Comparison
ConocoPhillips’ stock declined 10.35% over the past 12 months, signaling a bearish trend with accelerating downward momentum and high volatility (SD 11.69). The recent period shows a strong rebound with a 23.18% gain.
Coterra Energy’s shares rose 16.05% over the same period, confirming a bullish trend with moderate volatility (SD 1.81) and accelerating gains. The recent 19.07% increase reflects continued upward momentum.
Comparing both, Coterra Energy delivered the highest market performance over the year, maintaining steady growth versus ConocoPhillips’ overall decline despite its recent rally.
Target Prices
Analysts present a clear consensus on target prices for ConocoPhillips and Coterra Energy Inc.
| Company | Target Low | Target High | Consensus |
|---|---|---|---|
| ConocoPhillips | 98 | 133 | 116.07 |
| Coterra Energy Inc. | 28 | 36 | 32.4 |
The consensus targets for both energy firms sit above their current prices, suggesting moderate upside potential. Investors should weigh these targets against sector volatility and recent price movements.

Don’t Let Luck Decide Your Entry Point
Optimize your entry points with our advanced ProRealTime indicators. You’ll get efficient buy signals with precise price targets for maximum performance. Start outperforming now!
How do institutions grade them?
The following tables summarize the latest institutional grades for ConocoPhillips and Coterra Energy Inc.:
ConocoPhillips Grades
Below are recent grades from leading financial institutions for ConocoPhillips:
| Grading Company | Action | New Grade | Date |
|---|---|---|---|
| Wells Fargo | maintain | Overweight | 2026-02-06 |
| BMO Capital | maintain | Outperform | 2026-02-06 |
| Piper Sandler | maintain | Overweight | 2026-02-06 |
| Susquehanna | maintain | Positive | 2026-01-26 |
| Morgan Stanley | maintain | Overweight | 2026-01-23 |
| JP Morgan | downgrade | Neutral | 2026-01-20 |
| B of A Securities | downgrade | Underperform | 2026-01-16 |
| JP Morgan | maintain | Overweight | 2026-01-13 |
| Wells Fargo | upgrade | Overweight | 2026-01-12 |
| Piper Sandler | maintain | Overweight | 2026-01-08 |
Coterra Energy Inc. Grades
These are the most recent institutional grades for Coterra Energy Inc.:
| Grading Company | Action | New Grade | Date |
|---|---|---|---|
| Scotiabank | downgrade | Sector Perform | 2026-02-03 |
| Susquehanna | maintain | Positive | 2026-02-03 |
| Piper Sandler | maintain | Overweight | 2026-01-28 |
| Susquehanna | maintain | Positive | 2026-01-26 |
| Barclays | maintain | Overweight | 2026-01-21 |
| JP Morgan | maintain | Overweight | 2026-01-12 |
| UBS | maintain | Buy | 2025-12-12 |
| Piper Sandler | maintain | Overweight | 2025-11-18 |
| Piper Sandler | maintain | Overweight | 2025-10-21 |
| Susquehanna | maintain | Positive | 2025-10-20 |
Which company has the best grades?
ConocoPhillips has a mix of strong Overweight and Outperform grades, but also recent downgrades to Neutral and Underperform. Coterra Energy maintains consistent Overweight and Positive grades with fewer downgrades. Investors may view Coterra as more stable, while ConocoPhillips shows more grade volatility.
Risks specific to each company
The following categories identify the critical pressure points and systemic threats facing both firms in the 2026 market environment:
1. Market & Competition
ConocoPhillips (COP)
- Large global footprint diversifies risk but faces intense global competition.
Coterra Energy Inc. (CTRA)
- Focused on U.S. shale plays; regional concentration increases exposure to local market shifts.
2. Capital Structure & Debt
ConocoPhillips (COP)
- Debt-to-equity at 0.36 is moderate; interest coverage strong at 12x, signaling financial resilience.
Coterra Energy Inc. (CTRA)
- Slightly lower debt-to-equity at 0.29 and higher interest coverage at 13.7x indicate good debt management.
3. Stock Volatility
ConocoPhillips (COP)
- Beta of 0.29 shows low volatility, appealing for risk-averse investors.
Coterra Energy Inc. (CTRA)
- Beta of 0.36 slightly higher but still low; stock remains relatively stable versus market swings.
4. Regulatory & Legal
ConocoPhillips (COP)
- Operates globally; exposed to complex, varying regulations and geopolitical risks.
Coterra Energy Inc. (CTRA)
- U.S.-centric operations reduce international regulatory complexity but face strict domestic environmental rules.
5. Supply Chain & Operations
ConocoPhillips (COP)
- Diverse asset base and multiple oil and gas types reduce supply chain risk.
Coterra Energy Inc. (CTRA)
- Concentration in shale and natural gas may create vulnerability to operational bottlenecks and price shocks.
6. ESG & Climate Transition
ConocoPhillips (COP)
- Larger scale allows investment in cleaner technologies but also scrutiny on emissions.
Coterra Energy Inc. (CTRA)
- Smaller scale and focus on natural gas position it somewhat favorably in energy transition debates.
7. Geopolitical Exposure
ConocoPhillips (COP)
- Significant international presence increases geopolitical risk, including sanctions and trade tensions.
Coterra Energy Inc. (CTRA)
- Domestic-only footprint limits geopolitical risk but ties performance closely to U.S. policy and market cycles.
Which company shows a better risk-adjusted profile?
ConocoPhillips’ most impactful risk is geopolitical exposure due to its global operations. Coterra faces concentrated market risk in U.S. shale and regulatory pressure. Despite higher operational concentration, Coterra’s stronger liquidity and debt metrics improve its risk stance. However, ConocoPhillips’ lower volatility and diversified assets offer resilience. Recent Altman Z-score data shows COP in a safer financial zone, while CTRA lingers in the grey zone, justifying caution. Overall, ConocoPhillips displays a marginally better risk-adjusted profile for balanced investors.
Final Verdict: Which stock to choose?
ConocoPhillips (COP) excels as a cash-generating powerhouse with a proven ability to create value above its capital cost. Its main point of vigilance lies in a recent decline in profitability metrics, suggesting pressure on its operational efficiency. COP suits investors targeting aggressive growth with a tolerance for cyclical swings.
Coterra Energy (CTRA) offers a strategic moat rooted in improving profitability and a solid balance sheet with superior liquidity ratios. It demonstrates a safer financial profile compared to COP, albeit with a less pronounced economic moat currently. CTRA fits well in GARP portfolios seeking growth with reasonable risk controls.
If you prioritize strong cash flow generation and value creation despite short-term profitability headwinds, COP is the compelling choice due to its robust capital efficiency. However, if you seek steadier profitability improvements and greater financial safety, CTRA offers better stability and an improving competitive position. Both present viable yet distinct investment scenarios aligned with different risk appetites.
Disclaimer: Investment carries a risk of loss of initial capital. The past performance is not a reliable indicator of future results. Be sure to understand risks before making an investment decision.
Go Further
I encourage you to read the complete analyses of ConocoPhillips and Coterra Energy Inc. to enhance your investment decisions: