The J. M. Smucker Company (SJM) and Conagra Brands, Inc. (CAG) are two prominent players in the packaged foods industry, each with a rich heritage and diverse product portfolios. Both companies compete in overlapping markets, including snacks, frozen foods, and grocery staples, while pursuing innovation to capture evolving consumer preferences. This analysis will help you decide which company aligns best with your investment goals and risk appetite. Let’s explore their potential together.
Table of contents
Companies Overview
I will begin the comparison between The J. M. Smucker Company and Conagra Brands, Inc. by providing an overview of these two companies and their main differences.
The J. M. Smucker Company Overview
The J. M. Smucker Company manufactures and markets branded food and beverage products worldwide, focusing on U.S. retail segments such as pet foods, coffee, and consumer foods. With a diverse product portfolio including popular brands like Folgers and Meow Mix, Smucker operates through direct sales and brokers to various retail channels. Founded in 1897 and headquartered in Orrville, Ohio, it holds a market cap of roughly 10.7B USD.
Conagra Brands, Inc. Overview
Conagra Brands, Inc. is a North American consumer packaged goods company operating in grocery & snacks, refrigerated & frozen, international, and foodservice segments. It offers well-known brands like Birds Eye, Duncan Hines, and Slim Jim, targeting multiple retail and foodservice channels. Founded in 1861 and based in Chicago, Illinois, Conagra has a market cap of approximately 7.98B USD and employs 18,500 people.
Key similarities and differences
Both companies operate in the packaged foods industry within the consumer defensive sector and trade on the NYSE. They offer branded food products across multiple segments and retail channels, but Smucker has a strong focus on U.S. retail pet foods and coffee, while Conagra has a broader geographic reach including international markets and foodservice. Smucker is smaller in employee count and market cap but maintains a diversified product range.
Income Statement Comparison
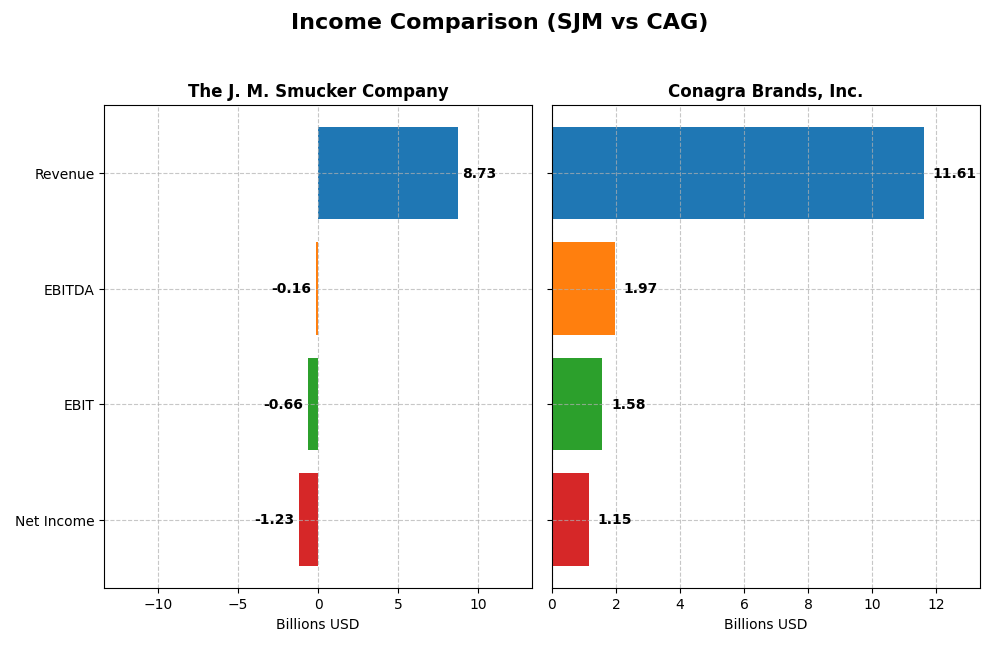
Below is a side-by-side comparison of the most recent fiscal year income statement metrics for The J. M. Smucker Company and Conagra Brands, Inc.
| Metric | The J. M. Smucker Company (SJM) | Conagra Brands, Inc. (CAG) |
|---|---|---|
| Market Cap | 10.7B | 7.98B |
| Revenue | 8.73B | 11.6B |
| EBITDA | -156M | 1.97B |
| EBIT | -658M | 1.58B |
| Net Income | -1.23B | 1.15B |
| EPS | -11.57 | 2.41 |
| Fiscal Year | 2025 | 2025 |
Income Statement Interpretations
The J. M. Smucker Company
From 2021 to 2025, Smucker’s revenue showed a favorable overall growth of 9.04%, with gross margins remaining strong at 38.79%. However, net income declined sharply by 240.45%, accompanied by a net margin decrease to -14.1%. The most recent year saw revenue rise 6.69%, but operating and net income margins deteriorated significantly, reflecting unfavorable profitability trends.
Conagra Brands, Inc.
Conagra’s revenue experienced a slight decline of 3.64% in the last year and a neutral overall growth of 3.83% since 2021. Despite this, gross and EBIT margins stayed favorable at 25.86% and 13.57%, respectively, with net margins improving to 9.92%. The latest fiscal year showed strong EBIT and net margin growth, reversing prior trends and signaling improved operational efficiency.
Which one has the stronger fundamentals?
Conagra holds stronger fundamentals with a favorable global income statement opinion, supported by positive EBIT and net margin trends and better interest expense control. Smucker, despite solid revenue growth and gross margins, faces unfavorable profitability and net income declines. The divergence in margin stability and income growth underlines Conagra’s comparatively robust financial health.
Financial Ratios Comparison
This table presents a side-by-side comparison of key financial ratios for The J. M. Smucker Company (SJM) and Conagra Brands, Inc. (CAG) based on their most recent fiscal year data.
| Ratios | The J. M. Smucker Company (SJM) | Conagra Brands, Inc. (CAG) |
|---|---|---|
| ROE | -20.2% | 12.9% |
| ROIC | -5.1% | 7.4% |
| P/E | -10.1 | 9.3 |
| P/B | 2.03 | 1.20 |
| Current Ratio | 0.81 | 0.71 |
| Quick Ratio | 0.35 | 0.24 |
| D/E (Debt to Equity) | 1.28 | 0.93 |
| Debt-to-Assets | 44.2% | 39.7% |
| Interest Coverage | -1.88 | 3.27 |
| Asset Turnover | 0.50 | 0.55 |
| Fixed Asset Turnover | 2.73 | 4.09 |
| Payout ratio | -37.0% | 58.1% |
| Dividend yield | 3.68% | 6.25% |
Interpretation of the Ratios
The J. M. Smucker Company
The J. M. Smucker Company shows predominantly unfavorable financial ratios in 2025, including negative net margin (-14.1%) and return on equity (-20.23%). Liquidity ratios like current ratio (0.81) and quick ratio (0.35) are weak, posing potential short-term risks. Despite these, the dividend yield is favorable at 3.68%, supported by regular payouts, though sustainability concerns remain due to negative profitability.
Conagra Brands, Inc.
Conagra Brands presents a more balanced ratio profile with mostly neutral to favorable metrics. Net margin (9.92%) and return on equity (12.9%) signal moderate profitability, while debt levels are manageable (debt-to-assets 39.7%). Liquidity ratios remain below 1, indicating potential tightness. The company pays dividends with a 6.25% yield, reflecting steady shareholder returns amid moderate financial health.
Which one has the best ratios?
Conagra Brands exhibits a more favorable ratio set with higher profitability, better leverage metrics, and a stronger dividend yield. The J. M. Smucker Company, by contrast, faces significant challenges including negative returns and weak liquidity. Overall, Conagra’s ratios suggest a relatively stronger financial position compared to Smucker’s unfavorable ratio profile.
Strategic Positioning
This section compares the strategic positioning of The J. M. Smucker Company (SJM) and Conagra Brands, Inc. (CAG) including market position, key segments, and exposure to technological disruption:
The J. M. Smucker Company (SJM)
- Large market cap of 10.7B with low beta, facing stable competition in packaged foods.
- Key segments include U.S. Retail Pet Foods, Coffee, Consumer Foods, and International sales.
- No explicit exposure to technological disruption mentioned.
Conagra Brands, Inc. (CAG)
- Smaller market cap of 8.0B with near-zero beta, competing in North American packaged foods.
- Operates in Grocery & Snacks, Refrigerated & Frozen, International, and Foodservice segments.
- No explicit exposure to technological disruption mentioned.
The J. M. Smucker Company vs Conagra Brands Positioning
SJM pursues a diversified approach across pet foods, coffee, and consumer foods, while CAG focuses on grocery, frozen foods, and foodservice. SJM’s segment spread contrasts with CAG’s broader channel coverage, reflecting different market focuses.
Which has the best competitive advantage?
CAG shows a slightly favorable moat with positive value creation despite declining ROIC, whereas SJM’s moat is very unfavorable due to value destruction and sharply declining profitability. Therefore, CAG currently has the stronger competitive advantage.
Stock Comparison
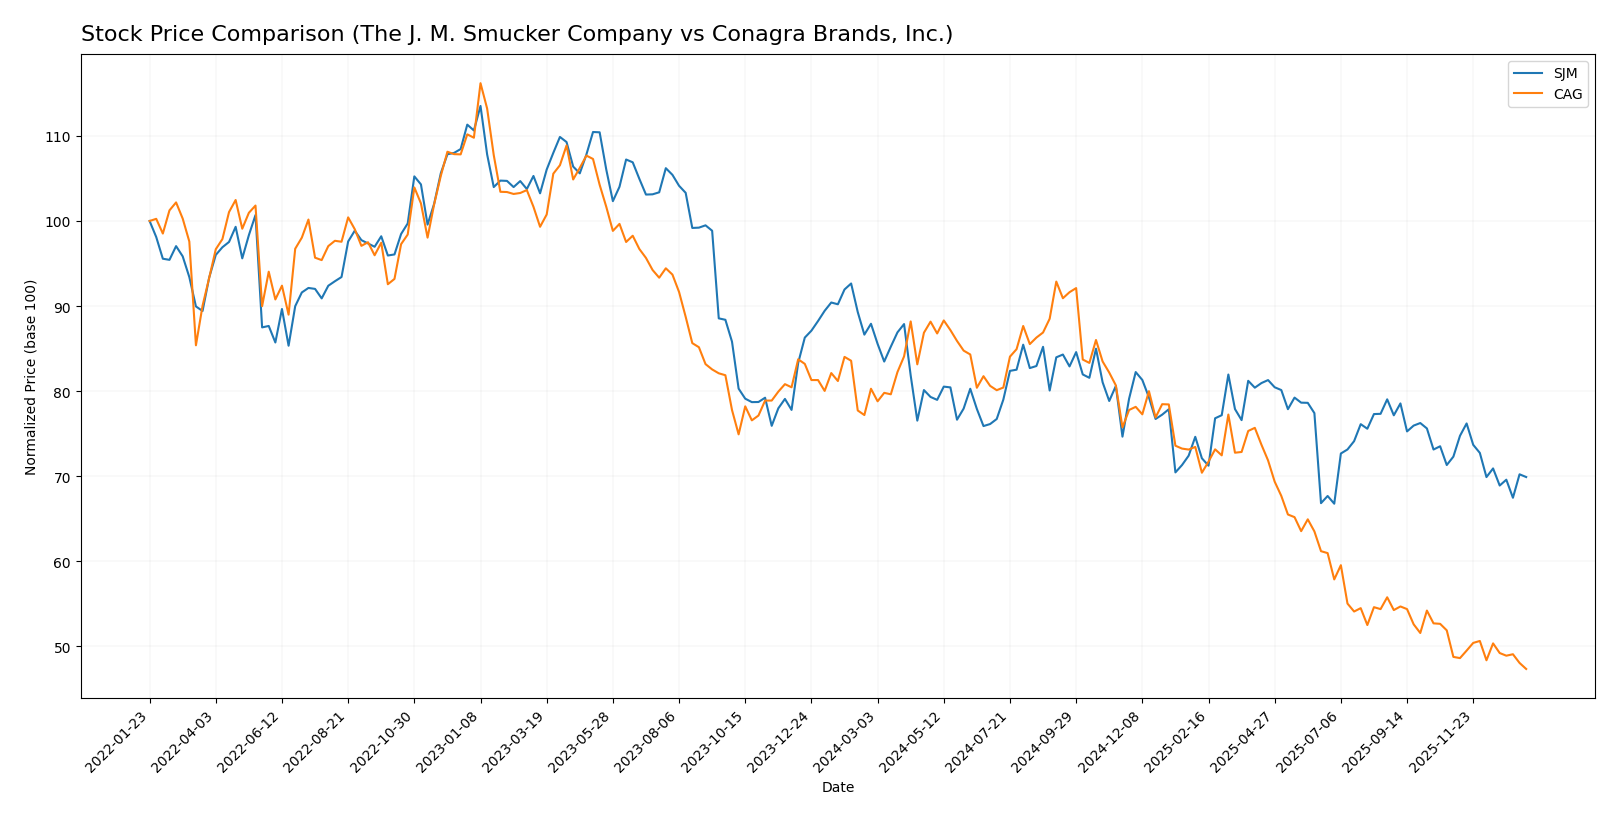
The stock price movements over the past year reveal significant bearish trends for both The J. M. Smucker Company and Conagra Brands, Inc., with notable price declines and shifting trading dynamics.
Trend Analysis
The J. M. Smucker Company (SJM) experienced a 20.49% price decline over the past year, indicating a bearish trend with deceleration. Its stock fluctuated between a high of 125.92 and a low of 95.63, showing moderate volatility (std dev 6.98).
Conagra Brands, Inc. (CAG) showed a more pronounced bearish trend with a 41.02% price drop over the last year, accompanied by acceleration in downward momentum. The stock ranged from 32.74 to 16.69, with lower volatility (std dev 4.93).
Comparing both stocks, SJM outperformed CAG in market performance over the past year, despite both showing bearish trends. SJM’s smaller percentage loss marks a relatively better outcome.
Target Prices
Analysts present a clear consensus on target prices for both The J. M. Smucker Company and Conagra Brands, Inc.
| Company | Target High | Target Low | Consensus |
|---|---|---|---|
| The J. M. Smucker Company | 117 | 110 | 113.4 |
| Conagra Brands, Inc. | 22 | 16 | 18.6 |
The J. M. Smucker Company’s consensus target of 113.4 suggests upside potential above its current price of 100.12. Conagra Brands’ consensus at 18.6 is modestly above its current price near 16.68, indicating cautious optimism among analysts.
Analyst Opinions Comparison
This section compares analysts’ ratings and grades for The J. M. Smucker Company and Conagra Brands, Inc.:
Rating Comparison
SJM Rating
- Rating: C+ rated very favorable overall.
- Discounted Cash Flow Score: Strong score of 5, very favorable.
- ROE Score: Low score of 1, very unfavorable efficiency.
- ROA Score: Low score of 1, very unfavorable asset use.
- Debt To Equity Score: Low score of 1, very unfavorable risk.
- Overall Score: Moderate score of 2 reflecting average standing.
CAG Rating
- Rating: B- rated very favorable overall.
- Discounted Cash Flow Score: Strong score of 5, very favorable.
- ROE Score: Low score of 1, very unfavorable efficiency.
- ROA Score: Low score of 1, very unfavorable asset use.
- Debt To Equity Score: Moderate score of 2, moderate financial risk.
- Overall Score: Moderate score of 2 reflecting average standing.
Which one is the best rated?
Both companies share identical overall and profitability scores, but CAG holds a moderate advantage in debt to equity and price to book scores. Therefore, CAG is slightly better rated based on the data provided.
Scores Comparison
Here is a comparison of the Altman Z-Score and Piotroski Score for the two companies:
SJM Scores
- Altman Z-Score: 0.90, indicating financial distress zone.
- Piotroski Score: 4, showing average financial strength.
CAG Scores
- Altman Z-Score: 1.48, indicating financial distress zone.
- Piotroski Score: 3, indicating very weak financial health.
Which company has the best scores?
Based on the provided data, SJM has a slightly lower Altman Z-Score but a higher Piotroski Score than CAG. SJM’s average Piotroski Score suggests better financial health compared to CAG’s very weak score.
Grades Comparison
Here is a detailed comparison of the recent grades assigned to The J. M. Smucker Company and Conagra Brands, Inc.:
The J. M. Smucker Company Grades
This table summarizes the latest grades from reputable financial institutions for SJM.
| Grading Company | Action | New Grade | Date |
|---|---|---|---|
| TD Cowen | Maintain | Hold | 2026-01-08 |
| Bernstein | Maintain | Market Perform | 2025-11-26 |
| Stifel | Maintain | Hold | 2025-11-26 |
| UBS | Maintain | Buy | 2025-11-26 |
| Morgan Stanley | Maintain | Overweight | 2025-11-26 |
| JP Morgan | Maintain | Overweight | 2025-11-26 |
| Stifel | Maintain | Hold | 2025-10-24 |
| Argus Research | Downgrade | Hold | 2025-09-12 |
| Barclays | Maintain | Equal Weight | 2025-08-29 |
| JP Morgan | Maintain | Overweight | 2025-08-28 |
Overall, grades for The J. M. Smucker Company predominantly indicate a stable to moderately positive outlook, with several “Hold” and “Overweight” ratings and few downgrades.
Conagra Brands, Inc. Grades
Below is a summary of recent grades from established grading firms for CAG.
| Grading Company | Action | New Grade | Date |
|---|---|---|---|
| Wells Fargo | Maintain | Equal Weight | 2026-01-05 |
| UBS | Maintain | Neutral | 2025-12-23 |
| Morgan Stanley | Maintain | Equal Weight | 2025-12-22 |
| Deutsche Bank | Maintain | Hold | 2025-12-22 |
| RBC Capital | Maintain | Sector Perform | 2025-12-22 |
| Evercore ISI Group | Maintain | In Line | 2025-12-22 |
| TD Cowen | Maintain | Hold | 2025-12-22 |
| B of A Securities | Maintain | Underperform | 2025-12-22 |
| JP Morgan | Maintain | Neutral | 2025-12-16 |
| Wells Fargo | Maintain | Equal Weight | 2025-12-12 |
The ratings for Conagra Brands, Inc. mostly reflect a neutral to cautious stance, with many “Hold,” “Neutral,” and “Equal Weight” grades and some underperformance signals.
Which company has the best grades?
The J. M. Smucker Company has received relatively more favorable grades, including multiple “Buy” and “Overweight” ratings, compared to Conagra Brands, Inc.’s predominantly neutral and cautious assessments. This difference may influence investors seeking moderately positive momentum versus those favoring a more conservative outlook.
Strengths and Weaknesses
Below is a comparative summary of key strengths and weaknesses for The J. M. Smucker Company (SJM) and Conagra Brands, Inc. (CAG) based on the most recent data available.
| Criterion | The J. M. Smucker Company (SJM) | Conagra Brands, Inc. (CAG) |
|---|---|---|
| Diversification | Moderate product diversification; strong in coffee and pet foods but declining snack segment | Broad product portfolio across grocery, frozen, snacks, and foodservice segments |
| Profitability | Negative net margin (-14.1%) and declining ROIC; value destroying | Positive net margin (~10%) and ROIC above WACC; creating value but with slight profitability decline |
| Innovation | Limited recent innovation; product segments stable or declining | Continual product innovation and expansion in refrigerated and frozen foods |
| Global presence | Smaller international footprint (~$1.2B revenue) compared to US segments | Stronger international and foodservice presence (~$1B international revenue) |
| Market Share | Strong in US retail coffee and pet foods; shrinking snack market share | Solid market share in grocery and refrigerated segments with growing revenue |
Key takeaways: SJM struggles with declining profitability and shrinking segments despite strong positions in coffee and pet foods. In contrast, CAG demonstrates better diversification and profitability, maintaining a slightly favorable position with ongoing innovation and stable global presence. Investors should weigh SJM’s risk of value destruction against CAG’s more balanced growth profile.
Risk Analysis
Below is a comparison of key risks associated with The J. M. Smucker Company (SJM) and Conagra Brands, Inc. (CAG) as of 2025:
| Metric | The J. M. Smucker Company (SJM) | Conagra Brands, Inc. (CAG) |
|---|---|---|
| Market Risk | Low beta (0.22) indicates low volatility; stable but sensitive to consumer preferences shifts | Near zero beta (-0.014) suggests minimal market-driven volatility but possible sensitivity to sector trends |
| Debt level | High debt-to-equity (1.28), interest coverage negative (-1.84), indicating financial distress | Moderate debt-to-equity (0.93), positive interest coverage (3.78), manageable leverage |
| Regulatory Risk | Moderate; food industry regulations and labeling requirements apply | Moderate; similar regulatory environment with additional international exposure risks |
| Operational Risk | Unfavorable liquidity ratios (current 0.81, quick 0.35), potential operational cash flow constraints | Unfavorable liquidity (current 0.71, quick 0.24), but better asset turnover and operational efficiency |
| Environmental Risk | Moderate; consumer demand shifts toward sustainability could impact products | Moderate; increasing pressure for sustainable sourcing and packaging |
| Geopolitical Risk | Primarily US-based operations, limiting exposure | Some international operations increase geopolitical exposure |
The most significant risks for Smucker stem from financial distress, highlighted by high leverage and poor coverage ratios, raising bankruptcy concerns. Conagra shows better financial stability but faces operational liquidity challenges and some geopolitical risk due to international exposure. Both companies must manage evolving regulatory and environmental pressures carefully.
Which Stock to Choose?
The J. M. Smucker Company (SJM) shows a mixed income evolution with a 6.69% revenue growth but unfavorable net margin and profitability ratios, including a negative ROE of -20.23% and declining ROIC. Its debt levels appear moderate with a debt-to-equity ratio of 1.28, but financial ratios and income statement trends are generally unfavorable, despite a very favorable overall rating of C+.
Conagra Brands, Inc. (CAG) presents a slightly favorable financial profile with a 3.83% revenue growth overall, favorable net margin of 9.92%, and positive profitability metrics such as a 12.9% ROE and 7.36% ROIC. Debt ratios are neutral to moderate, and the company has a very favorable rating of B-, supported by more favorable financial ratios and income statement performance, despite a recent revenue decline.
For investors, CAG might appear more attractive for those seeking a balance of profitability and value creation with a slightly favorable moat, while SJM could be interpreted as more challenging due to negative profitability and declining value, potentially fitting risk-tolerant profiles interested in turnaround situations.
Disclaimer: Investment carries a risk of loss of initial capital. The past performance is not a reliable indicator of future results. Be sure to understand risks before making an investment decision.
Go Further
I encourage you to read the complete analyses of The J. M. Smucker Company and Conagra Brands, Inc. to enhance your investment decisions: