Investors seeking opportunities in the packaged foods sector will find Pilgrim’s Pride Corporation (PPC) and Conagra Brands, Inc. (CAG) compelling contenders. Both companies operate in the consumer defensive industry, with extensive market reach and diverse product portfolios spanning fresh meats to shelf-stable and frozen foods. Their innovation strategies and global footprints create overlapping interests worthy of comparison. In this article, I will help you identify which company presents the most attractive investment potential.

Table of contents
Companies Overview
I will begin the comparison between Pilgrim’s Pride Corporation and Conagra Brands, Inc. by providing an overview of these two companies and their main differences.
Pilgrim’s Pride Corporation Overview
Pilgrim’s Pride Corporation operates in the packaged foods industry, focusing on producing, processing, marketing, and distributing fresh, frozen, and value-added chicken and pork products. The company serves retail, foodservice, and international markets under multiple brands. Founded in 1946 and headquartered in Greeley, Colorado, Pilgrim’s Pride employs 62,600 people and operates as a subsidiary of JBS S.A.
Conagra Brands, Inc. Overview
Conagra Brands, Inc. is a consumer packaged goods company in North America that offers a broad portfolio of shelf-stable, refrigerated, frozen, and foodservice products. The company operates through four segments and markets products under well-known brands like Birds Eye and Duncan Hines. Founded in 1861 and based in Chicago, Illinois, Conagra employs approximately 18,500 people and focuses on retail and foodservice channels.
Key similarities and differences
Both companies operate in the packaged foods sector with a focus on retail and foodservice distribution in the United States. Pilgrim’s Pride specializes in fresh and frozen meat products, primarily chicken and pork, with a significant international presence. Conagra Brands offers a wider variety of packaged food products, including shelf-stable and frozen goods, with a more diversified segment structure and fewer employees than Pilgrim’s Pride.
Income Statement Comparison
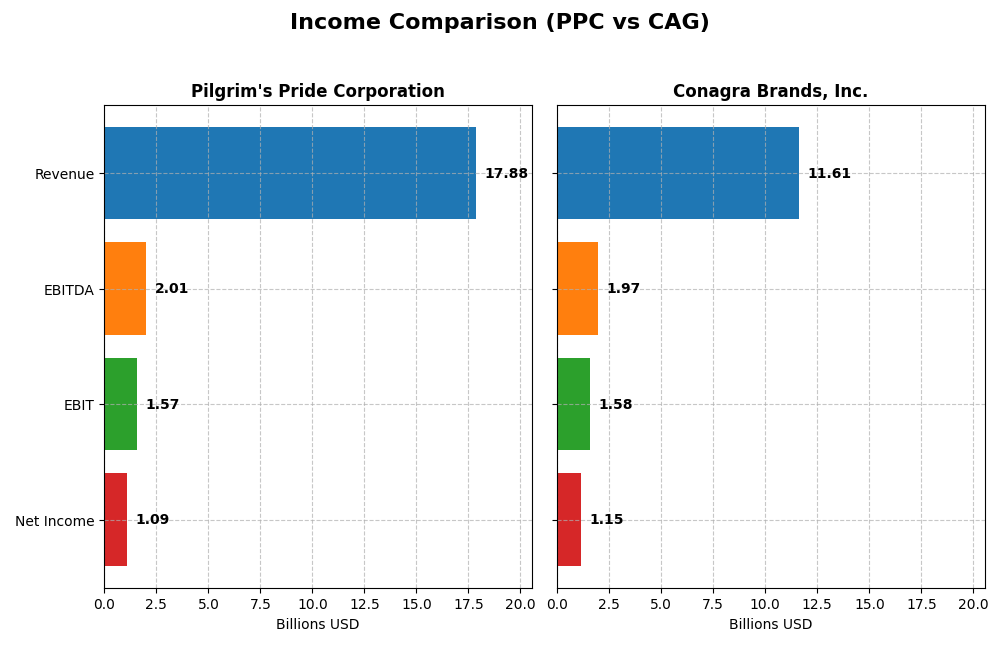
The table below presents a side-by-side comparison of key income statement metrics for Pilgrim’s Pride Corporation and Conagra Brands, Inc., based on their most recent fiscal year data.
| Metric | Pilgrim’s Pride Corporation (PPC) | Conagra Brands, Inc. (CAG) |
|---|---|---|
| Market Cap | 9.5B | 8.0B |
| Revenue | 17.9B | 11.6B |
| EBITDA | 2.0B | 2.0B |
| EBIT | 1.6B | 1.6B |
| Net Income | 1.1B | 1.2B |
| EPS | 4.58 | 2.41 |
| Fiscal Year | 2024 | 2025 |
Income Statement Interpretations
Pilgrim’s Pride Corporation
Pilgrim’s Pride Corporation experienced steady revenue growth from 2020 to 2024, with a 47.85% increase overall and a slight 2.97% rise in the last year. Net income surged dramatically by over 1,000% across the period, supported by a strong net margin growth of 675.47%. The 2024 fiscal year showed significant improvements in gross profit and EBIT margins, despite modest revenue growth.
Conagra Brands, Inc.
Conagra Brands, Inc. showed relatively flat revenue growth over the 2021-2025 period, with a small 3.83% increase overall but a 3.64% decline in the latest year. Net income declined by 11.27% overall, although net margin and EPS growth rebounded strongly in the last year. Gross and EBIT margins remain favorable, and 2025 marked a recovery in profitability metrics despite revenue headwinds.
Which one has the stronger fundamentals?
Pilgrim’s Pride demonstrates stronger fundamentals with favorable trends in revenue, net income, and margin expansions over the medium term, combined with a solid improvement in profitability in 2024. Conagra Brands has favorable margins but faces challenges in sustaining revenue and net income growth, showing mixed performance with recent margin recoveries but overall weaker income growth.
Financial Ratios Comparison
Below is a comparison of key financial ratios for Pilgrim’s Pride Corporation (PPC) and Conagra Brands, Inc. (CAG) based on their most recent fiscal year data.
| Ratios | Pilgrim’s Pride Corporation (PPC) 2024 | Conagra Brands, Inc. (CAG) 2025 |
|---|---|---|
| ROE | 25.6% | 12.9% |
| ROIC | 14.2% | 7.4% |
| P/E | 9.9 | 9.3 |
| P/B | 2.54 | 1.20 |
| Current Ratio | 2.01 | 0.71 |
| Quick Ratio | 1.31 | 0.24 |
| D/E | 0.82 | 0.93 |
| Debt-to-Assets | 32.5% | 39.7% |
| Interest Coverage | 9.3 | 3.3 |
| Asset Turnover | 1.68 | 0.55 |
| Fixed Asset Turnover | 5.27 | 4.09 |
| Payout ratio | 0% | 58.1% |
| Dividend yield | 0% | 6.25% |
Interpretation of the Ratios
Pilgrim’s Pride Corporation
Pilgrim’s Pride shows mostly favorable financial ratios, including a strong ROE at 25.63% and ROIC at 14.2%, supported by a solid current ratio of 2.01 indicating good short-term liquidity. The company’s dividend yield is zero, reflecting no dividend payments, likely due to a reinvestment focus or growth strategy without share buybacks.
Conagra Brands, Inc.
Conagra’s ratios present a mixed picture with a neutral stance on net margin (9.92%) and ROE (12.9%), but an unfavorable current ratio of 0.71 signals liquidity concerns. The dividend yield stands at 6.25%, with a neutral overall view on dividend sustainability, suggesting moderate shareholder returns alongside cautious liquidity management.
Which one has the best ratios?
Pilgrim’s Pride exhibits a more favorable ratio profile with higher profitability measures and stronger liquidity indicators, while Conagra has fewer favorable ratios and liquidity challenges. However, Conagra’s dividend yield provides some shareholder return advantage, though overall Pilgrim’s Pride’s ratios suggest a stronger financial position.
Strategic Positioning
This section compares the strategic positioning of Pilgrim’s Pride Corporation and Conagra Brands, Inc., focusing on market position, key segments, and exposure to technological disruption:
Pilgrim’s Pride Corporation
- Large market cap (9.5B), operates internationally with diverse competitive pressures in packaged foods.
- Focuses on fresh, frozen, and value-added chicken and pork products for retail, foodservice, and international markets.
- No explicit data on technological disruption exposure provided.
Conagra Brands, Inc.
- Slightly smaller market cap (8.0B), primarily North American consumer packaged goods market.
- Operates four segments: Grocery & Snacks, Refrigerated & Frozen, International, and Foodservice.
- No explicit data on technological disruption exposure provided.
Pilgrim’s Pride Corporation vs Conagra Brands, Inc. Positioning
Pilgrim’s Pride has a concentrated focus on meat products across multiple global markets, while Conagra displays a diversified segment approach in consumer packaged foods. Pilgrim’s broader geographic exposure contrasts with Conagra’s North American segment specialization.
Which has the best competitive advantage?
Pilgrim’s Pride demonstrates a very favorable moat with growing ROIC and strong value creation, indicating a durable competitive advantage. Conagra’s moat is slightly favorable but shows declining ROIC, suggesting less robust profitability sustainability.
Stock Comparison
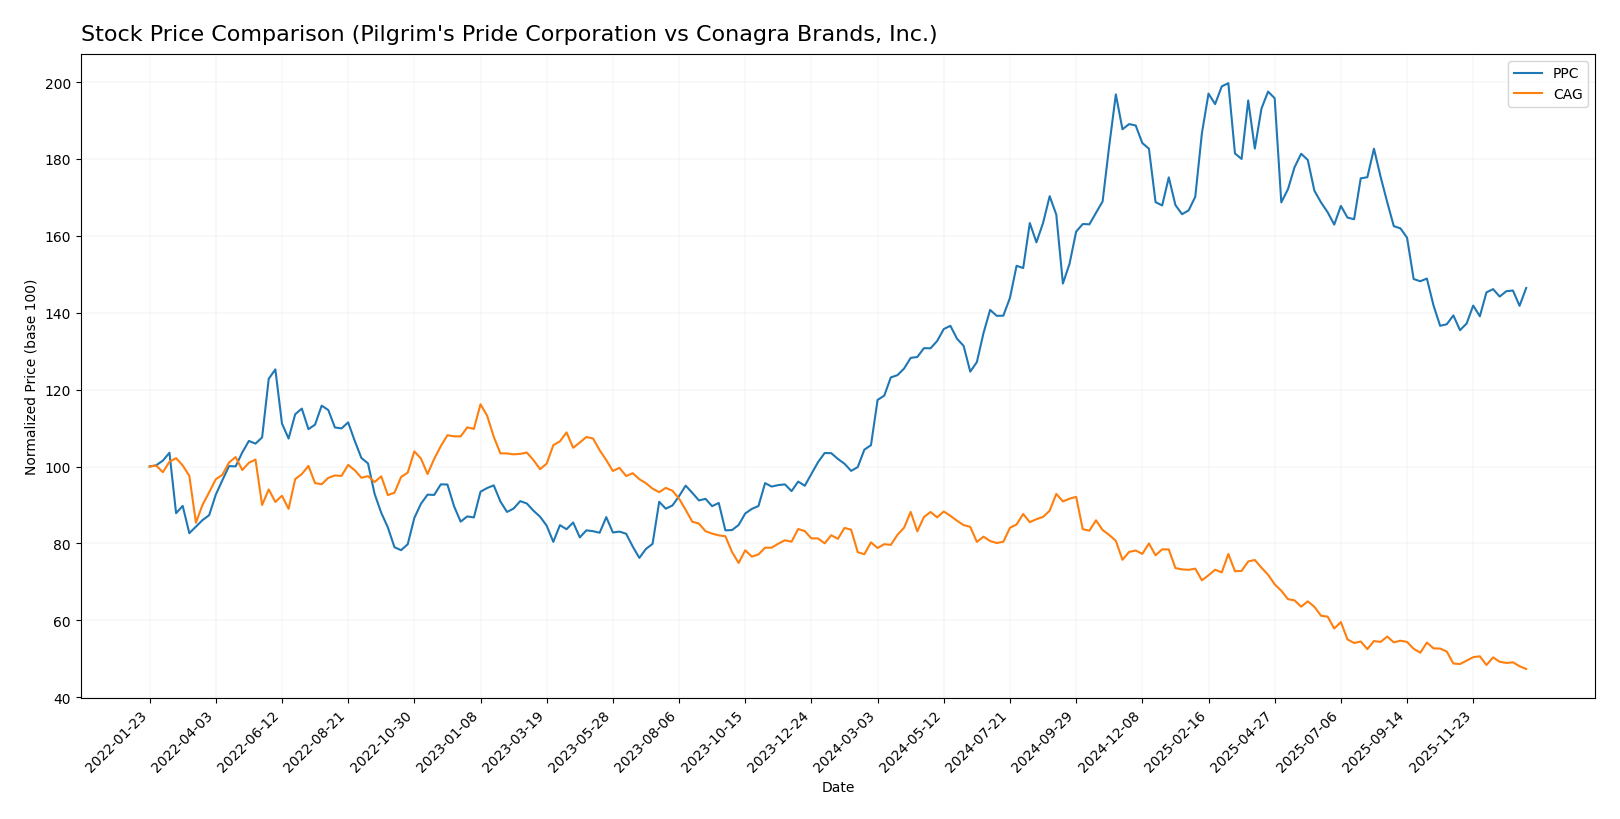
The stock price chart illustrates significant divergence in the past year, with Pilgrim’s Pride Corporation demonstrating a strong upward trajectory, while Conagra Brands, Inc. has experienced a pronounced decline.
Trend Analysis
Pilgrim’s Pride Corporation shows a bullish trend over the past 12 months with a 38.73% increase, marked by accelerating growth and higher volatility (std deviation 6.11), reaching a peak price of 54.62.
Conagra Brands, Inc. exhibits a bearish trend with a 41.02% decrease in the same period, also accelerating, with lower volatility (std deviation 4.93) and a low price of 16.69.
Comparing both, Pilgrim’s Pride outperformed Conagra Brands, delivering the highest market performance with a notable positive price change versus a significant decline.
Target Prices
Analysts provide clear target price ranges reflecting moderate upside potential for Pilgrim’s Pride Corporation and Conagra Brands, Inc.
| Company | Target High | Target Low | Consensus |
|---|---|---|---|
| Pilgrim’s Pride Corporation | 56 | 45 | 50.5 |
| Conagra Brands, Inc. | 22 | 16 | 18.6 |
The consensus target for Pilgrim’s Pride (50.5) is about 26% above the current price of 40.05, suggesting room for growth. Conagra’s target consensus (18.6) is modestly above its current price of 16.68, indicating cautious optimism from analysts.
Analyst Opinions Comparison
This section compares analysts’ ratings and grades for Pilgrim’s Pride Corporation and Conagra Brands, Inc.:
Rating Comparison
PPC Rating
- Rating: A+, indicating a very favorable overall assessment.
- Discounted Cash Flow Score: 4, favorable score suggesting reasonable valuation.
- ROE Score: 5, very favorable, showing efficient profit generation from equity.
- ROA Score: 5, very favorable, showing effective asset utilization.
- Debt To Equity Score: 4, favorable, indicating manageable financial risk.
- Overall Score: 4, favorable, reflecting strong overall financial health.
CAG Rating
- Rating: B-, reflecting a moderate overall assessment.
- Discounted Cash Flow Score: 5, very favorable, indicating undervaluation potential.
- ROE Score: 1, very unfavorable, indicating weak efficiency in profit generation.
- ROA Score: 1, very unfavorable, showing poor asset utilization.
- Debt To Equity Score: 2, moderate, indicating higher financial risk.
- Overall Score: 2, moderate, reflecting average overall financial health.
Which one is the best rated?
Based strictly on the provided data, Pilgrim’s Pride Corporation (PPC) is better rated overall, with higher scores in return on equity, return on assets, and debt to equity, while Conagra Brands, Inc. (CAG) shows strength only in discounted cash flow.
Scores Comparison
The comparison of Pilgrim’s Pride Corporation and Conagra Brands, Inc. scores is as follows:
PPC Scores
- Altman Z-Score: 3.75, indicating a safe zone for bankruptcy risk.
- Piotroski Score: 5, representing an average financial strength.
CAG Scores
- Altman Z-Score: 1.48, indicating a distress zone, risk of bankruptcy.
- Piotroski Score: 3, categorized as very weak financial strength.
Which company has the best scores?
Based on the provided data, PPC has a stronger financial profile with a safe zone Altman Z-Score and average Piotroski Score. In contrast, CAG shows distress in Altman Z-Score and very weak Piotroski Score.
Grades Comparison
Here is a comparison of the latest available grades from reputable grading firms for Pilgrim’s Pride Corporation and Conagra Brands, Inc.:
Pilgrim’s Pride Corporation Grades
The table below summarizes recent grades and actions from established analysts for Pilgrim’s Pride Corporation:
| Grading Company | Action | New Grade | Date |
|---|---|---|---|
| Barclays | Maintain | Equal Weight | 2025-12-09 |
| Goldman Sachs | Maintain | Neutral | 2025-10-13 |
| BMO Capital | Maintain | Market Perform | 2025-03-17 |
| Barclays | Maintain | Equal Weight | 2024-11-01 |
| BMO Capital | Maintain | Market Perform | 2024-11-01 |
| Barclays | Maintain | Equal Weight | 2024-09-09 |
| Argus Research | Maintain | Buy | 2024-08-28 |
| B of A Securities | Downgrade | Neutral | 2024-08-15 |
| BMO Capital | Downgrade | Market Perform | 2024-08-12 |
| Barclays | Maintain | Equal Weight | 2024-08-02 |
The overall trend for Pilgrim’s Pride shows stable grades mostly in the Neutral to Equal Weight range, with a few downgrades and occasional Buy ratings.
Conagra Brands, Inc. Grades
The following table details recent grades and analyst actions for Conagra Brands, Inc.:
| Grading Company | Action | New Grade | Date |
|---|---|---|---|
| Wells Fargo | Maintain | Equal Weight | 2026-01-05 |
| UBS | Maintain | Neutral | 2025-12-23 |
| Morgan Stanley | Maintain | Equal Weight | 2025-12-22 |
| Deutsche Bank | Maintain | Hold | 2025-12-22 |
| RBC Capital | Maintain | Sector Perform | 2025-12-22 |
| Evercore ISI Group | Maintain | In Line | 2025-12-22 |
| TD Cowen | Maintain | Hold | 2025-12-22 |
| B of A Securities | Maintain | Underperform | 2025-12-22 |
| JP Morgan | Maintain | Neutral | 2025-12-16 |
| Wells Fargo | Maintain | Equal Weight | 2025-12-12 |
Conagra’s grades are largely consistent with a Hold or Neutral consensus, including some Underperform ratings, indicating a cautious view among analysts.
Which company has the best grades?
Both Pilgrim’s Pride and Conagra Brands have predominantly neutral to hold grades, but Pilgrim’s Pride shows a slightly more positive bias with some Buy ratings and fewer Underperform marks. This suggests a marginally more favorable analyst sentiment for Pilgrim’s Pride, which could influence investor confidence and portfolio allocation preferences.
Strengths and Weaknesses
The table below summarizes the key strengths and weaknesses of Pilgrim’s Pride Corporation (PPC) and Conagra Brands, Inc. (CAG) based on their recent financial and operational performance.
| Criterion | Pilgrim’s Pride Corporation (PPC) | Conagra Brands, Inc. (CAG) |
|---|---|---|
| Diversification | Focused primarily on poultry products with moderate diversification within the protein segment. | Highly diversified across foodservice, grocery & snacks, refrigerated & frozen, and international markets. |
| Profitability | Strong profitability with ROIC at 14.2%, ROE at 25.6%, and favorable net margin of 6.1%. | Moderate profitability with ROIC at 7.4%, ROE at 12.9%, and net margin near 10%, but profitability trend declining. |
| Innovation | Consistent value creation with very favorable moat and growing ROIC, indicating efficient capital use and competitive advantage. | Slightly favorable moat with declining ROIC trend, suggesting challenges in sustaining innovation and profitability growth. |
| Global presence | Primarily focused on North American markets with limited international exposure. | Broader global presence including international segment contributing nearly $1B revenue, enhancing market reach. |
| Market Share | Strong position in poultry, benefiting from efficient operations and cost control. | Leading in multiple categories with substantial revenue in grocery, refrigerated, and snacks segments, but facing margin pressures. |
In summary, PPC shows a robust competitive advantage with strong profitability and efficient capital use, making it a compelling option for investors seeking stable returns. CAG offers greater diversification and global reach but faces headwinds in profitability and ROIC trends, warranting cautious consideration.
Risk Analysis
Below is a comparative overview of key risks facing Pilgrim’s Pride Corporation (PPC) and Conagra Brands, Inc. (CAG) as of the most recent fiscal years:
| Metric | Pilgrim’s Pride Corporation (PPC) | Conagra Brands, Inc. (CAG) |
|---|---|---|
| Market Risk | Moderate, beta 0.445 indicating lower volatility | Low, beta -0.014 indicating minimal correlation with market swings |
| Debt level | Moderate, Debt-to-Equity (D/E) 0.82, neutral risk | Moderate, D/E 0.93, neutral risk |
| Regulatory Risk | Moderate, food safety and export regulations impact operations | Moderate, food safety and labeling regulations impact business |
| Operational Risk | Moderate, supply chain and production efficiency critical | Moderate, supply chain and product diversification challenges |
| Environmental Risk | Moderate, livestock farming impacts and sustainability pressures | Moderate, packaging waste and sustainability focus |
| Geopolitical Risk | Moderate, exposure to international markets including Mexico and Europe | Moderate, primarily North America but some international exposure |
In synthesis, PPC’s most impactful risks relate to operational efficiency and international trade regulations, mitigated by strong financial health and a solid Altman Z-score signaling low bankruptcy risk. CAG faces higher financial distress risk as indicated by its Altman Z-score in the distress zone and weaker Piotroski score, with liquidity concerns reflected in low current and quick ratios. Investors should weigh PPC’s relatively stable market behavior and strong profitability against CAG’s financial vulnerabilities and operational pressures.
Which Stock to Choose?
Pilgrim’s Pride Corporation (PPC) exhibits strong income growth with a 47.85% revenue increase over 2020-2024 and a 1046.55% net income rise, supported by favorable profitability and financial ratios, moderate debt levels, and a very favorable A+ rating. Its ROIC significantly exceeds WACC, indicating a durable competitive advantage.
Conagra Brands, Inc. (CAG) shows mixed income trends with a slight 3.83% revenue growth but a decline in net income by 11.27% over 2021-2025. Financial ratios are slightly favorable overall, though liquidity ratios are weak, debt is moderate, and the company holds a B- rating. Its ROIC is above WACC but declining, suggesting value creation with weakening profitability.
Investors focused on strong growth and durable profitability might find PPC more appealing given its robust income evolution and very favorable rating, while those more cautious about recent income volatility and liquidity might view CAG as a company with moderate value creation but less financial strength.
Disclaimer: Investment carries a risk of loss of initial capital. The past performance is not a reliable indicator of future results. Be sure to understand risks before making an investment decision.
Go Further
I encourage you to read the complete analyses of Pilgrim’s Pride Corporation and Conagra Brands, Inc. to enhance your investment decisions: