Home > Comparison > Consumer Defensive > MKC vs CAG
The strategic rivalry between McCormick & Company, Incorporated and Conagra Brands, Inc. shapes the packaged foods sector’s competitive landscape. McCormick operates as a specialized flavor solutions provider, focusing on premium spices and condiments. Conagra commands a diversified portfolio across grocery, frozen, and foodservice segments with broad distribution. This analysis weighs their distinct operational models to identify which company offers a superior risk-adjusted return for a diversified portfolio in consumer defensives.
Table of contents
Companies Overview
McCormick & Company and Conagra Brands are key players in the North American packaged foods market, shaping consumer tastes and retail shelves alike.
McCormick & Company: Global Flavor Innovator
McCormick dominates the spices and seasonings sector, generating revenue through two segments: Consumer products and Flavor Solutions. Its portfolio includes well-known brands like French’s and Old Bay, with a strategic focus on expanding its global footprint and innovating flavor blends in 2026. The company leverages a broad geographic reach, serving both retail and foodservice clients with proprietary and private-label products.
Conagra Brands: Diversified Packaged Foods Leader
Conagra operates across four segments: Grocery & Snacks, Refrigerated & Frozen, International, and Foodservice. Its revenue stems from shelf-stable, frozen, and customized food products under brands such as Birds Eye and Duncan Hines. In 2026, the company emphasizes broadening its product mix and enhancing its presence in temperature-controlled and international markets to capture evolving consumer preferences.
Strategic Collision: Similarities & Divergences
Both companies compete in the packaged foods arena but approach growth differently. McCormick centers on flavor innovation and a concentrated product line, while Conagra pursues diversification across multiple food categories and temperature states. Their primary battleground lies in North American retail and foodservice channels. Investors face distinct profiles: McCormick offers focused brand strength and global reach, whereas Conagra presents scale and product variety with higher operational complexity.
Income Statement Comparison
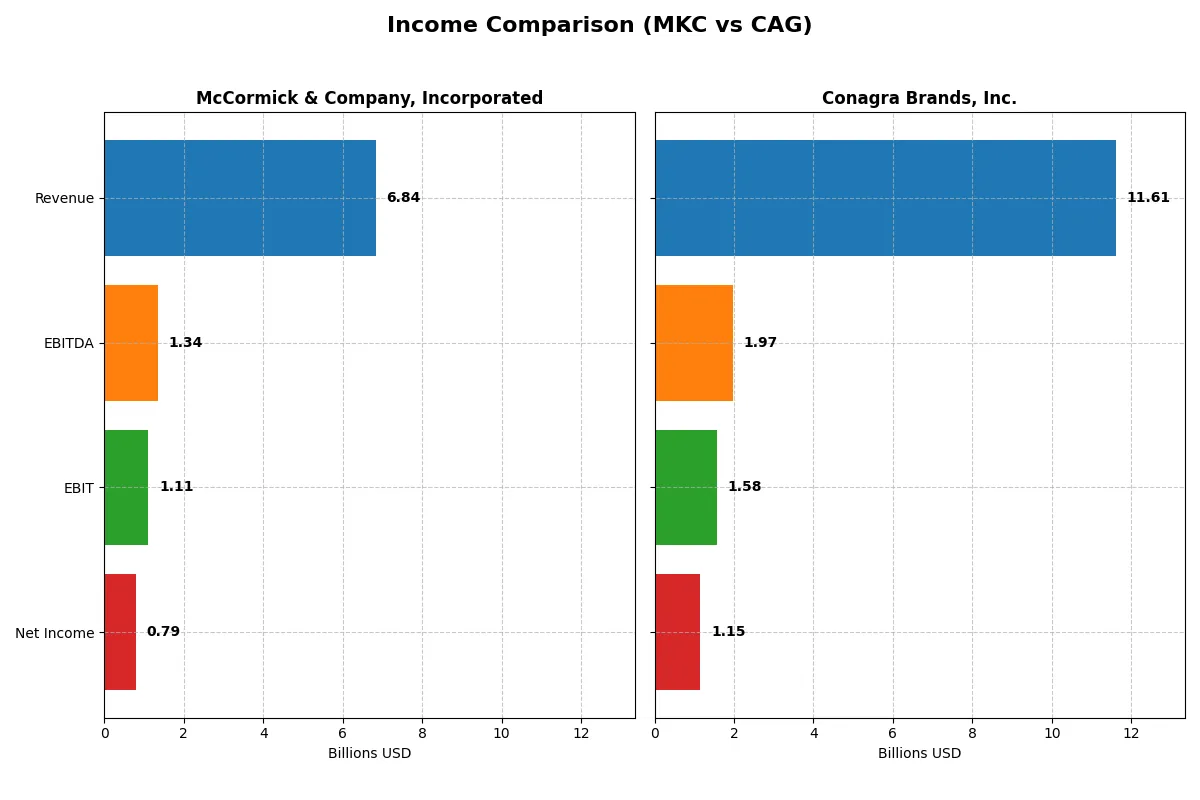
This data dissects the core profitability and scalability of both corporate engines to reveal who dominates the bottom line:
| Metric | McCormick & Company, Incorporated (MKC) | Conagra Brands, Inc. (CAG) |
|---|---|---|
| Revenue | 6.84B | 11.61B |
| Cost of Revenue | 4.25B | 8.61B |
| Operating Expenses | 1.50B | 1.64B |
| Gross Profit | 2.59B | 3.00B |
| EBITDA | 1.34B | 1.97B |
| EBIT | 1.11B | 1.58B |
| Interest Expense | 196M | 417M |
| Net Income | 789M | 1.15B |
| EPS | 2.94 | 2.41 |
| Fiscal Year | 2025 | 2025 |
Income Statement Analysis: The Bottom-Line Duel
Comparing recent income statements reveals which company runs a more efficient, profitable engine amid shifting revenue and margin trends.
McCormick & Company, Incorporated Analysis
McCormick’s revenue climbed steadily from 6.3B in 2021 to 6.8B in 2025, reflecting consistent growth. Net income, however, showed more modest gains, rising from 755M to 789M. Gross margins remain robust near 38%, while net margin at 11.5% signals healthy profitability. Its 2025 results highlight operational efficiency despite a slight net margin contraction.
Conagra Brands, Inc. Analysis
Conagra’s revenue peaked at 12.3B in 2023 but slipped to 11.6B by 2025, marking a recent decline. Net income plunged sharply in 2024 but rebounded to 1.15B in 2025, driven by a 244% net margin surge. Gross margin lags McCormick at 26%, yet improved EBIT margin and EPS growth in 2025 showcase a strong earnings recovery despite top-line pressure.
Margin Power vs. Earnings Momentum
McCormick delivers steadier revenue growth and superior gross and net margins, underpinning consistent profitability. Conagra, while larger in scale, faces revenue headwinds but posts an impressive net margin and EPS rebound in 2025. For investors prioritizing margin stability and consistent growth, McCormick’s profile appears more attractive. Conagra suits those focused on turnaround momentum amidst volatility.
Financial Ratios Comparison
These vital ratios act as a diagnostic tool to expose the underlying fiscal health, valuation premiums, and capital efficiency of the companies compared below:
| Ratios | McCormick & Company, Incorporated (MKC) | Conagra Brands, Inc. (CAG) |
|---|---|---|
| ROE | 13.76% | 12.90% |
| ROIC | 7.93% | 7.36% |
| P/E | 22.59 | 9.30 |
| P/B | 3.11 | 1.20 |
| Current Ratio | 0.70 | 0.71 |
| Quick Ratio | 0.28 | 0.24 |
| D/E (Debt-to-Equity) | 0.70 | 0.93 |
| Debt-to-Assets | 30.27% | 39.70% |
| Interest Coverage | 5.57 | 3.27 |
| Asset Turnover | 0.52 | 0.55 |
| Fixed Asset Turnover | 4.72 | 4.09 |
| Payout ratio | 61.19% | 58.07% |
| Dividend yield | 2.71% | 6.25% |
| Fiscal Year | 2025 | 2025 |
Efficiency & Valuation Duel: The Vital Signs
Financial ratios act as a company’s DNA, exposing hidden risks and operational excellence that define its investment profile.
McCormick & Company, Incorporated
McCormick delivers a solid 13.8% ROE with favorable net margins at 11.5%, indicating efficient profitability. The P/E of 22.6 points to a fairly valued stock, though a high P/B of 3.1 flags valuation caution. Dividend yield of 2.7% rewards shareholders, balancing growth with income stability.
Conagra Brands, Inc.
Conagra posts a respectable 12.9% ROE and near 10% net margin, demonstrating moderate efficiency. Its P/E of 9.3 signals an attractively priced valuation, supported by a low P/B of 1.2. A healthy 6.3% dividend yield enhances shareholder returns, reflecting a focus on income distribution.
Balanced Profitability vs. Attractive Valuation
McCormick blends operational strength with moderate valuation, while Conagra offers a cheaper stock with higher dividend yield but slightly lower margins. Investors seeking income might prefer Conagra’s yield, whereas those valuing stable profitability may lean toward McCormick. Each profile suits different risk-reward appetites.
Which one offers the Superior Shareholder Reward?
I observe McCormick & Company (MKC) and Conagra Brands (CAG) follow distinct shareholder reward strategies in 2026. MKC delivers a modest 2.7% dividend yield with a high payout ratio near 61%, supported by solid free cash flow coverage (~77%). Its buyback intensity is moderate, reflecting balanced capital allocation. CAG offers a striking 6.2% dividend yield but with an unsustainably high payout ratio of 190%, signaling risk to dividend stability. Its free cash flow coverage (~77%) matches MKC’s, but buybacks appear less emphasized. Historically, MKC’s conservative payout and steady buybacks promise more sustainable long-term value. I conclude MKC offers a superior total return profile for prudent investors in 2026.
Comparative Score Analysis: The Strategic Profile
The radar chart reveals the fundamental DNA and trade-offs of McCormick & Company and Conagra Brands:
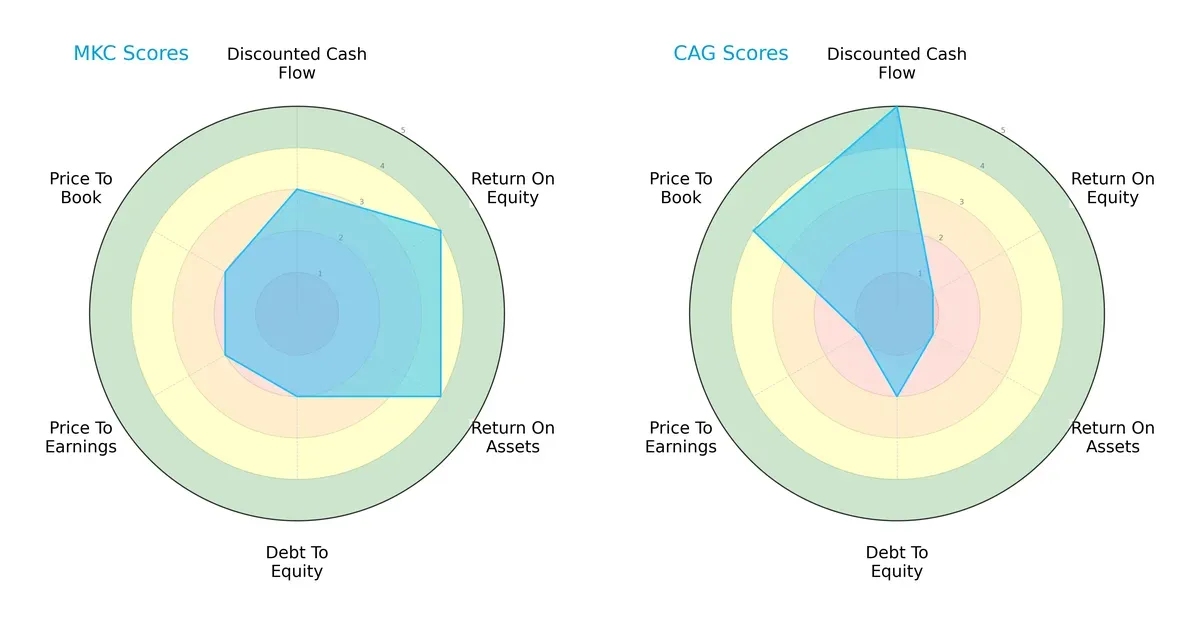
McCormick displays a balanced profile with solid ROE (4) and ROA (4) scores, indicating efficient profit and asset use. Conagra excels in discounted cash flow (5) but suffers from weak profitability metrics, with ROE and ROA scores at 1. Both share moderate debt-to-equity risk (2), but Conagra’s valuation scores are polarized: low P/E (1) suggests undervaluation, while high P/B (4) indicates a premium. McCormick’s moderate valuation scores reflect steadier market confidence.
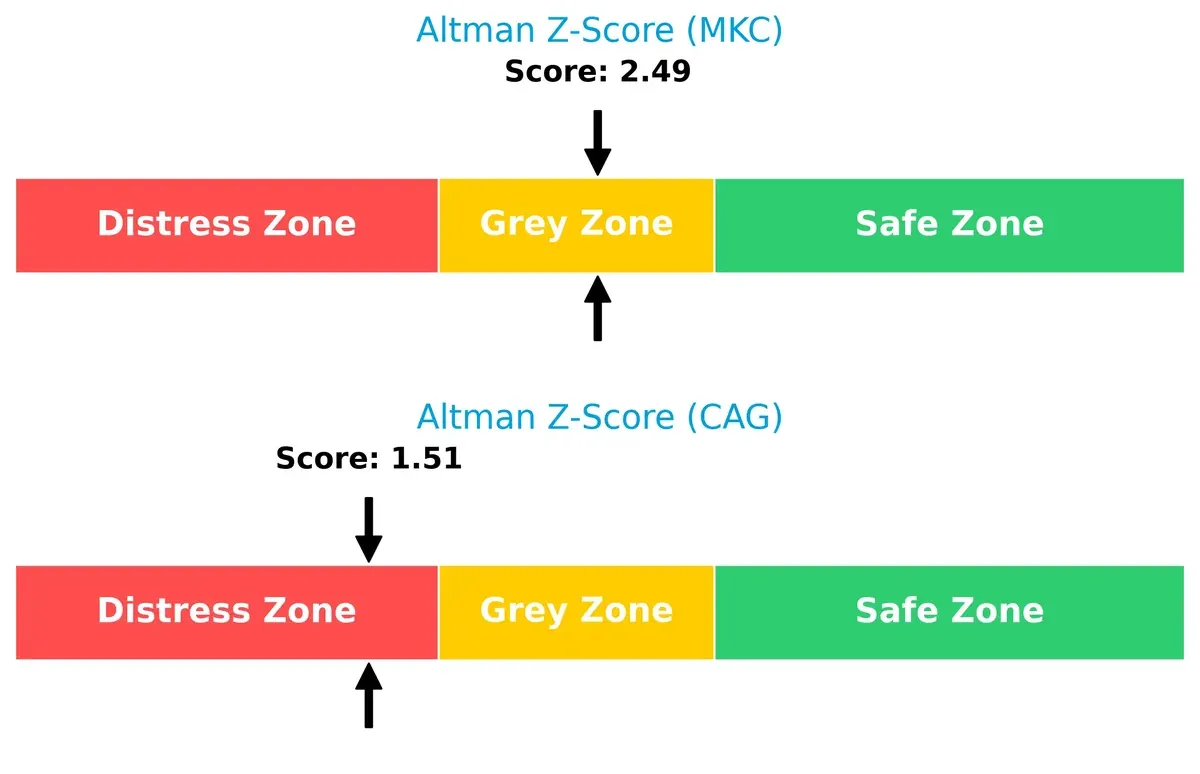
Bankruptcy Risk: Solvency Showdown
McCormick’s Altman Z-Score of 2.49 places it in the grey zone, indicating moderate bankruptcy risk. Conagra’s 1.51 falls in the distress zone, signaling a higher likelihood of financial distress in this cycle:
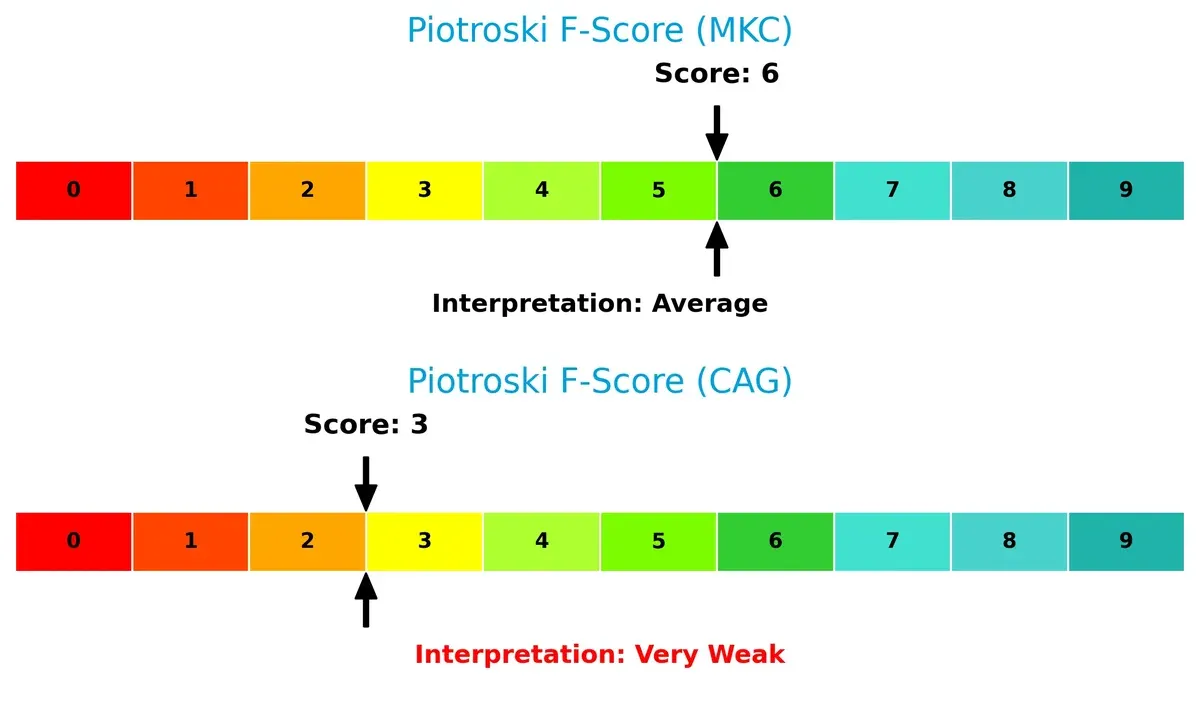
Financial Health: Quality of Operations
McCormick’s Piotroski F-Score of 6 signals average financial health with no major red flags. Conagra’s score of 3 flags weak operational quality and potential internal challenges:
How are the two companies positioned?
This section dissects the operational DNA of McCormick (MKC) and Conagra (CAG) by comparing their revenue distribution and internal strengths and weaknesses. The goal is to confront their economic moats to reveal which model offers the most resilient and sustainable competitive advantage today.
Revenue Segmentation: The Strategic Mix
This comparison dissects how McCormick & Company and Conagra Brands diversify their income streams and highlights their primary sector bets for 2025:
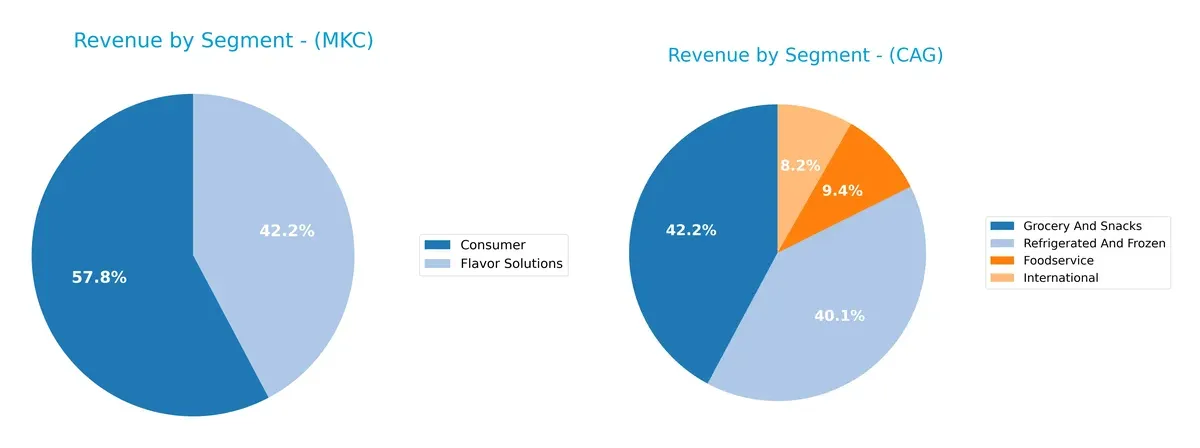
McCormick anchors its revenue in two main segments: Consumer at $3.95B and Flavor Solutions at $2.89B, showing a focused but balanced mix. Conagra dwarfs this with a more diversified portfolio: Grocery and Snacks at $4.90B, Refrigerated and Frozen $4.66B, Foodservice $1.09B, and International $0.96B. Conagra’s spread reduces concentration risk, while McCormick’s reliance on two segments suggests targeted expertise but potential vulnerability if either falters.
Strengths and Weaknesses Comparison
This table compares the Strengths and Weaknesses of McCormick & Company (MKC) and Conagra Brands (CAG):
MKC Strengths
- Favorable net margin at 11.54%
- WACC at 6.17% below ROIC improves capital efficiency
- High interest coverage at 5.65
- Strong fixed asset turnover at 4.72
- Dividend yield of 2.71% supports shareholder returns
- Geographic diversification across Americas, EMEA, Asia Pacific
CAG Strengths
- Favorable WACC at 4.36% supports cost-effective capital
- Low P/E at 9.3 and P/B at 1.2 indicate valuation appeal
- Favorable fixed asset turnover at 4.09
- Diverse revenue streams in Foodservice, Grocery, Refrigerated segments
- International sales contribute meaningfully to revenue
MKC Weaknesses
- Low current ratio at 0.7 signals liquidity risk
- Quick ratio at 0.28 indicates potential short-term solvency issues
- Unfavorable P/B ratio at 3.11 may reflect overvaluation
- ROE and ROIC only neutral, limiting profitability upside
- Moderate debt-to-assets at 30.27% requires monitoring
CAG Weaknesses
- Low current ratio at 0.71 and quick ratio at 0.24 create liquidity concerns
- Interest coverage at 3.78 is neutral, less cushion for debt costs
- Neutral net margin at 9.92% shows limited profitability strength
- Higher debt-to-assets near 39.7% increases financial leverage
- No geographic revenue segmentation disclosed, limiting global exposure insight
MKC shows strengths in profitability margins and geographic diversification but faces liquidity red flags. CAG offers attractive valuation and broad product diversification yet contends with liquidity constraints and higher leverage. Both companies’ strategies must address these weaknesses to sustain their competitive positions.
The Moat Duel: Analyzing Competitive Defensibility
A structural moat is the only reliable shield protecting long-term profits from relentless competition erosion:
McCormick & Company, Incorporated: Intangible Assets Powerhouse
McCormick leverages strong brand recognition and proprietary flavor formulas, delivering steady margins near 38% gross and 16% EBIT. Its expanding international footprint in 2026 may deepen this intangible asset moat, though modest revenue growth signals caution.
Conagra Brands, Inc.: Scale-Driven Cost Advantage
Conagra’s cost advantage stems from extensive scale in North American grocery and foodservice channels. Its lower 26% gross margin contrasts with McCormick’s premium pricing. Despite recent ROIC decline, a sharp EBIT rebound and margin expansion in 2025 highlight operational leverage potential for 2026.
Brand Equity vs. Scale Efficiency: The Moat Battle
McCormick boasts a deeper intangible asset moat with rising ROIC and resilient premium margins. Conagra creates value through scale but faces profitability pressure. I see McCormick better positioned to defend market share long term.
Which stock offers better returns?
The past year shows notable price declines for both companies, with Conagra Brands experiencing a sharper drop but a recent rebound, while McCormick & Company faces a steady downtrend with decelerating losses.
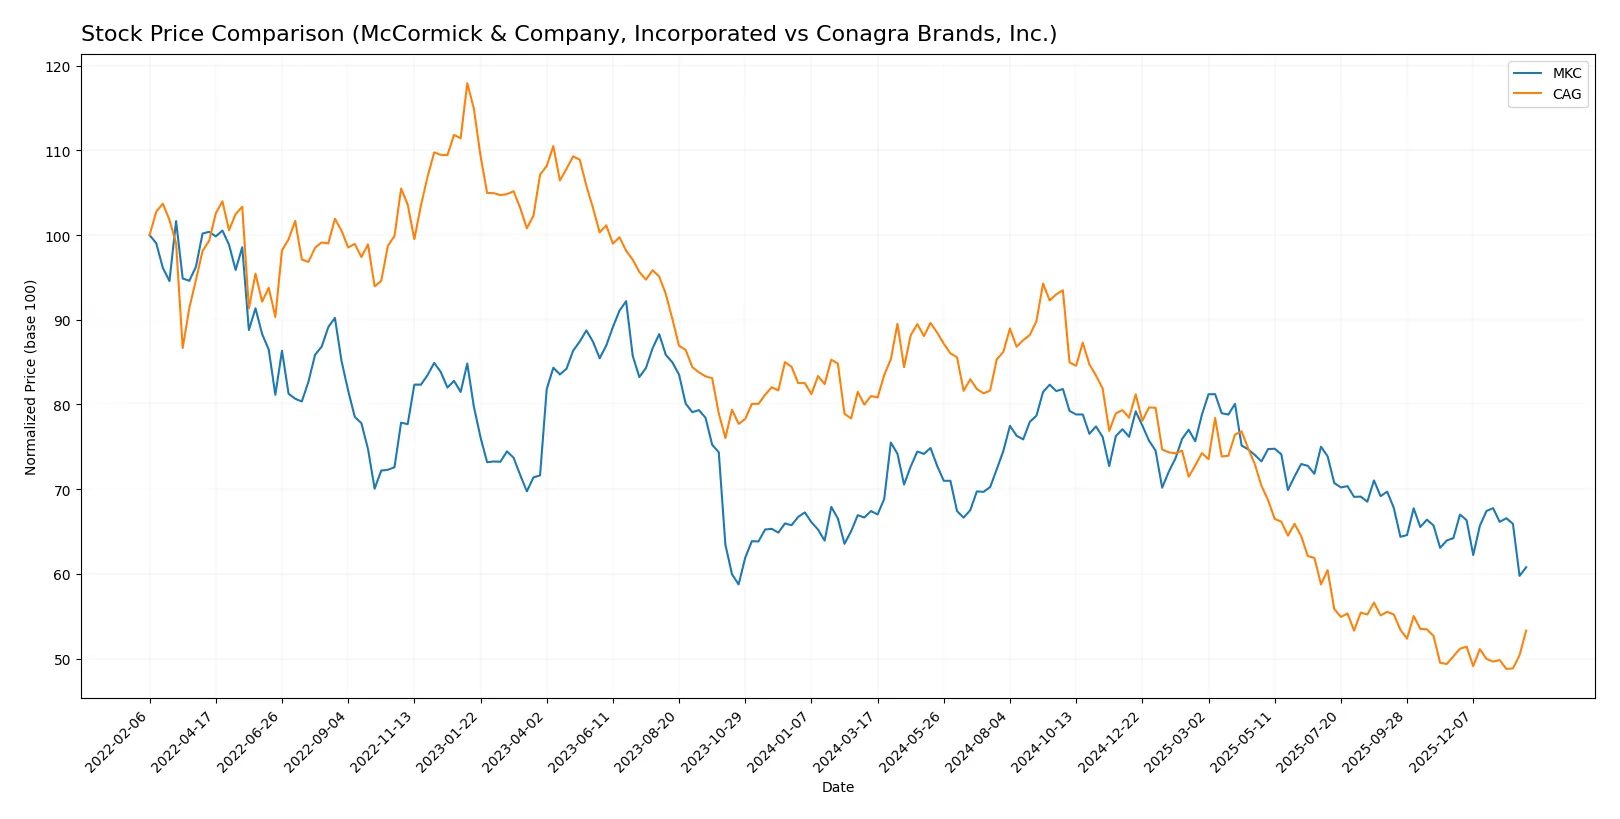
Trend Comparison
McCormick & Company’s stock price fell 9.84% over the past 12 months, marking a bearish trend with decelerating losses. The price ranged from a high of 83.76 to a low of 60.79, with volatility at 5.29%.
Conagra Brands saw a sharper 34.2% decline over the same period, confirming a bearish trend with accelerating losses. The stock fluctuated between 32.74 and 16.94, showing slightly lower volatility at 5.0%. Recently, it gained 6.07%, indicating a neutral short-term slope.
Conagra Brands delivered the lowest overall market performance, despite a recent partial recovery. McCormick’s losses were smaller but persistent, making its trend less volatile yet still bearish.
Target Prices
Analysts present a moderate upside potential for McCormick & Company and a near-parity outlook for Conagra Brands.
| Company | Target Low | Target High | Consensus |
|---|---|---|---|
| McCormick & Company, Incorporated | 67 | 85 | 73.57 |
| Conagra Brands, Inc. | 16 | 22 | 18.5 |
McCormick’s target consensus of 73.57 suggests a roughly 19% upside from its current 61.83 price. Conagra’s consensus at 18.5 is nearly aligned with its current 18.51 share price, indicating limited expected movement.

Don’t Let Luck Decide Your Entry Point
Optimize your entry points with our advanced ProRealTime indicators. You’ll get efficient buy signals with precise price targets for maximum performance. Start outperforming now!
How do institutions grade them?
The following tables summarize recent institutional grades for McCormick & Company, Incorporated and Conagra Brands, Inc.:
McCormick & Company, Incorporated Grades
This table shows recent grades from reputable financial institutions for McCormick & Company, Incorporated.
| Grading Company | Action | New Grade | Date |
|---|---|---|---|
| Barclays | Maintain | Equal Weight | 2026-01-26 |
| UBS | Maintain | Neutral | 2026-01-23 |
| Stifel | Maintain | Hold | 2026-01-23 |
| Barclays | Maintain | Equal Weight | 2025-10-08 |
| Jefferies | Maintain | Buy | 2025-10-08 |
| Deutsche Bank | Maintain | Hold | 2025-10-08 |
| Stifel | Maintain | Hold | 2025-10-08 |
| UBS | Maintain | Neutral | 2025-10-08 |
| Bernstein | Maintain | Outperform | 2025-10-08 |
| UBS | Maintain | Neutral | 2025-10-01 |
Conagra Brands, Inc. Grades
This table shows recent grades from reputable financial institutions for Conagra Brands, Inc.
| Grading Company | Action | New Grade | Date |
|---|---|---|---|
| Morgan Stanley | Maintain | Equal Weight | 2026-01-16 |
| Wells Fargo | Maintain | Equal Weight | 2026-01-05 |
| UBS | Maintain | Neutral | 2025-12-23 |
| RBC Capital | Maintain | Sector Perform | 2025-12-22 |
| Deutsche Bank | Maintain | Hold | 2025-12-22 |
| B of A Securities | Maintain | Underperform | 2025-12-22 |
| TD Cowen | Maintain | Hold | 2025-12-22 |
| Morgan Stanley | Maintain | Equal Weight | 2025-12-22 |
| Evercore ISI Group | Maintain | In Line | 2025-12-22 |
| JP Morgan | Maintain | Neutral | 2025-12-16 |
Which company has the best grades?
McCormick holds generally higher grades, including Buy and Outperform ratings from Jefferies and Bernstein. Conagra’s ratings cluster around Equal Weight and Hold, with one Underperform. These differences may influence investors’ perceptions of growth potential and risk.
Risks specific to each company
The following categories identify critical pressure points and systemic threats facing McCormick & Company, Incorporated and Conagra Brands, Inc. in the 2026 market environment:
1. Market & Competition
McCormick & Company, Incorporated
- Strong brand portfolio in spices and seasonings; competitive packaged foods market pressures margins.
Conagra Brands, Inc.
- Diverse product segments but faces intense competition in shelf-stable and frozen foods.
2. Capital Structure & Debt
McCormick & Company, Incorporated
- Moderate debt-to-equity ratio (0.7) with favorable interest coverage (5.65), signaling manageable leverage.
Conagra Brands, Inc.
- Higher debt-to-equity ratio (0.93) with weaker interest coverage (3.78), indicating tighter debt servicing capacity.
3. Stock Volatility
McCormick & Company, Incorporated
- Beta of 0.617 reflects lower volatility compared to the market, offering stability in turbulent times.
Conagra Brands, Inc.
- Beta near zero (-0.014) suggests minimal correlation with market moves but potential unpredictability.
4. Regulatory & Legal
McCormick & Company, Incorporated
- Operates globally with exposure to food safety regulations; compliance costs may rise.
Conagra Brands, Inc.
- Large U.S. footprint with increasing scrutiny on labeling and health standards.
5. Supply Chain & Operations
McCormick & Company, Incorporated
- Complex global sourcing can face disruption risks, especially in spices and raw materials.
Conagra Brands, Inc.
- Reliance on refrigerated and frozen logistics increases vulnerability to operational disruptions.
6. ESG & Climate Transition
McCormick & Company, Incorporated
- Pressure to improve sustainability in agricultural sourcing and packaging to meet ESG standards.
Conagra Brands, Inc.
- Must address emissions and waste in temperature-controlled supply chains to align with climate goals.
7. Geopolitical Exposure
McCormick & Company, Incorporated
- Exposure to international markets including EMEA and China adds currency and trade risk.
Conagra Brands, Inc.
- Primarily North American focus limits geopolitical risks but offers less diversification.
Which company shows a better risk-adjusted profile?
McCormick’s moderate leverage, favorable interest coverage, and lower stock volatility suggest a more balanced risk profile. Conagra faces higher financial strain with weaker debt metrics and operational complexities in refrigerated segments. McCormick’s international presence adds geopolitical risk but also diversification. Conagra’s distressed Altman Z-score and very weak Piotroski score raise caution. The key risk for McCormick is supply chain complexity; for Conagra, financial distress risks dominate. McCormick’s superior interest coverage and stable beta justify my confidence in its relatively safer risk-adjusted stance.
Final Verdict: Which stock to choose?
McCormick & Company’s superpower lies in its consistent margin strength and improving profitability, reflecting disciplined capital allocation and operational resilience. Its point of vigilance is a tight liquidity position, which could pressure short-term flexibility. It fits well in an Aggressive Growth portfolio seeking steady margin expansion.
Conagra Brands benefits from a strategic moat built on its value pricing and strong free cash flow generation, offering a margin of safety. Compared to McCormick, it provides better valuation appeal and a more conservative financial profile, making it suitable for a GARP – Growth at a Reasonable Price – portfolio.
If you prioritize margin durability and operational efficiency, McCormick outshines with its disciplined profitability and improving returns. However, if you seek valuation upside with better cash flow yield and relative stability, Conagra offers a more compelling scenario despite some headwinds in profitability trends. Both present nuanced cases depending on your risk tolerance and investment horizon.
Disclaimer: Investment carries a risk of loss of initial capital. The past performance is not a reliable indicator of future results. Be sure to understand risks before making an investment decision.
Go Further
I encourage you to read the complete analyses of McCormick & Company, Incorporated and Conagra Brands, Inc. to enhance your investment decisions: