Conagra Brands, Inc. (CAG) and Lamb Weston Holdings, Inc. (LW) are two prominent players in the packaged foods industry, each with a distinct market focus yet overlapping in consumer packaged goods and foodservice channels. Conagra offers a diverse portfolio of shelf-stable, refrigerated, and frozen products, while Lamb Weston specializes in value-added frozen potato items worldwide. This analysis will help investors identify which company presents a more compelling opportunity based on market position, innovation strategy, and growth potential.
Table of contents
Companies Overview
I will begin the comparison between Conagra Brands, Inc. and Lamb Weston Holdings, Inc. by providing an overview of these two companies and their main differences.
Conagra Brands Overview
Conagra Brands, Inc. is a consumer packaged goods food company based in Chicago, Illinois. It operates primarily in North America through four segments: Grocery & Snacks, Refrigerated & Frozen, International, and Foodservice. The company markets a variety of shelf-stable, refrigerated, frozen, and customized food products under well-known brands such as Birds Eye and Slim Jim, serving retail and foodservice channels.
Lamb Weston Overview
Lamb Weston Holdings, Inc., headquartered in Eagle, Idaho, produces and markets value-added frozen potato products globally. The company operates through four segments: Global, Foodservice, Retail, and Other, serving retail and foodservice customers, including restaurants and grocery stores. Its product portfolio includes frozen potatoes and appetizers under the Lamb Weston brand and various licensed and retailer brands.
Key similarities and differences
Both companies operate in the packaged foods industry with a focus on retail and foodservice channels. Conagra offers a broader product range across multiple food categories and temperature states, while Lamb Weston specializes in frozen potato products and related items. Conagra’s market cap stands at approximately 7.98B USD, larger than Lamb Weston’s 5.77B USD, reflecting differences in scale and product diversification.
Income Statement Comparison
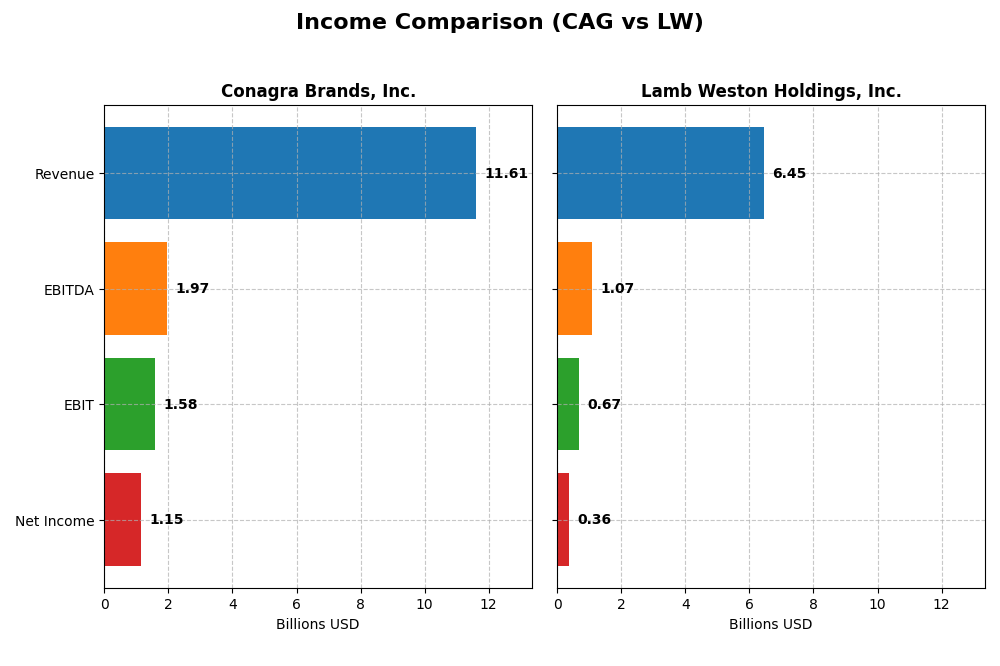
Below is a side-by-side comparison of key income statement metrics for Conagra Brands, Inc. and Lamb Weston Holdings, Inc. for the fiscal year 2025.
| Metric | Conagra Brands, Inc. (CAG) | Lamb Weston Holdings, Inc. (LW) |
|---|---|---|
| Market Cap | 7.98B | 5.77B |
| Revenue | 11.61B | 6.45B |
| EBITDA | 1.97B | 1.07B |
| EBIT | 1.58B | 665M |
| Net Income | 1.15B | 357M |
| EPS | 2.41 | 2.51 |
| Fiscal Year | 2025 | 2025 |
Income Statement Interpretations
Conagra Brands, Inc.
Conagra’s revenue showed a slight decline in 2025 to $11.6B from $12.1B in 2024, while net income surged to $1.15B from $347M. Margins improved notably, with gross margin at 25.86% and net margin nearly 10%, reflecting better profitability despite softer top-line growth. The strong EBIT margin of 13.57% and EPS growth highlight operational efficiency gains in the latest year.
Lamb Weston Holdings, Inc.
Lamb Weston experienced relatively flat revenue in 2025 at $6.45B, down marginally from $6.47B in 2024, with net income declining sharply to $357M from $726M. Margins contracted, with gross margin falling to 21.68% and net margin down to 5.54%. EBIT margin also decreased to 10.31%, indicating profitability pressures and weaker operational performance in the most recent fiscal year.
Which one has the stronger fundamentals?
Conagra presents stronger fundamentals with favorable margins, improved profitability metrics, and a positive income statement growth outlook despite a modest revenue decline. Lamb Weston shows higher overall revenue growth over the period but faces margin compression and declining recent profitability. Conagra’s income statement evaluation is globally favorable, whereas Lamb Weston’s stands neutral due to mixed performance indicators.
Financial Ratios Comparison
This table presents the most recent key financial ratios for Conagra Brands, Inc. (CAG) and Lamb Weston Holdings, Inc. (LW) based on their 2025 fiscal year data.
| Ratios | Conagra Brands, Inc. (CAG) | Lamb Weston Holdings, Inc. (LW) |
|---|---|---|
| ROE | 12.9% | 20.6% |
| ROIC | 7.4% | 7.4% |
| P/E | 9.30 | 22.21 |
| P/B | 1.20 | 4.56 |
| Current Ratio | 0.71 | 1.38 |
| Quick Ratio | 0.24 | 0.68 |
| D/E (Debt-to-Equity) | 0.93 | 2.39 |
| Debt-to-Assets | 39.7% | 56.2% |
| Interest Coverage | 3.27 | 3.70 |
| Asset Turnover | 0.55 | 0.87 |
| Fixed Asset Turnover | 4.09 | 1.68 |
| Payout ratio | 58.1% | 57.9% |
| Dividend yield | 6.25% | 2.61% |
Interpretation of the Ratios
Conagra Brands, Inc.
Conagra Brands shows a mixed ratio profile with favorable valuation metrics such as a price-to-earnings ratio of 9.3 and a price-to-book ratio of 1.2, alongside a strong fixed asset turnover of 4.09. However, liquidity ratios are weak, with a current ratio of 0.71 and quick ratio of 0.24, indicating potential short-term solvency concerns. The company pays dividends, yielding 6.25%, supported by a neutral payout coverage and moderate risk of unsustainable distributions.
Lamb Weston Holdings, Inc.
Lamb Weston exhibits strong profitability ratios, including a high return on equity of 20.56%, but shows weaknesses in leverage and liquidity with a debt-to-equity ratio of 2.39 and a quick ratio of 0.68, reflecting financial risk. The dividend yield stands at 2.61%, considered favorable, though the payout ratio and share buybacks need monitoring for sustainability amid a slightly unfavorable overall ratio assessment.
Which one has the best ratios?
Conagra Brands holds a slightly favorable overall ratio profile, balancing valuation strength against liquidity challenges, while Lamb Weston faces more unfavorable leverage and liquidity ratios despite robust profitability. Considering the mix of strong and weak metrics, Conagra’s ratios appear more balanced, whereas Lamb Weston’s higher financial risk weighs on its global evaluation.
Strategic Positioning
This section compares the strategic positioning of Conagra Brands, Inc. and Lamb Weston Holdings, Inc. across market position, key segments, and exposure to technological disruption:
Conagra Brands, Inc.
- Large market cap of 7.98B with diverse packaged foods; faces broad competitive pressure in food industry.
- Operates four segments: Grocery & Snacks, Refrigerated & Frozen, International, and Foodservice driving revenues.
- No explicit mention of technological disruption exposure in available data.
Lamb Weston Holdings, Inc.
- Smaller market cap of 5.77B, focused on value-added frozen potato products; competitive in niche frozen foods.
- Four segments: Global, Foodservice, Retail, and Other, mainly focused on frozen potatoes and related products.
- No explicit mention of technological disruption exposure in available data.
Conagra Brands, Inc. vs Lamb Weston Holdings, Inc. Positioning
Conagra exhibits a diversified business model across multiple food segments and markets, providing broader revenue streams but facing complex competitive dynamics. Lamb Weston concentrates on frozen potato products, specializing in a narrower but focused market segment with potentially more targeted operational expertise.
Which has the best competitive advantage?
Both companies show slightly favorable moats with ROIC above WACC, indicating value creation; however, both face declining profitability trends, implying challenges in sustaining competitive advantages over time.
Stock Comparison
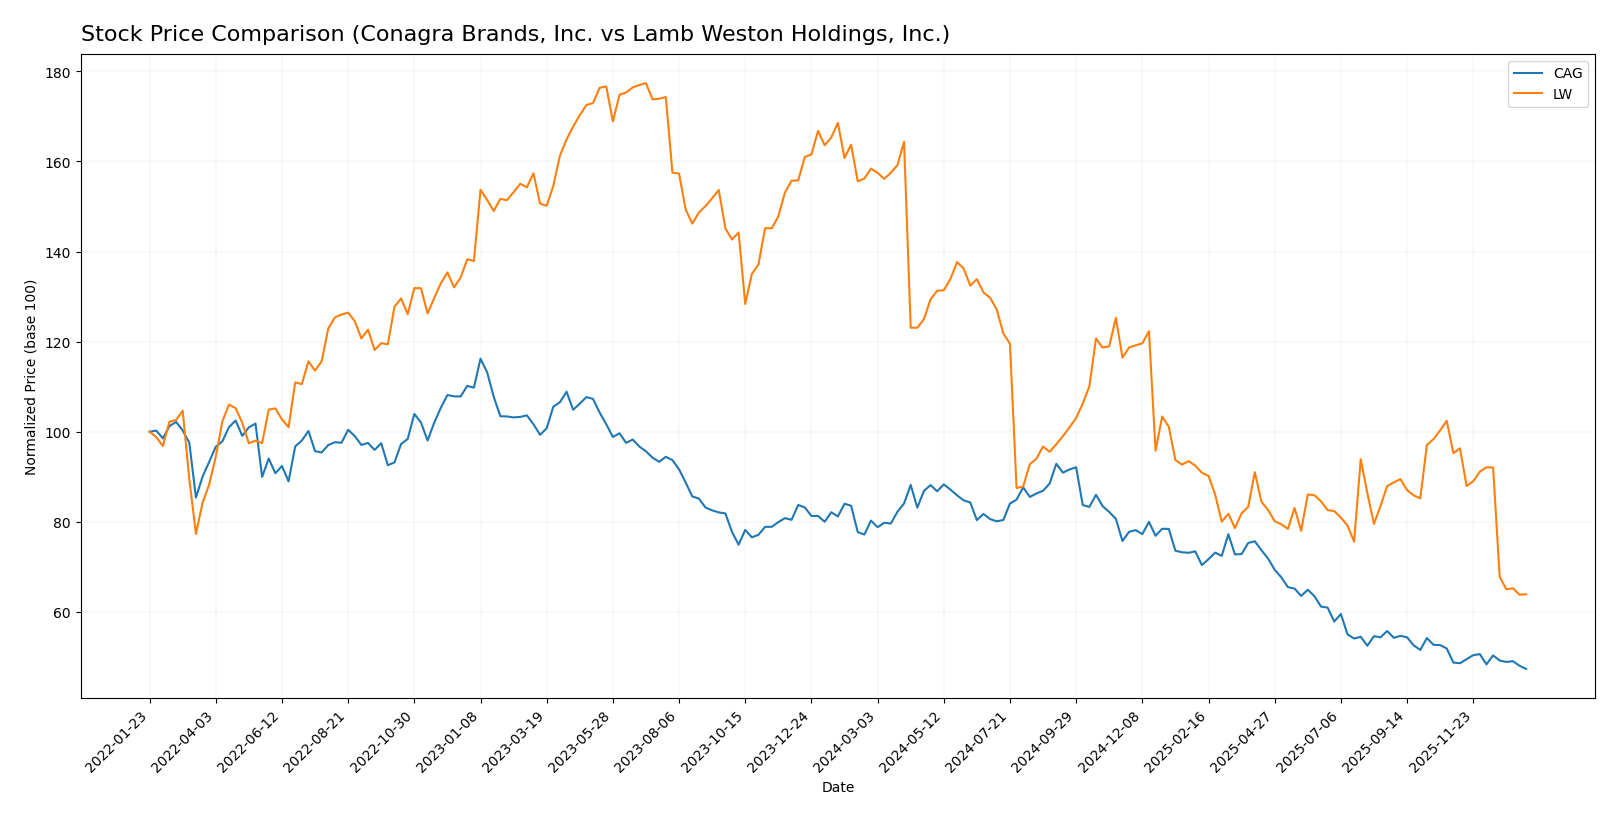
The past year reveals pronounced bearish trends for both Conagra Brands, Inc. (CAG) and Lamb Weston Holdings, Inc. (LW), marked by substantial price declines and contrasting patterns of acceleration and deceleration in their stock movements.
Trend Analysis
Conagra Brands, Inc. (CAG) experienced a 41.02% price decline over the past 12 months, confirming a bearish trend with accelerating downward momentum. The stock price fluctuated between $32.74 and $16.69, with moderate volatility at 4.93.
Lamb Weston Holdings, Inc. (LW) recorded a sharper 59.65% drop over the same period, also bearish but with decelerating negative momentum. LW’s price ranged from $106.53 to $41.37, exhibiting higher volatility at 15.2.
Comparing these trends, both stocks are bearish, but CAG outperformed LW, delivering a less severe decline and demonstrating more acceleration in its price drop.
Target Prices
The current analyst consensus provides clear target price ranges for Conagra Brands, Inc. and Lamb Weston Holdings, Inc.
| Company | Target High | Target Low | Consensus |
|---|---|---|---|
| Conagra Brands, Inc. | 22 | 16 | 18.6 |
| Lamb Weston Holdings, Inc. | 68 | 46 | 52.67 |
Analysts expect Conagra’s stock to trade modestly above the current price of $16.68, indicating limited upside potential. Lamb Weston’s consensus target at $52.67 suggests a significant potential gain from its current $41.43 market price.
Analyst Opinions Comparison
This section compares analysts’ ratings and grades for Conagra Brands, Inc. (CAG) and Lamb Weston Holdings, Inc. (LW):
Rating Comparison
CAG Rating
- Rating: B-, considered very favorable overall.
- Discounted Cash Flow Score: 5, rated very favorable for cash flow projections.
- Return on Equity Score: 1, very unfavorable efficiency in generating profit from equity.
- Return on Assets Score: 1, very unfavorable asset utilization.
- Debt To Equity Score: 2, moderate financial risk with balanced debt levels.
- Overall Score: 2, moderate overall financial standing.
LW Rating
- Rating: B, considered very favorable overall.
- Discounted Cash Flow Score: 4, rated favorable for cash flow projections.
- Return on Equity Score: 5, very favorable efficiency in generating profit from equity.
- Return on Assets Score: 4, favorable asset utilization.
- Debt To Equity Score: 1, very unfavorable indicating higher financial risk from debt levels.
- Overall Score: 3, moderate overall financial standing but higher than CAG.
Which one is the best rated?
Based strictly on the provided data, LW holds a higher overall score (3 vs. 2) and stronger profitability metrics (ROE and ROA), while CAG outperforms in discounted cash flow and has a better debt-to-equity score. LW is generally better rated.
Scores Comparison
Here is the comparison of scores for Conagra Brands, Inc. (CAG) and Lamb Weston Holdings, Inc. (LW):
CAG Scores
- Altman Z-Score: 1.48, indicating financial distress and high bankruptcy risk.
- Piotroski Score: 3, classified as very weak financial strength.
LW Scores
- Altman Z-Score: 2.75, in the grey zone with moderate bankruptcy risk.
- Piotroski Score: 9, classified as very strong financial health.
Which company has the best scores?
Based strictly on the provided data, LW has higher scores, with a better Altman Z-Score in the grey zone and a very strong Piotroski Score. CAG shows distress and very weak financial strength.
Grades Comparison
Here is a comparison of the latest reliable grades assigned to Conagra Brands, Inc. and Lamb Weston Holdings, Inc.:
Conagra Brands, Inc. Grades
The following table summarizes recent grades from major financial institutions for Conagra Brands, Inc.:
| Grading Company | Action | New Grade | Date |
|---|---|---|---|
| Wells Fargo | Maintain | Equal Weight | 2026-01-05 |
| UBS | Maintain | Neutral | 2025-12-23 |
| Morgan Stanley | Maintain | Equal Weight | 2025-12-22 |
| Deutsche Bank | Maintain | Hold | 2025-12-22 |
| RBC Capital | Maintain | Sector Perform | 2025-12-22 |
| Evercore ISI Group | Maintain | In Line | 2025-12-22 |
| TD Cowen | Maintain | Hold | 2025-12-22 |
| B of A Securities | Maintain | Underperform | 2025-12-22 |
| JP Morgan | Maintain | Neutral | 2025-12-16 |
| Wells Fargo | Maintain | Equal Weight | 2025-12-12 |
Overall, Conagra’s grades generally indicate a neutral to slightly cautious stance, with most ratings clustered around Hold or Equal Weight.
Lamb Weston Holdings, Inc. Grades
The following table presents recent grades for Lamb Weston Holdings, Inc. from reputable grading companies:
| Grading Company | Action | New Grade | Date |
|---|---|---|---|
| Wells Fargo | Maintain | Overweight | 2025-12-23 |
| Barclays | Maintain | Overweight | 2025-12-23 |
| B of A Securities | Maintain | Neutral | 2025-12-22 |
| Stifel | Maintain | Hold | 2025-12-22 |
| Deutsche Bank | Maintain | Hold | 2025-12-22 |
| Wells Fargo | Maintain | Overweight | 2025-10-01 |
| B of A Securities | Maintain | Neutral | 2025-10-01 |
| Barclays | Maintain | Overweight | 2025-07-25 |
| Wells Fargo | Maintain | Overweight | 2025-07-24 |
| Wells Fargo | Maintain | Overweight | 2025-07-09 |
Lamb Weston’s grades predominantly reflect a positive outlook, with multiple Overweight ratings suggesting confidence in the stock’s potential.
Which company has the best grades?
Lamb Weston Holdings, Inc. has received comparatively better grades, featuring several Overweight ratings, while Conagra Brands, Inc. mostly holds neutral and Hold grades. For investors, Lamb Weston’s stronger grades may imply higher expectations for performance, whereas Conagra’s more cautious ratings suggest tempered growth prospects.
Strengths and Weaknesses
Below is a comparison table highlighting the key strengths and weaknesses of Conagra Brands, Inc. (CAG) and Lamb Weston Holdings, Inc. (LW) based on recent financial and operational data:
| Criterion | Conagra Brands, Inc. (CAG) | Lamb Weston Holdings, Inc. (LW) |
|---|---|---|
| Diversification | Broad product mix: Grocery & Snacks, Frozen, International; strong Foodservice segment | Focused on Foodservice and Global segments; less diversified product portfolio |
| Profitability | Net margin ~9.9%, ROE 12.9%, ROIC 7.36% – Neutral to slightly favorable | Net margin ~5.5%, ROE 20.6% (favorable), ROIC 7.43% – Mixed but with strong equity returns |
| Innovation | Moderate innovation with steady product offerings and market presence | Innovation focused on frozen potato products, moderate growth in retail segment |
| Global presence | Significant International revenue (~$957M in 2025) | Global segment ~ $2.93B in 2023, expanding international reach |
| Market Share | Large presence in grocery and frozen foods with stable revenue streams | Strong position in frozen potato products, growing foodservice market share |
Key takeaways: Both companies are creating value with ROIC above WACC, but both face declining profitability trends. Conagra offers broader diversification and stable margins, while Lamb Weston excels in ROE and international growth but carries higher leverage and less diversification. Investors should weigh stability against growth potential and risk.
Risk Analysis
Below is a comparative table summarizing key risk factors for Conagra Brands, Inc. (CAG) and Lamb Weston Holdings, Inc. (LW) based on the latest 2025 financial and market data:
| Metric | Conagra Brands, Inc. (CAG) | Lamb Weston Holdings, Inc. (LW) |
|---|---|---|
| Market Risk | Low beta (-0.014) indicates low market volatility exposure | Moderate beta (0.442) shows moderate market sensitivity |
| Debt level | Debt to equity 0.93 (neutral); debt to assets 39.7% (neutral) | Debt to equity 2.39 (unfavorable); debt to assets 56.21% (unfavorable) |
| Regulatory Risk | Moderate, typical for packaged foods industry | Moderate, similar industry regulatory environment |
| Operational Risk | Neutral; stable asset turnover (0.55) and fixed asset turnover favorable (4.09) | Neutral; decent asset turnover (0.87) but fixed asset turnover lower (1.68) |
| Environmental Risk | Standard for food production; no recent significant issues reported | Standard for food production; no recent significant issues reported |
| Geopolitical Risk | US-based but with international operations, moderate exposure | US-based global operations, moderate exposure |
In synthesis, Conagra Brands presents lower market risk and more balanced debt levels, but shows liquidity concerns (low current and quick ratios). Lamb Weston carries higher financial leverage and less favorable debt metrics, increasing financial risk. The most impactful risks are Lamb Weston’s elevated debt burden and Conagra’s liquidity constraints, which could affect their resilience in economic downturns or rising interest rate environments. Investors should monitor these financial health indicators closely.
Which Stock to Choose?
Conagra Brands, Inc. (CAG) shows a slightly favorable financial profile with a favorable income statement marked by strong EBIT and net margin growth in 2025, despite a recent revenue decline. Its financial ratios are mostly neutral to favorable, supported by a low P/E and WACC, though liquidity ratios remain weak. The company’s rating is very favorable (B-) with mixed score evaluations, including a distress zone Altman Z-Score and very weak Piotroski score, indicating financial caution.
Lamb Weston Holdings, Inc. (LW) presents a neutral income statement due to significant recent declines in profitability metrics despite strong overall revenue and EPS growth since 2021. Its financial ratios are slightly unfavorable, with high debt levels and a high P/B ratio, but it benefits from a very favorable rating (B) and strong Piotroski score, along with a grey zone Altman Z-Score. LW’s recent price trend is more volatile and bearish than CAG’s.
Investors focused on value and stable financial footing might find CAG’s slightly favorable ratios and improving profitability appealing, while those with a tolerance for higher risk and seeking growth potential could view LW’s strong equity returns and robust financial strength scores as more attractive. Both companies exhibit declining profitability trends, which might suggest prudence in timing investment decisions.
Disclaimer: Investment carries a risk of loss of initial capital. The past performance is not a reliable indicator of future results. Be sure to understand risks before making an investment decision.
Go Further
I encourage you to read the complete analyses of Conagra Brands, Inc. and Lamb Weston Holdings, Inc. to enhance your investment decisions: