JBS N.V. and Conagra Brands, Inc. are two key players in the packaged foods industry, each with distinct approaches to market presence and innovation. JBS, a global protein powerhouse, contrasts with Conagra’s diversified consumer packaged goods portfolio focused primarily on North America. Their overlapping sectors and strategic innovation efforts make them compelling candidates for comparison. In this article, I will help you decide which company stands out as the smarter investment choice.
Table of contents
Companies Overview
I will begin the comparison between JBS N.V. and Conagra Brands, Inc. by providing an overview of these two companies and their main differences.
JBS N.V. Overview
JBS N.V. is a global protein and food company headquartered in Amstelveen, Netherlands. Founded in 1953, it operates in diverse areas including beef, pork, chicken, fish, and plant-based products. Beyond food, JBS is involved in leather, biodiesel, industrial waste management, logistics, and electric power production, positioning itself as a vertically integrated leader in the packaged foods industry with 280K employees worldwide.
Conagra Brands, Inc. Overview
Conagra Brands, based in Chicago, Illinois, is a consumer packaged goods company focused on North America. Established in 1861, it operates across four segments: Grocery & Snacks, Refrigerated & Frozen, International, and Foodservice. Conagra markets well-known brands such as Birds Eye and Duncan Hines, emphasizing shelf-stable and temperature-controlled food products with a workforce of 18.5K employees, serving retail and foodservice channels.
Key similarities and differences
Both JBS and Conagra operate in the consumer defensive sector within the packaged foods industry. While JBS has a broad global footprint with diversified activities including protein production and by-products, Conagra concentrates on branded food products primarily in North America. JBS’s scale and vertical integration contrast with Conagra’s focus on branded consumer packaged goods and multiple food segments. Their workforce size and market caps also reflect these operational differences.
Income Statement Comparison
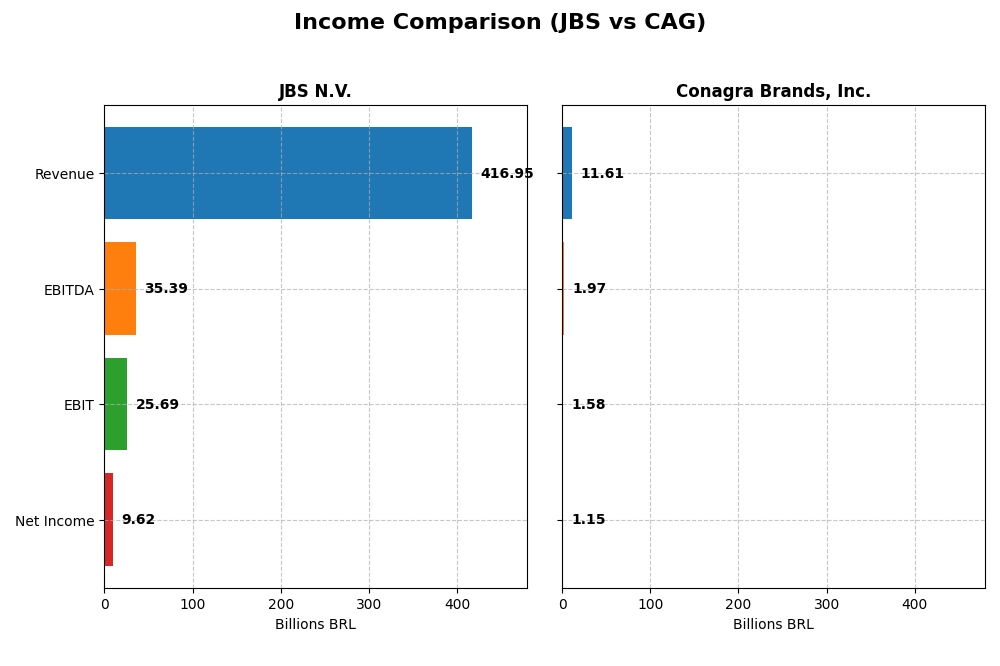
This table presents a side-by-side comparison of key income statement metrics for JBS N.V. and Conagra Brands, Inc. for their most recent fiscal years.
| Metric | JBS N.V. (2024) | Conagra Brands, Inc. (2025) |
|---|---|---|
| Market Cap | 31.7B BRL | 7.98B USD |
| Revenue | 417B BRL | 11.6B USD |
| EBITDA | 35.4B BRL | 1.97B USD |
| EBIT | 25.7B BRL | 1.58B USD |
| Net Income | 9.62B BRL | 1.15B USD |
| EPS | 30.55 BRL | 2.41 USD |
| Fiscal Year | 2024 | 2025 |
Income Statement Interpretations
JBS N.V.
JBS N.V. demonstrated strong revenue growth, rising 54.3% over 2020-2024, and a more than doubling of net income in the same period. Margins remained generally stable, with a gross margin near 15% and a net margin around 2.3%. The 2024 fiscal year saw favorable improvements, including a 14.6% revenue increase and a remarkable 890.8% net margin growth, indicating robust profitability recovery.
Conagra Brands, Inc.
Conagra Brands showed modest revenue growth of 3.8% from 2021 to 2025 but experienced an 11.3% decline in net income over the period. Margins were comparatively stronger than JBS, with a gross margin of 25.9% and net margin near 9.9%, both rated favorable. The latest year saw a 3.6% revenue decline but improvements in EBIT and net margin, reflecting operational efficiency gains despite top-line pressure.
Which one has the stronger fundamentals?
JBS exhibits strong revenue and net income growth, with consistent margin stability and robust recent profitability improvements, presenting a largely favorable income statement profile. Conagra benefits from higher margins and operational efficiency but faces declining net income and revenue contraction. Overall, JBS’s growth momentum contrasts with Conagra’s mixed performance, highlighting differing fundamental strengths and challenges.
Financial Ratios Comparison
The following table compares key financial ratios for JBS N.V. and Conagra Brands, Inc. based on their most recent fiscal year data.
| Ratios | JBS N.V. (2024) | Conagra Brands, Inc. (2025) |
|---|---|---|
| ROE | 21.47% | 12.90% |
| ROIC | 8.61% | 7.36% |
| P/E | 3.20 | 9.30 |
| P/B | 0.69 | 1.20 |
| Current Ratio | 1.47 | 0.71 |
| Quick Ratio | 0.90 | 0.24 |
| D/E (Debt-to-Equity) | 3.01 | 0.93 |
| Debt-to-Assets | 53.56% | 39.70% |
| Interest Coverage | 2.33 | 3.27 |
| Asset Turnover | 1.65 | 0.55 |
| Fixed Asset Turnover | 4.85 | 4.09 |
| Payout Ratio | 46.14% | 58.07% |
| Dividend Yield | 14.42% | 6.25% |
Interpretation of the Ratios
JBS N.V.
JBS shows a mixed ratio profile with strong return on equity (21.47%) and favorable valuation metrics like PE at 3.2 and PB at 0.69, indicating undervaluation. However, concerns exist around leverage with a debt-to-equity ratio of 3.01 and debt-to-assets of 53.56%. The dividend yield stands at 14.42%, supported by consistent payouts but with caution due to leverage levels.
Conagra Brands, Inc.
Conagra’s ratios reflect moderate performance with neutral net margin (9.92%), ROE (12.9%), and ROIC (7.36%). Liquidity ratios are weak, with a current ratio of 0.71 and quick ratio of 0.24, suggesting short-term solvency risks. The dividend yield is 6.25%, supported by a balanced payout and manageable debt-to-equity of 0.93, signaling moderate shareholder returns.
Which one has the best ratios?
JBS presents a stronger return profile and more favorable valuation ratios but carries higher leverage and liquidity risk. Conagra offers more balanced leverage and moderate returns but weaker liquidity. Both have slightly favorable global ratio opinions, with JBS leaning towards higher risk and Conagra showing more stability.
Strategic Positioning
This section compares the strategic positioning of JBS and Conagra Brands, covering Market position, Key segments, and Exposure to technological disruption:
JBS
- Global protein and food company with broad product range faces competitive pressure globally.
- Diverse segments including beef, pork, poultry, fish, plant-based foods, leather, and biodiesel.
- No explicit mention of technological disruption exposure in available data.
Conagra Brands
- North American consumer packaged goods leader with steady competition in packaged foods.
- Four segments: Grocery & Snacks, Refrigerated & Frozen, International, and Foodservice.
- No explicit mention of technological disruption exposure in available data.
JBS vs Conagra Brands Positioning
JBS pursues a highly diversified global strategy across many protein and related products, while Conagra focuses on four specific segments primarily in North America. JBS’s broad scope may add complexity; Conagra’s concentration might allow focused management.
Which has the best competitive advantage?
Both companies demonstrate slightly favorable moats with ROIC above WACC but declining profitability trends. JBS shows a higher ROIC premium, suggesting a marginally stronger value creation despite decline.
Stock Comparison
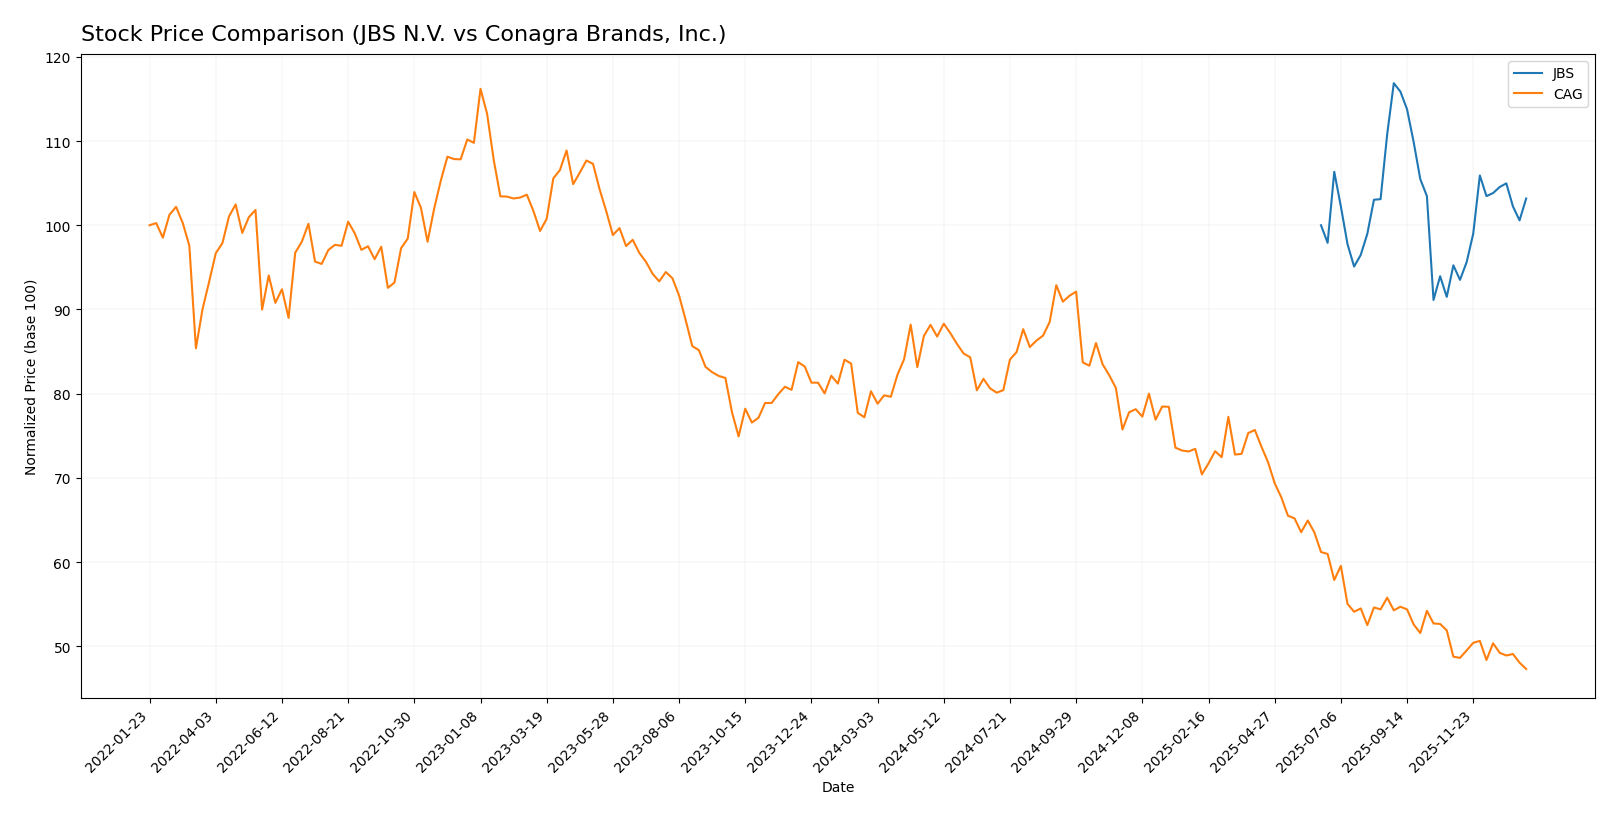
The stock price movements of JBS N.V. and Conagra Brands, Inc. over the past year reveal contrasting trading dynamics, with JBS showing a moderate upward trajectory while Conagra Brands experiences a significant decline.
Trend Analysis
JBS N.V. has exhibited a bullish trend over the past 12 months with a 3.17% price increase, showing acceleration and a relatively low volatility of 0.9 standard deviation. The stock reached a high of 16.21 and a low of 12.64.
Conagra Brands, Inc. experienced a bearish trend over the same period, with a sharp 41.08% price decrease and accelerating decline. The stock showed high volatility, with a standard deviation of 4.93, and traded between 32.74 and 16.68.
Comparing both stocks over the past year, JBS N.V. delivered the highest market performance, contrasting with Conagra Brands’ substantial loss and higher volatility.
Target Prices
Analysts provide a positive target price consensus for these companies, indicating potential upside from current levels.
| Company | Target High | Target Low | Consensus |
|---|---|---|---|
| JBS N.V. | 20 | 17 | 18.5 |
| Conagra Brands, Inc. | 22 | 16 | 18.6 |
The consensus target prices for JBS N.V. and Conagra Brands, Inc. exceed their current stock prices of 14.31 and 16.68 respectively, suggesting moderate analyst expectations for appreciation.
Analyst Opinions Comparison
This section compares analysts’ ratings and grades for JBS N.V. and Conagra Brands, Inc.:
Rating Comparison
JBS Rating
- Rating: A, indicating a very favorable overall assessment by analysts.
- Discounted Cash Flow Score: 4, a favorable score suggesting good valuation based on cash flow.
- ROE Score: 5, very favorable, indicating excellent profit generation from shareholders’ equity.
- ROA Score: 5, very favorable, reflecting effective asset utilization to generate earnings.
- Debt To Equity Score: 1, very unfavorable, implying high financial risk due to leverage.
- Overall Score: 4, favorable, summarizing strong financial metrics overall.
CAG Rating
- Rating: B-, also considered very favorable, but lower than JBS’s rating.
- Discounted Cash Flow Score: 5, very favorable, showing strong future cash flow projections.
- ROE Score: 1, very unfavorable, showing weak efficiency in generating profit from equity.
- ROA Score: 1, very unfavorable, indicating poor asset efficiency.
- Debt To Equity Score: 2, moderate, showing better but still cautious financial stability.
- Overall Score: 2, moderate, indicating more mixed financial performance.
Which one is the best rated?
Based strictly on the provided data, JBS holds a superior overall rating (A vs. B-) and higher scores for ROE, ROA, and overall financial standing. CAG excels only in discounted cash flow but lags significantly in profitability and risk metrics.
Scores Comparison
Here is a comparison of the Altman Z-Score and Piotroski Score for JBS N.V. and Conagra Brands, Inc.:
JBS Scores
- Altman Z-Score: 10.74, indicating a safe zone with low bankruptcy risk.
- Piotroski Score: 8, classified as very strong financial health.
CAG Scores
- Altman Z-Score: 1.48, in the distress zone, indicating high bankruptcy risk.
- Piotroski Score: 3, indicating very weak financial health.
Which company has the best scores?
Based strictly on the provided data, JBS N.V. has significantly better financial scores than Conagra Brands, Inc., showing strong financial health and low bankruptcy risk, unlike CAG’s weak and distressed status.
Grades Comparison
Here is a detailed comparison of the latest grades and ratings assigned to JBS N.V. and Conagra Brands, Inc.:
JBS N.V. Grades
The following table summarizes recent grades from verified grading companies for JBS N.V.:
| Grading Company | Action | New Grade | Date |
|---|---|---|---|
| JP Morgan | Maintain | Overweight | 2025-10-14 |
| JP Morgan | Maintain | Overweight | 2025-09-03 |
| Stephens & Co. | Maintain | Overweight | 2025-08-15 |
| Stephens & Co. | Maintain | Overweight | 2025-06-26 |
JBS N.V. has consistently received an “Overweight” rating, indicating a favorable outlook maintained over several months.
Conagra Brands, Inc. Grades
The following table summarizes recent grades from verified grading companies for Conagra Brands, Inc.:
| Grading Company | Action | New Grade | Date |
|---|---|---|---|
| Wells Fargo | Maintain | Equal Weight | 2026-01-05 |
| UBS | Maintain | Neutral | 2025-12-23 |
| Morgan Stanley | Maintain | Equal Weight | 2025-12-22 |
| Deutsche Bank | Maintain | Hold | 2025-12-22 |
| RBC Capital | Maintain | Sector Perform | 2025-12-22 |
| Evercore ISI Group | Maintain | In Line | 2025-12-22 |
| TD Cowen | Maintain | Hold | 2025-12-22 |
| B of A Securities | Maintain | Underperform | 2025-12-22 |
| JP Morgan | Maintain | Neutral | 2025-12-16 |
| Wells Fargo | Maintain | Equal Weight | 2025-12-12 |
Conagra Brands, Inc. shows a broad range of ratings mostly clustered around neutral, hold, or sector perform, with one underperform rating, reflecting a mixed but generally cautious market view.
Which company has the best grades?
JBS N.V. has received clearly more positive and consistent grades, with multiple “Overweight” ratings, signaling stronger analyst confidence compared to Conagra Brands, Inc., whose grades mostly range from “Hold” to “Equal Weight.” For investors, this suggests JBS is viewed more favorably by analysts, potentially implying stronger growth expectations or relative strength in its sector.
Strengths and Weaknesses
Below is a comparison of key strengths and weaknesses for JBS N.V. and Conagra Brands, Inc., based on recent financial data and market performance.
| Criterion | JBS N.V. | Conagra Brands, Inc. |
|---|---|---|
| Diversification | Strong global meat processing, but less diversified product range | Broad food portfolio including snacks, frozen, and international segments |
| Profitability | Moderate net margin (2.31%, unfavorable), high ROE (21.47%, favorable) | Higher net margin (9.92%, neutral), moderate ROE (12.9%, neutral) |
| Innovation | Moderate innovation, stable asset turnover and efficient capital use | Steady innovation in product segments, especially refrigerated and frozen foods |
| Global presence | Significant global footprint, strong asset turnover ratios | Growing international segment but smaller global reach than JBS |
| Market Share | Leading position in meat processing globally | Strong US presence in packaged foods and snacks |
Key takeaways: Both companies create value with slightly favorable moats, though profitability is declining. JBS excels in global presence and capital efficiency, while Conagra offers more diversification in food products, appealing for balanced portfolio exposure.
Risk Analysis
Below is a comparison of key risk factors for JBS N.V. and Conagra Brands, Inc. based on the most recent data from 2025-2026:
| Metric | JBS N.V. | Conagra Brands, Inc. |
|---|---|---|
| Market Risk | Moderate (Beta 0.48) | Low (Beta -0.01) |
| Debt level | High (Debt/Equity 3.01) | Moderate (Debt/Equity 0.93) |
| Regulatory Risk | Elevated (Global operations, food safety scrutiny) | Moderate (US-centric, food regulations) |
| Operational Risk | High (Complex supply chain, global scale) | Moderate (Focused segments) |
| Environmental Risk | Significant (Agriculture, deforestation concerns) | Moderate (Sustainability initiatives) |
| Geopolitical Risk | Elevated (Exposure to Brazil, NL, global markets) | Moderate (Primarily US operations) |
JBS faces the greatest risks from high debt levels and environmental concerns related to agriculture and deforestation. Its global footprint adds regulatory and geopolitical complexity. Conagra’s lower debt and US focus reduce some risks but operational and liquidity concerns remain. JBS shows strong financial stability scores, while Conagra’s distress-zone bankruptcy risk and weak financial strength warrant caution.
Which Stock to Choose?
JBS N.V. shows a favorable income evolution with strong revenue and profit growth, supported by a slightly favorable financial ratio profile. It exhibits high profitability with a 21.47% ROE, moderate debt levels, and a very favorable overall rating of A. Its economic moat is slightly favorable, indicating value creation despite declining ROIC.
Conagra Brands, Inc. has a mixed income evolution marked by some recent revenue decline but favorable margins. Its financial ratios are slightly favorable, with moderate profitability (12.9% ROE), manageable debt, and a very favorable rating of B-. The company’s economic moat is also slightly favorable but with a declining ROIC trend.
Investors focused on growth and strong profitability might find JBS more appealing given its robust income growth and superior financial ratings, whereas those preferring a company with stable margins but moderate overall financial scores might consider Conagra’s profile. The choice may depend on risk tolerance and investment strategy.
Disclaimer: Investment carries a risk of loss of initial capital. The past performance is not a reliable indicator of future results. Be sure to understand risks before making an investment decision.
Go Further
I encourage you to read the complete analyses of JBS N.V. and Conagra Brands, Inc. to enhance your investment decisions: