Investors seeking stability and growth often turn to the packaged foods sector, where Hormel Foods Corporation (HRL) and Conagra Brands, Inc. (CAG) stand out as industry leaders. Both companies compete in overlapping markets, offering diverse product lines and pursuing innovation to capture consumer preferences. This article will analyze their strategies and performance to help you decide which stock may be the better addition to your investment portfolio.
Table of contents
Companies Overview
I will begin the comparison between Hormel Foods Corporation and Conagra Brands, Inc. by providing an overview of these two companies and their main differences.
Hormel Foods Corporation Overview
Hormel Foods Corporation is a leading player in the packaged foods industry, focused on developing, processing, and distributing meat, nuts, and other food products. Operating through four segments, it serves retail, foodservice, deli, and commercial customers primarily in the US and internationally. Hormel’s portfolio includes well-known brands such as SKIPPY, SPAM, and Jennie-O, emphasizing a diverse range of perishable and shelf-stable products.
Conagra Brands, Inc. Overview
Conagra Brands, Inc. operates as a consumer packaged goods food company in North America, with four main segments covering grocery, snacks, refrigerated, frozen, international, and foodservice channels. It markets popular brands like Birds Eye, Duncan Hines, and Slim Jim. The company targets retail and foodservice customers, offering branded and customized food products designed for various temperature states, primarily within the US and abroad.
Key similarities and differences
Both Hormel and Conagra operate in the packaged foods sector, serving retail and foodservice clients with diverse product lines. Hormel emphasizes meat and protein-based products, while Conagra offers a broader mix including snacks and frozen foods. Each company has multiple operational segments addressing different food categories and markets, but Conagra has a stronger focus on customized foodservice solutions and international reach compared to Hormel’s meat-centric portfolio.
Income Statement Comparison
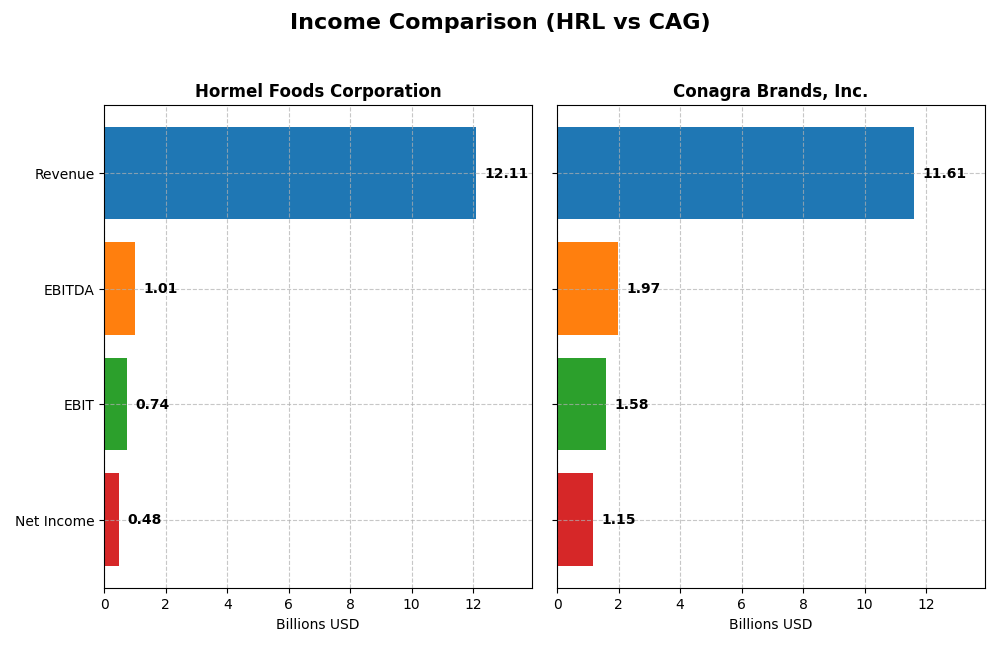
This table provides a side-by-side comparison of key income statement metrics for Hormel Foods Corporation and Conagra Brands, Inc. for their most recent fiscal year.
| Metric | Hormel Foods Corporation | Conagra Brands, Inc. |
|---|---|---|
| Market Cap | 12.6B | 8.0B |
| Revenue | 12.11B | 11.61B |
| EBITDA | 1.01B | 1.97B |
| EBIT | 742M | 1.58B |
| Net Income | 478M | 1.15B |
| EPS | 0.87 | 2.41 |
| Fiscal Year | 2025 | 2025 |
Income Statement Interpretations
Hormel Foods Corporation
Hormel Foods showed relatively stable revenue around 12.1B in the recent years, with a modest 1.55% growth in 2025, but net income declined significantly by 41.5% in the same year. Margins remained mostly neutral, with gross margin at 15.45% and net margin at 3.95%. The 2025 performance revealed weakening profitability, notably with a 33.5% drop in EBIT.
Conagra Brands, Inc.
Conagra Brands experienced slight revenue decline of 3.64% in 2025, with overall revenue growth neutral at 3.83% from 2021 to 2025. Nevertheless, the company improved margins, achieving a favorable gross margin of 25.86% and net margin of 9.92%. Net income surged by 244.4% in 2025, reflecting a strong operational rebound despite a moderate net income decline over the longer term.
Which one has the stronger fundamentals?
Conagra Brands holds stronger fundamentals with favorable margins across gross, EBIT, and net levels, alongside significant recent net income growth. Hormel Foods faces challenges with declining net income and margins, marked by unfavorable income growth indicators. Overall, Conagra’s income statement displays more favorable trends, while Hormel’s shows cautionary signals despite stable revenues.
Financial Ratios Comparison
The table below presents a side-by-side comparison of key financial ratios for Hormel Foods Corporation (HRL) and Conagra Brands, Inc. (CAG) based on their most recent fiscal year data.
| Ratios | Hormel Foods Corporation (HRL) FY 2025 | Conagra Brands, Inc. (CAG) FY 2025 |
|---|---|---|
| ROE | 6.04% | 12.90% |
| ROIC | 4.31% | 7.36% |
| P/E | 24.84 | 9.30 |
| P/B | 1.50 | 1.20 |
| Current Ratio | 2.47 | 0.71 |
| Quick Ratio | 1.20 | 0.24 |
| D/E (Debt-to-Equity) | 0.36 | 0.93 |
| Debt-to-Assets | 21.3% | 39.7% |
| Interest Coverage | 9.21 | 3.27 |
| Asset Turnover | 0.90 | 0.55 |
| Fixed Asset Turnover | 5.41 | 4.09 |
| Payout Ratio | 132.4% | 58.1% |
| Dividend Yield | 5.33% | 6.25% |
Interpretation of the Ratios
Hormel Foods Corporation
Hormel Foods shows a balanced ratio profile with favorable liquidity metrics, including a strong current ratio of 2.47 and a debt-to-equity ratio of 0.36, indicating sound financial stability. However, profitability ratios such as net margin at 3.95% and return on equity at 6.04% are less robust, raising some caution. The company offers a dividend yield of 5.33%, reflecting moderate shareholder returns with a neutral payout stance.
Conagra Brands, Inc.
Conagra Brands exhibits moderate profitability with a net margin near 9.92% and a return on equity of 12.9%, both neutral in evaluation. Liquidity ratios are weak, with a current ratio of 0.71 and a quick ratio of 0.24, suggesting potential short-term financial stress. The dividend yield stands at 6.25%, indicating consistent shareholder returns, though other ratios like debt level and interest coverage are neutral, highlighting mixed financial health.
Which one has the best ratios?
Hormel Foods has a more favorable liquidity and leverage position, supported by strong coverage and lower debt ratios, while Conagra shows better profitability but weak liquidity. Both companies receive a slightly favorable overall opinion, with Hormel’s financial stability contrasting Conagra’s profitability strengths, making the assessment context-dependent.
Strategic Positioning
This section compares the strategic positioning of Hormel Foods Corporation and Conagra Brands, Inc., including Market position, Key segments, and Exposure to technological disruption:
Hormel Foods Corporation
- Established market presence in packaged foods with 12.6B market cap and low beta of 0.32.
- Diverse segments: Grocery, Refrigerated, Jennie-O Turkey, International; revenue driven by perishable meats and shelf-stable foods.
- No explicit data on exposure to technological disruption provided.
Conagra Brands, Inc.
- Smaller market cap at 7.98B, with near-zero beta indicating low market volatility.
- Four segments: Grocery & Snacks, Refrigerated & Frozen, International, Foodservice; focus on shelf-stable and temperature-controlled foods.
- No explicit data on exposure to technological disruption provided.
Hormel Foods Corporation vs Conagra Brands, Inc. Positioning
Hormel demonstrates a diversified product and segment base with strong focus on meats and shelf-stable goods, while Conagra concentrates on grocery, refrigerated, and foodservice segments. Hormel has higher market capitalization, whereas Conagra shows a broader product offering in consumer packaged goods.
Which has the best competitive advantage?
Based on MOAT evaluation, Conagra shows a slightly favorable position by creating value with ROIC above WACC despite declining profitability, whereas Hormel is assessed very unfavorable, destroying value with declining returns.
Stock Comparison
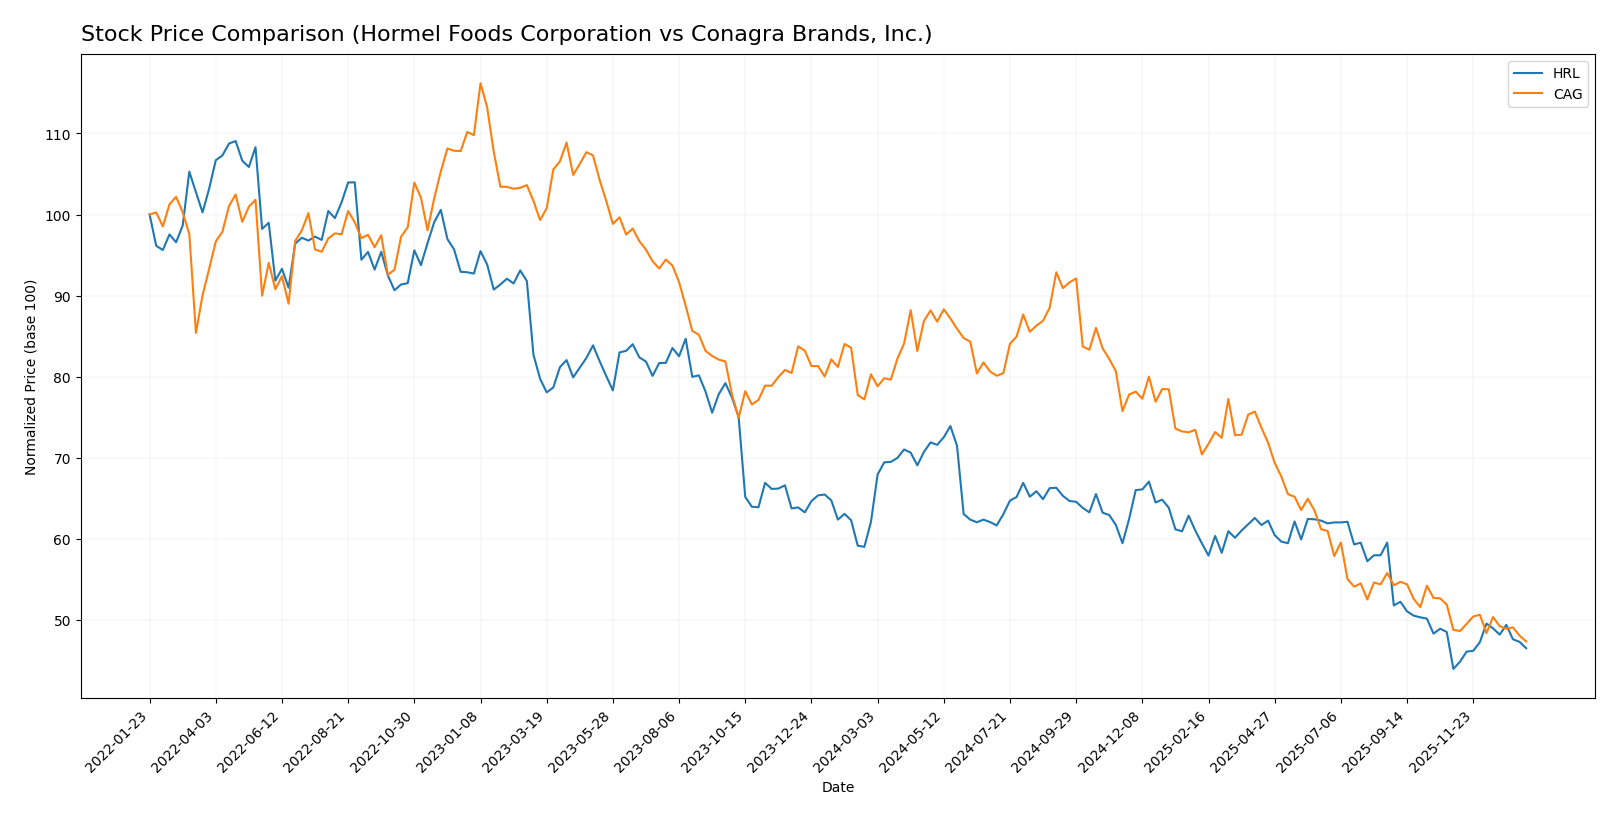
The stock price chart over the past 12 months reveals significant bearish trends for both Hormel Foods Corporation (HRL) and Conagra Brands, Inc. (CAG), with notable acceleration in price declines and varying recent momentum dynamics.
Trend Analysis
Hormel Foods Corporation’s stock experienced a bearish trend, declining 25.11% over the past year with accelerating losses. The price ranged between a high of 36.31 and a low of 21.59, showing moderate volatility with a 3.52 standard deviation. Recent months indicate a mild bullish reversal of 5.84%.
Conagra Brands, Inc. saw a stronger bearish trend, falling 41.02% in the past year with accelerating downward momentum. The stock fluctuated from 32.74 to 16.69, exhibiting higher volatility at a 4.93 standard deviation. Recently, the downtrend persisted with a slight decline of 2.91%.
Comparing the two, Hormel Foods delivered a less severe negative performance than Conagra Brands over the last 12 months, with a recent positive trend contrasting Conagra’s continued decline.
Target Prices
Analysts present a moderate bullish consensus for Hormel Foods Corporation and Conagra Brands, Inc.
| Company | Target High | Target Low | Consensus |
|---|---|---|---|
| Hormel Foods Corporation | 30 | 26 | 27.75 |
| Conagra Brands, Inc. | 22 | 16 | 18.6 |
Target consensus prices suggest potential upside for both stocks compared to current prices: Hormel Foods trades at 22.85, well below its 27.75 consensus, while Conagra Brands trades at 16.68, slightly below its 18.6 consensus.
Analyst Opinions Comparison
This section compares analysts’ ratings and grades for Hormel Foods Corporation (HRL) and Conagra Brands, Inc. (CAG):
Rating Comparison
HRL Rating
- Rating: B, considered Very Favorable by analysts.
- Discounted Cash Flow Score: 4, Favorable valuation outlook.
- ROE Score: 2, Moderate efficiency generating profit.
- ROA Score: 3, Moderate asset utilization.
- Debt To Equity Score: 3, Moderate financial risk.
- Overall Score: 3, Moderate overall financial standing.
CAG Rating
- Rating: B-, also Very Favorable, slightly lower than HRL.
- Discounted Cash Flow Score: 5, Very Favorable, stronger score.
- ROE Score: 1, Very Unfavorable, weaker profitability.
- ROA Score: 1, Very Unfavorable, less effective asset use.
- Debt To Equity Score: 2, Moderate but slightly better balance sheet risk.
- Overall Score: 2, Moderate but lower than HRL.
Which one is the best rated?
Based strictly on the provided data, HRL holds a higher overall rating and scores better on return metrics and overall financial standing. CAG has a stronger discounted cash flow score but weaker profitability and asset use scores, making HRL the better-rated company in this comparison.
Scores Comparison
Here is a comparison of the financial scores for Hormel Foods Corporation and Conagra Brands, Inc.:
HRL Scores
- Altman Z-Score: 5.17, indicating a safe financial zone
- Piotroski Score: 7, categorized as strong financial health
CAG Scores
- Altman Z-Score: 1.48, indicating distress zone
- Piotroski Score: 3, categorized as very weak financial health
Which company has the best scores?
Based on the provided data, HRL shows stronger financial stability with a safe Altman Z-Score and a strong Piotroski Score. CAG is in distress and has a very weak Piotroski Score, indicating higher financial risk.
Grades Comparison
Here is a comparison of the latest available grades and ratings for Hormel Foods Corporation and Conagra Brands, Inc.:
Hormel Foods Corporation Grades
The following table summarizes recent grades and ratings from reputable financial institutions for Hormel Foods Corporation:
| Grading Company | Action | New Grade | Date |
|---|---|---|---|
| Barclays | Maintain | Overweight | 2025-12-09 |
| JP Morgan | Maintain | Overweight | 2025-12-05 |
| B of A Securities | Maintain | Neutral | 2025-12-05 |
| Piper Sandler | Maintain | Neutral | 2025-12-05 |
| JP Morgan | Maintain | Overweight | 2025-11-21 |
| Piper Sandler | Maintain | Neutral | 2025-11-06 |
| Goldman Sachs | Maintain | Buy | 2025-10-30 |
| Goldman Sachs | Maintain | Buy | 2025-08-29 |
| B of A Securities | Maintain | Neutral | 2025-08-29 |
| Barclays | Maintain | Overweight | 2025-08-29 |
Hormel Foods shows a consistent pattern of “Overweight” and “Buy” ratings with several institutions maintaining neutral views, indicating a generally positive outlook.
Conagra Brands, Inc. Grades
The table below lists recent grades and ratings from established grading companies for Conagra Brands, Inc.:
| Grading Company | Action | New Grade | Date |
|---|---|---|---|
| Wells Fargo | Maintain | Equal Weight | 2026-01-05 |
| UBS | Maintain | Neutral | 2025-12-23 |
| Morgan Stanley | Maintain | Equal Weight | 2025-12-22 |
| Deutsche Bank | Maintain | Hold | 2025-12-22 |
| RBC Capital | Maintain | Sector Perform | 2025-12-22 |
| Evercore ISI Group | Maintain | In Line | 2025-12-22 |
| TD Cowen | Maintain | Hold | 2025-12-22 |
| B of A Securities | Maintain | Underperform | 2025-12-22 |
| JP Morgan | Maintain | Neutral | 2025-12-16 |
| Wells Fargo | Maintain | Equal Weight | 2025-12-12 |
Conagra Brands predominantly receives neutral to hold ratings, with some underperform and sector perform assessments, reflecting a more cautious stance.
Which company has the best grades?
Hormel Foods Corporation has received generally more favorable grades, including multiple “Overweight” and “Buy” ratings, compared to Conagra Brands’ mostly neutral and hold ratings. Investors might interpret Hormel’s stronger grades as a signal of relatively higher confidence from analysts.
Strengths and Weaknesses
Below is a comparison of key strengths and weaknesses for Hormel Foods Corporation (HRL) and Conagra Brands, Inc. (CAG) based on their most recent financial and strategic data.
| Criterion | Hormel Foods Corporation (HRL) | Conagra Brands, Inc. (CAG) |
|---|---|---|
| Diversification | Moderate diversification with strong segments in Retail (7.46B), Foodservice (3.94B), and International (709M). | Well-diversified across Grocery & Snacks (4.9B), Refrigerated & Frozen (4.66B), Foodservice (1.09B), and International (957M). |
| Profitability | Low profitability: net margin 3.95%, ROIC 4.31% below WACC (4.86%), declining ROIC trend, value destroying. | Moderate profitability: net margin 9.92%, ROIC 7.36% above WACC (4.33%), slightly favorable value creation but declining ROIC. |
| Innovation | Limited data on innovation; steady but no notable growth in ROIC. | No explicit innovation metrics; steady ROIC but slight decline signals need for renewed growth initiatives. |
| Global presence | Smaller international segment (709M) compared to total revenue; mainly US-focused. | Larger international exposure (957M) and diverse product portfolio with global reach. |
| Market Share | Strong in perishable meat and retail sectors but shrinking profitability. | Strong in grocery, snacks, and frozen foods with better price valuation (PE 9.3 vs 24.8 for HRL). |
In summary, Conagra Brands shows better profitability and a more balanced product and geographic diversification than Hormel Foods, which struggles with declining returns and value destruction despite solid segment revenues. Both companies face challenges in maintaining ROIC growth, urging caution for investors prioritizing sustainable profitability.
Risk Analysis
Below is a comparative overview of key risks for Hormel Foods Corporation (HRL) and Conagra Brands, Inc. (CAG) based on the latest 2025 financial data and relevant market factors.
| Metric | Hormel Foods Corporation (HRL) | Conagra Brands, Inc. (CAG) |
|---|---|---|
| Market Risk | Low beta (0.32) indicates resilience to market volatility | Near zero beta (-0.01), very low market sensitivity |
| Debt Level | Conservative debt-to-equity (0.36) and debt/assets (21.3%) | Higher leverage, debt-to-equity ~0.93, debt/assets ~39.7% |
| Regulatory Risk | Moderate, typical for packaged foods industry | Moderate, with exposure in North America and international markets |
| Operational Risk | Solid liquidity ratios (current 2.47, quick 1.2) reduce short-term operational risk | Low liquidity (current 0.71, quick 0.24) raises operational concerns |
| Environmental Risk | Standard industry risks; no recent major issues reported | Standard industry risks; no significant environmental events noted |
| Geopolitical Risk | US-based with some international exposure, moderate risk | US-centric with international segments, susceptible to trade policy shifts |
Hormel Foods presents lower financial risk and stronger liquidity, making it more stable operationally. Conagra’s higher debt and weaker liquidity ratios heighten its vulnerability, especially under tightening credit conditions. The most impactful risks for Conagra relate to financial leverage and operational liquidity, while Hormel’s key risk lies in moderate regulatory pressures within a competitive industry.
Which Stock to Choose?
Hormel Foods Corporation (HRL) shows a declining income trend with unfavorable net margin and EPS growth, but maintains a slightly favorable financial ratio profile. Its profitability is low, debt levels are moderate, and its rating is very favorable, supported by a safe Altman Z-Score and strong Piotroski Score. However, the company’s economic moat is very unfavorable due to declining ROIC below WACC, indicating value destruction.
Conagra Brands, Inc. (CAG) demonstrates a more favorable income statement with solid gross and EBIT margins, though revenue growth is negative. Financial ratios are slightly favorable but with weaker liquidity and higher debt levels. The rating is very favorable overall, despite very weak Piotroski and distress zone Altman Z-Score. CAG’s economic moat is slightly favorable, creating value but with a declining ROIC trend.
For investors prioritizing financial stability and a stronger balance sheet, HRL’s profile might appear more attractive due to its safer financial health and higher rating. Conversely, those focused on income statement strength and value creation, despite liquidity concerns, might find CAG’s metrics more appealing. The choice could therefore depend on an investor’s risk tolerance and investment strategy.
Disclaimer: Investment carries a risk of loss of initial capital. The past performance is not a reliable indicator of future results. Be sure to understand risks before making an investment decision.
Go Further
I encourage you to read the complete analyses of Hormel Foods Corporation and Conagra Brands, Inc. to enhance your investment decisions: