General Mills, Inc. (GIS) and Conagra Brands, Inc. (CAG) are two leading giants in the packaged foods industry, both delivering a diverse portfolio of well-known consumer brands. Their overlapping market presence in North America and shared focus on innovation in product variety and sustainability make them natural competitors. In this article, I will analyze their strengths and challenges to help you identify which company offers a more compelling investment opportunity in 2026.
Table of contents
Companies Overview
I will begin the comparison between General Mills, Inc. and Conagra Brands, Inc. by providing an overview of these two companies and their main differences.
General Mills Overview
General Mills, Inc. is a leading global manufacturer and marketer of branded consumer foods. The company operates across five segments, including North America Retail and Pet products. Its extensive product range includes ready-to-eat cereals, refrigerated yogurt, frozen dough, and pet food, marketed under well-known brands such as Cheerios, Häagen-Dazs, and Blue Buffalo. Headquartered in Minneapolis, it serves diverse retail and foodservice channels worldwide.
Conagra Brands Overview
Conagra Brands, Inc. is a North American consumer packaged goods company focusing on grocery, refrigerated, frozen, international, and foodservice segments. It offers a variety of shelf-stable and temperature-controlled food products sold under brands like Birds Eye, Duncan Hines, and Slim Jim. Based in Chicago, Conagra is known for catering to retail and foodservice markets, providing both branded and customized culinary products through multiple channels.
Key similarities and differences
Both companies operate in the packaged foods industry and serve retail and foodservice channels with a broad product portfolio. General Mills has a stronger international presence with segments including Europe, Australia, Asia, and Latin America, while Conagra emphasizes North American markets and international foodservice. General Mills also includes pet food products, which is absent from Conagra’s core offerings. Their product mix and geographic reach highlight distinct strategic focuses within the same sector.
Income Statement Comparison
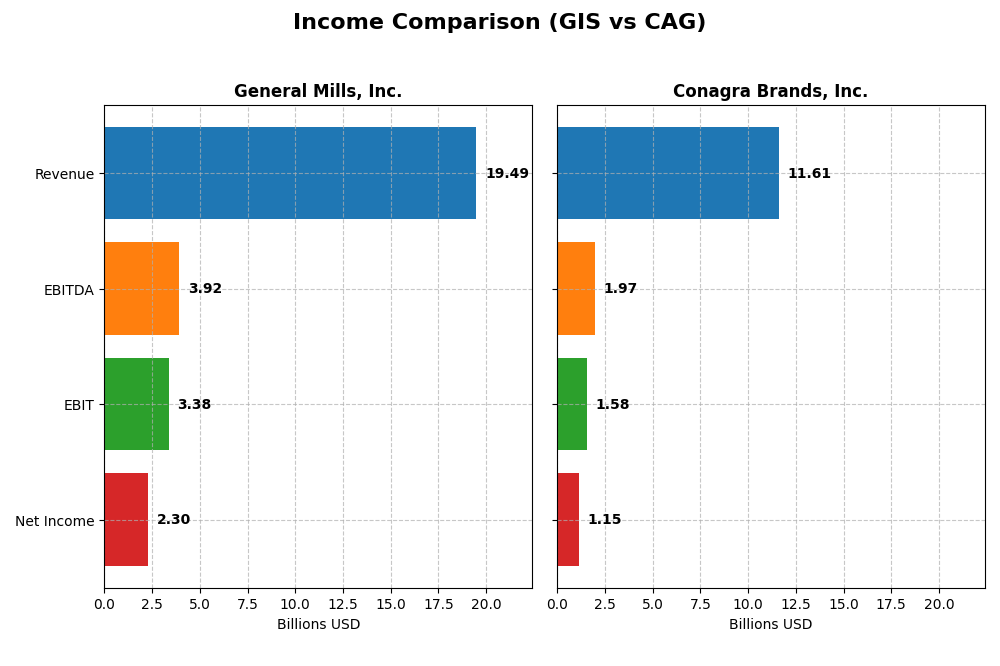
The table below compares key income statement metrics for General Mills, Inc. and Conagra Brands, Inc. for the fiscal year 2025.
| Metric | General Mills, Inc. (GIS) | Conagra Brands, Inc. (CAG) |
|---|---|---|
| Market Cap | 23.7B | 7.98B |
| Revenue | 19.49B | 11.61B |
| EBITDA | 3.92B | 1.97B |
| EBIT | 3.38B | 1.58B |
| Net Income | 2.29B | 1.15B |
| EPS | 4.12 | 2.41 |
| Fiscal Year | 2025 | 2025 |
Income Statement Interpretations
General Mills, Inc.
General Mills showed moderate revenue growth of 7.5% over 2021-2025 but experienced a slight decline of 1.87% in the latest year. Net income declined by 1.91% overall, with the most recent year down 6.32%. Margins remain strong and favorable, including a gross margin of 34.55% and net margin of 11.78%, though net margin contracted recently. The latest fiscal year saw slowed growth and margin compression.
Conagra Brands, Inc.
Conagra’s revenue grew modestly by 3.83% over the period but dropped 3.64% in the last year. Net income decreased 11.27% overall, though it surged sharply in the last year by 244.43%, reflecting a significant margin recovery. Margins are favorable, with a gross margin of 25.86% and net margin near 9.92%. The recent year’s strong net margin and EPS growth contrast with longer-term declines.
Which one has the stronger fundamentals?
General Mills maintains higher and more stable margins, yet its recent growth and profitability trends are unfavorable. Conversely, Conagra demonstrates stronger recent earnings and margin improvements despite weaker long-term growth and margins. Overall, Conagra shows a more favorable income statement evaluation, while General Mills displays more consistent profitability but faces recent headwinds.
Financial Ratios Comparison
The table below presents the most recent key financial ratios for General Mills, Inc. (GIS) and Conagra Brands, Inc. (CAG) for fiscal year 2025, offering a snapshot of their profitability, liquidity, leverage, and valuation metrics.
| Ratios | General Mills, Inc. (GIS) | Conagra Brands, Inc. (CAG) |
|---|---|---|
| ROE | 24.95% | 12.90% |
| ROIC | 9.62% | 7.36% |
| P/E | 12.90 | 9.30 |
| P/B | 3.22 | 1.20 |
| Current Ratio | 0.67 | 0.71 |
| Quick Ratio | 0.43 | 0.24 |
| D/E (Debt-to-Equity) | 1.66 | 0.93 |
| Debt-to-Assets | 46.25% | 39.70% |
| Interest Coverage | 6.02 | 3.27 |
| Asset Turnover | 0.59 | 0.55 |
| Fixed Asset Turnover | 4.83 | 4.09 |
| Payout ratio | 58.33% | 58.07% |
| Dividend yield | 4.52% | 6.25% |
Interpretation of the Ratios
General Mills, Inc. (GIS)
General Mills shows strong profitability with favorable net margin (11.78%) and return on equity (24.95%), though its price-to-book ratio (3.22) and liquidity ratios (current 0.67, quick 0.43) are weak. Debt levels are somewhat concerning with a debt-to-equity of 1.66. The company offers a solid dividend yield of 4.52%, supported by stable payout coverage, but cautious monitoring of debt is advisable.
Conagra Brands, Inc. (CAG)
Conagra presents neutral profitability ratios, including net margin (9.92%) and return on equity (12.9%), with favorable valuation metrics such as a low price-to-earnings ratio (9.3) and price-to-book ratio (1.2). Liquidity remains below ideal with a current ratio of 0.71 and quick ratio of 0.24. Dividend yield stands at 6.25%, reflecting moderate shareholder returns with a balanced risk profile.
Which one has the best ratios?
Both companies have a slightly favorable overall ratio profile, but General Mills leads in profitability and dividend stability, despite weaker liquidity and higher leverage. Conagra is stronger on valuation and maintains more moderate debt, though with less robust profitability. The choice depends on investor preference for income versus valuation and risk tolerance.
Strategic Positioning
This section compares the strategic positioning of General Mills, Inc. and Conagra Brands, Inc., focusing on market position, key segments, and exposure to technological disruption:
General Mills, Inc.
- Large market cap of 23.7B with diversified packaged foods, facing competitive pressure in global markets.
- Operates five segments including retail, foodservice, and pet products; broad product range including cereals, snacks, and pet food.
- No explicit data on technological disruption exposure provided; operates in traditional packaged food markets.
Conagra Brands, Inc.
- Smaller market cap of 7.98B, operating mainly in North America with competitive pressure in consumer packaged goods.
- Operates four segments: Grocery & Snacks, Refrigerated & Frozen, International, and Foodservice; focused on shelf-stable and temperature-controlled foods.
- No explicit data on technological disruption exposure provided; focused on food products for retail and foodservice channels.
General Mills, Inc. vs Conagra Brands, Inc. Positioning
General Mills exhibits a more diversified segment approach including pet food and international markets, while Conagra concentrates on North American grocery, refrigerated, and foodservice segments. General Mills benefits from broader product variety; Conagra’s focus may limit diversification but targets specific market niches.
Which has the best competitive advantage?
General Mills shows a very favorable MOAT with growing ROIC above WACC, indicating durable competitive advantage and efficient capital use. Conagra also creates value but with a slightly favorable MOAT and declining ROIC trend, suggesting weaker sustained profitability.
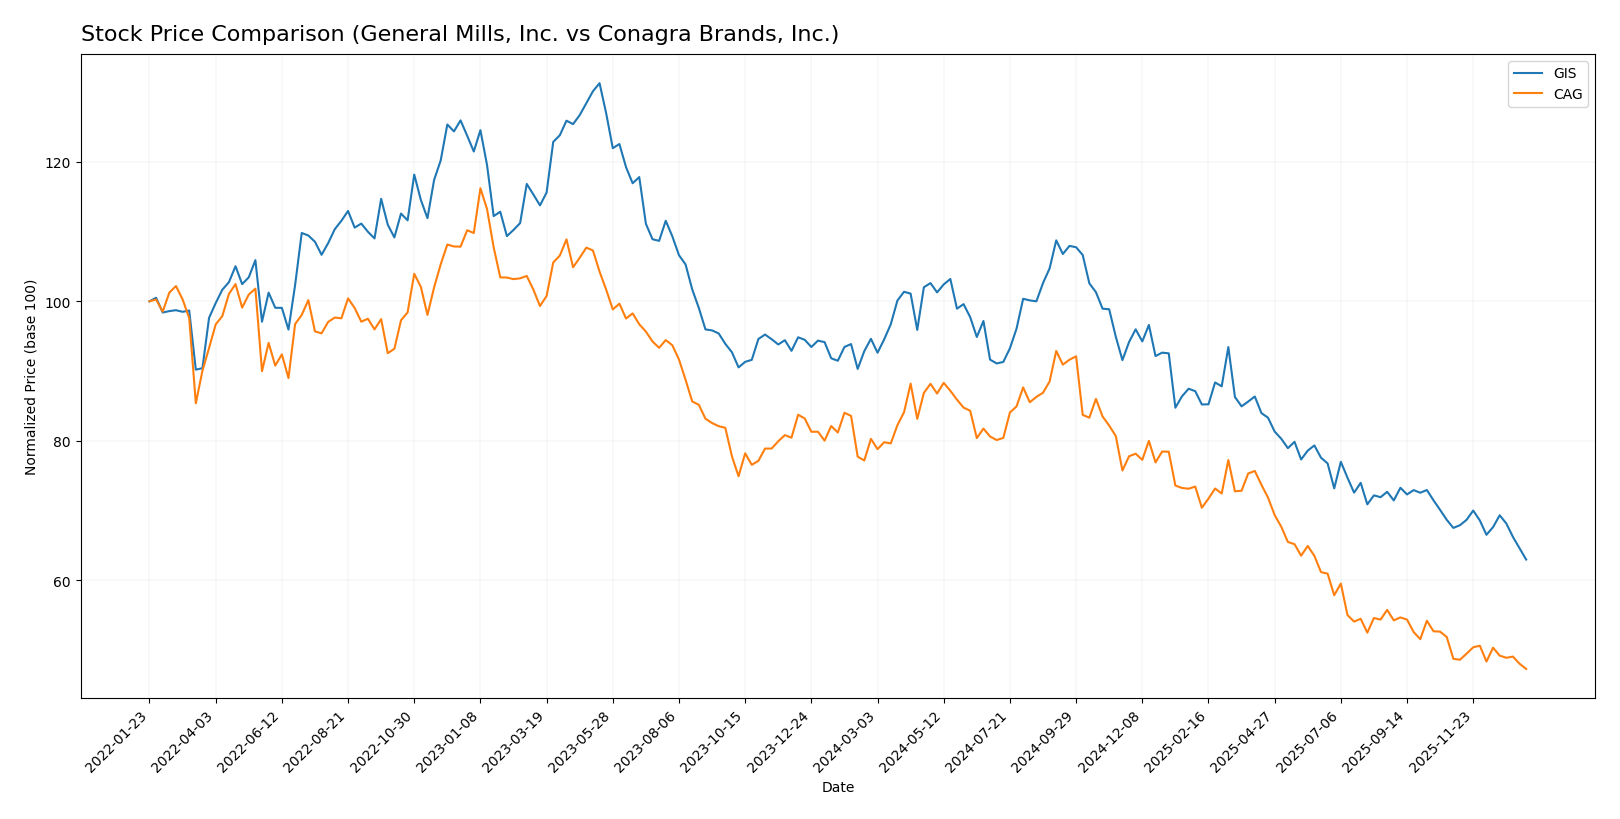
Stock Comparison
The stock prices of General Mills, Inc. (GIS) and Conagra Brands, Inc. (CAG) have both experienced significant declines over the past year, reflecting bearish trends with accelerating downward momentum.
Trend Analysis
General Mills, Inc. (GIS) shows a bearish trend over the past 12 months with a price decline of -33.44% and accelerating downward momentum, ranging between a high of 75.06 and a low of 43.48.
Conagra Brands, Inc. (CAG) also exhibits a bearish trend over the same period, with a steeper price drop of -41.08% and acceleration in the decline, fluctuating from a high of 32.74 to a low of 16.68.
Comparing both stocks, General Mills has delivered a higher market performance with a smaller percentage loss than Conagra over the past year.
Target Prices
The consensus target prices for General Mills, Inc. and Conagra Brands, Inc. reflect moderate upside potential.
| Company | Target High | Target Low | Consensus |
|---|---|---|---|
| General Mills, Inc. | 63 | 47 | 52.2 |
| Conagra Brands, Inc. | 22 | 16 | 18.6 |
Analysts expect General Mills’ stock to trade moderately above its current price of 43.48 USD, while Conagra Brands shows a target slightly above its current 16.68 USD, indicating cautious optimism for both.
Analyst Opinions Comparison
This section compares analysts’ ratings and financial scores for General Mills, Inc. (GIS) and Conagra Brands, Inc. (CAG):
Rating Comparison
GIS Rating
- Rating: A- indicating a very favorable overall assessment.
- Discounted Cash Flow Score: 5, very favorable, suggesting undervaluation.
- ROE Score: 5, very favorable, showing efficient profit generation from equity.
- ROA Score: 4, favorable, indicating effective use of assets.
- Debt To Equity Score: 1, very unfavorable, indicating high financial risk.
- Overall Score: 4, favorable overall financial standing.
CAG Rating
- Rating: B- indicating a very favorable overall assessment.
- Discounted Cash Flow Score: 5, very favorable, suggesting undervaluation.
- ROE Score: 1, very unfavorable, showing poor profit generation from equity.
- ROA Score: 1, very unfavorable, indicating poor asset utilization.
- Debt To Equity Score: 2, moderate, indicating some financial leverage risk.
- Overall Score: 2, moderate overall financial standing.
Which one is the best rated?
Based strictly on the provided data, GIS is better rated with a higher overall score (4 vs. 2), stronger ROE and ROA scores, despite a less favorable debt-to-equity rating compared to CAG.
Scores Comparison
Here is a comparison of the financial health scores for General Mills, Inc. and Conagra Brands, Inc.:
GIS Scores
- Altman Z-Score: 2.43, placing GIS in the grey zone, indicating moderate bankruptcy risk.
- Piotroski Score: 6, assessed as average financial strength.
CAG Scores
- Altman Z-Score: 1.48, placing CAG in the distress zone, indicating high bankruptcy risk.
- Piotroski Score: 3, assessed as very weak financial strength.
Which company has the best scores?
Based on the provided scores, General Mills (GIS) shows stronger financial health with a grey zone Altman Z-Score and average Piotroski Score. Conagra Brands (CAG) exhibits weaker scores, including a distress zone Altman Z-Score and a very weak Piotroski Score.
Grades Comparison
The grades from multiple reputable institutions for General Mills, Inc. and Conagra Brands, Inc. are presented below:
General Mills, Inc. Grades
This table summarizes recent grades assigned by recognized grading companies for General Mills, Inc.:
| Grading Company | Action | New Grade | Date |
|---|---|---|---|
| Wells Fargo | Maintain | Equal Weight | 2026-01-05 |
| Morgan Stanley | Maintain | Underweight | 2025-12-22 |
| Wells Fargo | Maintain | Equal Weight | 2025-12-18 |
| TD Cowen | Maintain | Hold | 2025-12-18 |
| Bernstein | Maintain | Market Perform | 2025-12-18 |
| TD Cowen | Maintain | Hold | 2025-12-15 |
| Wells Fargo | Maintain | Equal Weight | 2025-12-12 |
| Stifel | Maintain | Buy | 2025-12-11 |
| Jefferies | Maintain | Hold | 2025-12-11 |
| Mizuho | Maintain | Neutral | 2025-09-19 |
Overall, General Mills’ grades generally indicate a moderate outlook with a majority maintaining hold or equal weight ratings and few buy recommendations.
Conagra Brands, Inc. Grades
This table summarizes recent grades assigned by recognized grading companies for Conagra Brands, Inc.:
| Grading Company | Action | New Grade | Date |
|---|---|---|---|
| Wells Fargo | Maintain | Equal Weight | 2026-01-05 |
| UBS | Maintain | Neutral | 2025-12-23 |
| Morgan Stanley | Maintain | Equal Weight | 2025-12-22 |
| Deutsche Bank | Maintain | Hold | 2025-12-22 |
| RBC Capital | Maintain | Sector Perform | 2025-12-22 |
| Evercore ISI Group | Maintain | In Line | 2025-12-22 |
| TD Cowen | Maintain | Hold | 2025-12-22 |
| B of A Securities | Maintain | Underperform | 2025-12-22 |
| JP Morgan | Maintain | Neutral | 2025-12-16 |
| Wells Fargo | Maintain | Equal Weight | 2025-12-12 |
Conagra’s ratings mostly cluster around hold, equal weight, and neutral, with one underperform rating, reflecting a cautious stance.
Which company has the best grades?
Both General Mills, Inc. and Conagra Brands, Inc. have predominantly hold or equal weight ratings, but General Mills shows a slightly more positive bias with a buy rating from Stifel. This may suggest marginally higher confidence from some analysts, potentially impacting investor sentiment toward moderate stability with selective upside.
Strengths and Weaknesses
Below is a comparison table highlighting key strengths and weaknesses of General Mills, Inc. (GIS) and Conagra Brands, Inc. (CAG) based on their recent financial and operational data.
| Criterion | General Mills, Inc. (GIS) | Conagra Brands, Inc. (CAG) |
|---|---|---|
| Diversification | Broad product range including snacks, pet food, dairy, and baking mixes; balanced revenue streams across segments totaling over 17B USD in 2025 | Strong focus on grocery, snacks, refrigerated and frozen foods; international segment growing but less diversified product categories |
| Profitability | Higher net margin (11.78%) and ROE (24.95%); ROIC of 9.62% with growing trend; company creating value with very favorable moat | Moderate net margin (9.92%) and ROE (12.9%); ROIC of 7.36% but declining trend; slightly favorable moat indicating some profitability challenges |
| Innovation | Consistent investment reflected in strong ROIC growth and favorable asset turnover ratios | Innovation less evident; declining ROIC trend suggests challenges maintaining profitability through innovation |
| Global presence | Solid global footprint with diverse product lines including pet segment and super-premium ice cream | Expanding international sales (~1B USD) but less pronounced global diversification |
| Market Share | Strong in snacks and cereals, supported by diversified segments | Solid presence in grocery and frozen foods, but market share growth constrained by declining profitability |
In summary, General Mills demonstrates a more durable competitive advantage with diversified products and improving profitability. Conagra is creating value but faces challenges in sustaining growth and innovation, reflected in its declining ROIC trend. Investors should weigh GIS’s stability against CAG’s potential risks.
Risk Analysis
Below is a comparison of key risks affecting General Mills, Inc. (GIS) and Conagra Brands, Inc. (CAG) as of 2025:
| Metric | General Mills, Inc. (GIS) | Conagra Brands, Inc. (CAG) |
|---|---|---|
| Market Risk | Moderate, stable demand but price sensitivity to commodity costs | Moderate, exposed to changing consumer preferences and competition |
| Debt level | High debt-to-equity ratio at 1.66 (unfavorable), interest coverage favorable | Moderate debt-to-equity at 0.93 (neutral), interest coverage moderate |
| Regulatory Risk | Moderate, subject to food safety and labeling regulations in multiple regions | Moderate, similar regulatory environment with exposure to international rules |
| Operational Risk | Medium, complex supply chain and product diversity | Medium, reliance on both retail and foodservice channels |
| Environmental Risk | Medium, increasing focus on sustainability and packaging waste | Medium, sustainability initiatives underway but some legacy operations impact |
| Geopolitical Risk | Low to moderate, global presence but largely North America focused | Low to moderate, some international exposure increases geopolitical sensitivity |
General Mills faces notable leverage risk with a high debt-to-equity ratio despite solid interest coverage, while Conagra’s financial distress risk is elevated with a lower Altman Z-score in the distress zone. Operational and regulatory risks remain moderate for both, with market conditions and evolving consumer trends as key drivers. Environmental and geopolitical risks are present but less impactful currently. Investors should monitor debt management and margin stability closely.
Which Stock to Choose?
General Mills, Inc. (GIS) shows a mixed income evolution with slight revenue and net margin declines recently, but retains favorable profitability and a very favorable rating (A-). Its financial ratios are slightly favorable overall, despite some concerns about liquidity and leverage. The company demonstrates a very favorable moat with a growing return on invested capital significantly above its cost of capital.
Conagra Brands, Inc. (CAG) presents a favorable income statement trend with improving margins and earnings growth last year, though overall period growth is less robust. Its financial ratios are slightly favorable, showing moderate leverage and weaker profitability metrics. The moat is slightly favorable but marked by declining ROIC, and the rating is very favorable (B-) albeit with some score weaknesses.
Investors focused on durable competitive advantage and profitability might find GIS appealing due to its strong moat and solid rating. Conversely, those valuing recent earnings momentum and a lower valuation profile could see potential in CAG, despite its declining profitability trend and weaker financial scores. The choice might depend on the investor’s risk tolerance and preference for stability versus growth potential.
Disclaimer: Investment carries a risk of loss of initial capital. The past performance is not a reliable indicator of future results. Be sure to understand risks before making an investment decision.
Go Further
I encourage you to read the complete analyses of General Mills, Inc. and Conagra Brands, Inc. to enhance your investment decisions: